Sigma Metric Analysis
Sysmex XE 2100
Recently a workshop participant provided evaluation data for the Sysmex XE 2100 . This was evaluation data for three controls, precision data on 2 runs daily for 20 days. The data gives a good estimate for total imprecision, a figure which would be larger than any generated by a within-run precision study.
March 2007
 |
[Note: This QC application is an extension of the lesson From Method Validation to Six Sigma: Translating Method Performance Claims into Sigma Metrics. This article assumes that you have read that lesson first, and that you are also familiar with the concepts of QC Design, Method Validation, and Six Sigma. If you aren't, follow the links provided.] |  |
Recently a participant at our workshop provided evaluation data for the Sysmex XE 2100 . This was evaluation data for three controls, precision data on 2 runs daily for 20 days. The data gives a good estimate for total imprecision, a figure which would be larger than any generated by a within-run precision study.
The CVs and Sigma metrics
The TEa figure in the title of the table lists the Total Allowable Error, as specified by the CLIA proficiency testing criteria. The EZ Rules(r) 3 software was used to perform QC Design, generate OPSpecs charts, and recommend the proper control rules.
Bias data was not provided. However, we can estimate allowable bias by working the Sigma equation backwards. That is, if we want to achieve Six Sigma, we can calculate how much bias is tolerable given the CV data.
Leukocytes (WBC )
| WBC TEa=15% | Imprecision | Sigma metric | QC Rule Recommendation | Allowable bias at Six Sigma |
Allowable bias at Five Sigma |
| Low |
2.59%
|
5.79
|
13.5s N=3
|
none
|
2.05%
|
| Normal |
1.75%
|
8.57
|
13.5s N=3
|
4.5%
|
6.25%
|
| High |
2.99%
|
5.02
|
13s N=3
|
none
|
0.05%
|
| Average of All Results |
2.44%
|
6.46
|
13.5s N=3
|
0.34%
|
2.78%
|
Not much needs to be said here. The method is world class.
Erythrocytes (RBC)
| RBC TEa=6% | Imprecision | Sigma metric | QC Rule Recommendation | Allowable bias at Six Sigma |
Allowable bias at Five Sigma |
| Low |
0.77%
|
7.79
|
13.5s N=3
|
1.38%
|
2.15%
|
| Normal |
0.80%
|
7.50
|
13.5s N=3
|
1.2%
|
2.0%
|
| High |
1.03%
|
5.83
|
13.5s N=3
|
none
|
0.85%
|
| Average of All Results |
0.87%
|
7.04
|
13.5s N=3
|
0.80%
|
1.67%
|
Note that the CLIA quality requirement is quite tight. Nevertheless, the method achieves world class performance and can still tolerate a small bias.
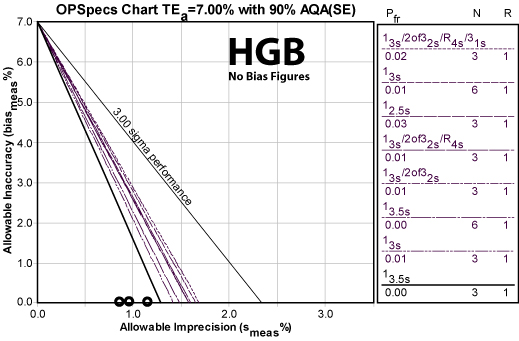
Hemoglobin
| HGB TEa=7% | Imprecision | Sigma metric | QC Rule Recommendation | Allowable bias at Six Sigma |
Allowable bias at Five Sigma |
| Low |
0.78%
|
8.97
|
13.5s N=3
|
2.32%
|
3.1%
|
| Normal |
1.2%
|
5.83
|
13.5s N=3
|
none
|
1.0%
|
| High |
0.92%
|
7.61
|
13.5s N=3
|
1.48%
|
2.4%
|
| Average of All Results |
0.97%
|
7.47
|
13.5s N=3
|
1.2%
|
2.17%
|
Again, a world class method.
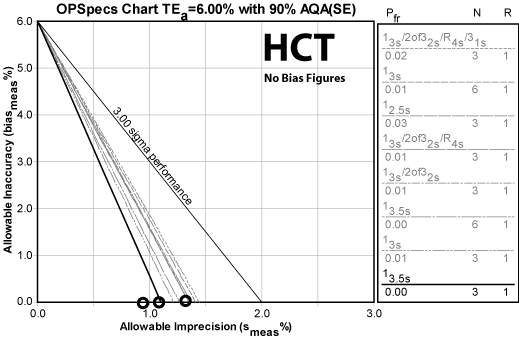
HCT
| HCT TEa=6.0% | Imprecision | Sigma metric | QC Rule Recommendation | Allowable bias at Six Sigma |
Allowable bias at Five Sigma |
| Low |
0.89%
|
6.74
|
13.5s N=3
|
0.66%
|
1.55%
|
| Normal |
1.31%
|
4.58
|
12.5s N=3
|
none
|
none
|
| High |
1.13%
|
5.31
|
13s N=3
|
none
|
0.35%
|
| Average of All Results |
1.11
|
5.54
|
13s N=3
|
none
|
0.45%
|
Another method with a tight quality requirement. This is the most troublesome method in the data, with one level falling below 5 Sigma performance. But if that's the worst it gets, that's really not too bad. If you use average performance as your design settings, you're still above 5 Sigma overall - meaning you can have the same wide limits as the previous analytes.
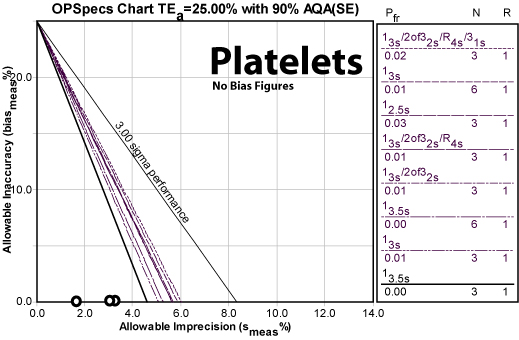
Platelets
| PLT TEa=25% | Imprecision | Sigma metric | QC Rule Recommendation | Allowable bias at Six Sigma |
Allowable bias at Five Sigma |
| Low |
3.32%
|
7.53
|
13.5s N=3
|
5.08%
|
8.4%
|
| Normal |
3.12%
|
8.01
|
13.5s N=3
|
6.28%
|
9.4%
|
| High |
1.87%
|
13.37
|
13.5s N=3
|
13.78%
|
15.65%
|
| Average of All Results |
2.77%
|
9.64
|
13.5s N=3
|
8.38%
|
11.15%
|
Even though the CV values of this method are much higher than any of the previous analytes, the method performs the best of all. Clearly, success is relative: the previous methods had very tight quality requirements, while platelets have one of the largest allowable errors. Nevertheless, this is a world class method, capable of performing at Six Sigma even if large analytical biases are present.
Conclusions
This is another instance where there is a lot of good news. The Sysmex XE 2100 achieves world class performance for nearly all the analytes at nearly all levels - in this laboratory. Using Normalized OPSpecs charts, we can merge and plot all the data of the methods on one chart, giving a graphic sense of how well this system performs.
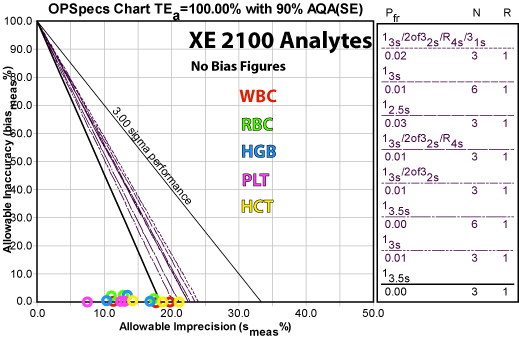
You can the distance between the x-axis and the performance of the different control rules. That represents the allowable bias in a normalized form. While some data points are right near the line, others have quite a bit of tolerable bias.
Here is a summary of the recommended QC rules and the resulting reductions in false rejection from common control practices:
| Analyte | QC Rule Implemented | False Rejection (Pfr) | Reduction from 12s rule N=3 Pfr (0.14) |
Reduction from full "Westgard Rules" N=3 (Pfr =0.02) |
| HCT |
13s with N=3
|
0.01
|
93% reduction in false rejections
|
50% reduction in false rejections
|
| HGB |
13.5s with N=3
|
essentially zero
|
nearly 100% reduction
|
nearly 100% reduction
|
| RBC |
13.5s with N=3
|
essentially zero
|
nearly 100% reduction
|
nearly 100% reduction
|
| WBC |
13.5s with N=3
|
essentially zero
|
nearly 100% reduction
|
nearly 100% reduction
|
| PLT |
13.5s with N=3
|
essentially zero
|
nearly 100% reduction
|
nearly 100% reduction
|