Sigma Metric Analysis
Comparison of a Vitros 5600, an Hitachi 7170, and a Roche Cobas 8000
What happens when a hospital has multiple analyzers, "closed systems", "open systems" and "mixed systems"? When we use different analyzers, reagents, and calibrators, can we assume the results will always be comparable? NO. No, we can not.
Sigma-metrics comparison of a Vitros 5600, Hitachi 7170, and a Roche Cobas 8000
- The Precision and Comparison data
- Determine quality requirements at the critical decision level
- Calculate Sigma metrics
- Summary of Performance by Sigma-metrics chart
- Conclusion
January 2017
Sten Westgard, MS
[Note: This QC application is an extension of the lesson From Method Validation to Six Sigma: Translating Method Performance Claims into Sigma Metrics. This article assumes that you have read that lesson first, and that you are also familiar with the concepts of QC Design, Method Validation, and Six Sigma. If you aren't, follow the link provided.]
Clinical Laboratory published a Chinese study from Tianjin Medical University. The Chinese Laboratory Marketplace is unique because not only are the typical "closed sytems" of the major manufacturers present, but there are "more than 100 diagnostic reagent kit suppliers. In an effort to reduce testing costs many laboratories chose 'open system' or 'mixed system' which means that the reagent and analyzer are not matched....[S]ome laboratories use other calibrators rather than using the matching calibrators. Thus, results can have large variations between different diagnostics systems which cause big troubles for traceability and impairs the quality and reliability of our services."
Methods Comparison and Bias Estimation of Three Distinct Biochemistry Analytical Systems in One Clinical Laboratory Usign Patient Samples Fu, H, Yan, S, Wang Y, Gu D, Li X, Yang G, Liu Y, Clin Lab 2016;62:187-194.
In this study, two different instruments were compared against a third instrument, which served as a de facto local reference method. The "reference" instrument was the Roche Cobas 8000. The two other instruments were the Vitros 5600 and the Hitachi 7170. For the Vitros, the reagents kits, calibrators, and QC materials were from the manufacturer. For the Hitachi, reagent kits and calibrators for the lipids were from Leademan (Beijing, China), while the lipid reagents were obtained from Sekisui and the calibrators from c. fas Lipids (Roche, Germany). Beckman LX20 was used for the reagents and calibrators for the electrolytes.
The Imprecision and Bias Data
"Commercial control samples were used for determination of between-day imprecision." The table lists the number of days as N=30.
A comparative study was performed using actual patient samples. "All 40 samples were run in duplicate by three diagnostic systems. Aliquots of each sample were analyzed sequentially in the first run and then reversed. Results of measurements were compared following CLSI guideline EP9-A2. The correlation and bias of each analyte between the reference system and test systems were evaluated and calculated by linear regression and Bland and Altman plot."
In other words, this study did a very good job of collecting both imprecision and bias data. The study provided different amounts of data for each instrument. We have more analytes with both imprecision and bias data on the Hitachi 7170 than we do for the Vitros 5600.
Remember we are using the regression equation to calculate the bias at the level where the imprecision was measured.
For example, with the Vitros 5600, at a level of 2.5, the regression equation is 0.988 and the y-intercept is - 0.95.
Thus the Vitros value = (0.988 * Cobas 8000 value) - 0.95
Vitros value = (0.988 * 2.5) - 0.95
= 2.47 - 0.95
= 1.52
The bias is therefore (1.52 - 2.5 ) / 2.5
= -0.98 / 2.5
= -39.2% bias for Albumin on the Vitros 5600. Representing a significant difference between the Cobas 8000 and the Vitros 5600 results.
[We will use the absolute value of the bias (that is, 39.2%) when we calculate Sigma-metrics.]
| Vitros 5600 | Mean | slope | y-intercept | bias units | CV | Bias % |
| Albumin | 2.50 | 0.988 | -0.950 | -0.98 | 2.45 | -39.20 |
| Alk Phosphatase | 150.00 | 0.979 | 27.650 | 24.50 | 1.74 | 16.33 |
| ALT | 95.00 | 1.289 | 5.665 | 33.12 | 3.71 | 34.86 |
| AST/GOT | 40.00 | 1.279 | 1.025 | 12.19 | 2.94 | 30.46 |
| Calcium | 2.26 | 1.098 | -0.058 | 0.16 | 2.11 | 7.23 |
| Chloride | 100.00 | 0.899 | 12.880 | 2.78 | 1.48 | 2.78 |
| CK | 275.00 | 0.922 | 2.094 | -19.36 | 2.97 | 7.04 |
| Creatinine | 176.80 | 0.913 | -8.059 | -23.44 | 2.53 | 13.26 |
| GGT | 85.00 | 1.036 | -8.596 | -5.54 | 3.24 | 6.51 |
| Glucose | 6.66 | 1.001 | -0.652 | -0.65 | 1.54 | 9.69 |
| LD | 170.00 | 0.840 | 18.500 | -8.70 | 3.21 | 5.12 |
| Sodium | 115.00 | 0.964 | 4.322 | 0.18 | 1.38 | 0.16 |
| Total Protein | 57.00 | 1.006 | 0.160 | 0.50 | 2.66 | 0.88 |
| Uric Acid | 196.28 | 0.973 | -0.473 | -5.77 | 1.96 | 2.94 |
| Hitachi 7170 | Mean | slope | y-intercept | bias units | CV | Bias % |
| Albumin | 2.50 | 0.995 | 0.42 | 0.40 | 3 | 16.10 |
| Alk Phosphatase | 150.00 | 0.904 | -2.81 | -17.21 | 4.56 | 11.47 |
| ALT | 95.00 | 1.075 | 2.47 | 9.60 | 2.48 | 10.10 |
| AST/GOT | 40.00 | 0.918 | 7.40 | 4.12 | 1.88 | 10.31 |
| Calcium | 2.26 | 0.987 | 0.03 | 0.00 | 1.9 | 0.15 |
| Chloride | 100.00 | 0.935 | 6.52 | 0.02 | 1.06 | 0.02 |
| CO2 | 25.00 | 0.919 | 0.83 | -1.20 | 7.03 | 4.79 |
| Cholesterol | 4.66 | 0.975 | 0.09 | -0.02 | 2.96 | 0.48 |
| CK | 275.00 | 1.063 | 0.32 | 17.65 | 1.22 | 6.42 |
| Creatinine | 176.80 | 1.067 | -3.24 | 8.61 | 2.18 | 4.87 |
| GGT | 85.00 | 0.936 | 1.91 | -3.53 | 2.28 | 4.15 |
| Glucose | 6.66 | 1.003 | -0.04 | -0.02 | 1.83 | 0.35 |
| HDL | 1.30 | 1.016 | 0.01 | 0.03 | 4.53 | 2.45 |
| hs CRP | 3.00 | 1.003 | 0.04 | 0.04 | 4.2 | 1.50 |
| Lactate | 1.60 | 1.031 | 0.06 | 0.11 | 1.72 | 6.98 |
| LD | 170.00 | 1.017 | -11.71 | -8.82 | 2.02 | 5.19 |
| Magnesium | 1.03 | 0.806 | 0.12 | -0.08 | 2.62 | 7.82 |
| Phosphorous | 1.29 | 1.024 | -0.10 | -0.07 | 1.7 | 5.11 |
| Potassium | 2.50 | 0.971 | 0.10 | 0.02 | 1.22 | 0.98 |
| Sodium | 115.00 | 1.050 | 0.93 | 6.68 | 1.22 | 5.81 |
| Total Bilirubin | 51.30 | 0.912 | 1.40 | -3.11 | 3.93 | 6.07 |
| Direct Bilirubin | 5.13 | 0.814 | 1.33 | 0.37 | 3.02 | 7.31 |
| Triglycerides | 1.47 | 1.016 | -0.04 | -0.02 | 2.56 | 1.05 |
| Total Protein | 57.00 | 0.978 | 1.96 | 0.70 | 1.86 | 1.23 |
| Urea | 14.28 | 0.901 | 0.56 | -0.85 | 4.71 | 5.97 |
| Uric Acid | 196.28 | 0.981 | -1.67 | -5.40 | 1.42 | 2.75 |
Yes, that is a whole lot of numbers! What do they all mean? In the absence of context, it's often hard to know. There are a few analytes where bias does seem rather high (Albumin, ALT, AST on both the Vitros 5600 and the Hitachi 7170). But we'll have to see whether the context of the allowable error is such that it allows that bias.
Determine Quality Requirements at the decision levels
Now that we have our imprecision and bias data, we're almost ready to calculate our Sigma-metrics. We're just missing one critical component: the analytical quality requirement. In this study, the majoritory of the analytes were covered by CLIA analytical performance specifications. While the study focused just on bias, since they included the imprecision data, we can determine the Sigma-metrics.
| Assay | CLIA TEa | Mean |
| Albumin | 10.00 | 2.50 |
| Alk Phosphatase | 30.00 | 150.00 |
| ALT | 20.00 | 95.00 |
| AST/GOT | 20.00 | 40.00 |
| Calcium | 11.06 | 2.26 |
| Chloride | 5.00 | 100.00 |
| CO2 | 25.00 | 25.00 |
| Cholesterol | 10.00 | 4.66 |
| CK | 30.00 | 275.00 |
| Creatinine | 15.00 | 176.80 |
| GGT | 22.11 | 85.00 |
| Glucose | 10.00 | 6.66 |
| HDL | 30.00 | 1.30 |
| hs CRP | 56.60 (Ricos) |
3.00 |
| Lactate | 30.40 (Ricos) |
1.60 |
| LD | 20.00 | 170.00 |
| Magnesium | 25.00 | 1.03 |
| Phosphorous | 10.70 (Ricos) |
1.29 |
| Potassium | 20.00 | 2.50 |
| Sodium | 3.48 | 115.00 |
| Total Bilirubin | 20.00 | 51.30 |
| Direct Bilirubin | 44.50 (Ricos) |
5.13 |
| Triglycerides | 25.00 | 1.47 |
| Total Protein | 10.00 | 57.00 |
| Urea | 9.00 | 14.28 |
| Uric Acid | 17.00 | 196.28 |
Note that the majority of the performance specifications we use here are CLIA goals, but where CLIA does not provide a goal, we have opted to select the desirable specifications for allowable total error from the biologic variation database ("Ricos goals"). Also note in cases where the CLIA allowable total error is expressed in units, that means that the % goal is different at each level - so those goals are listed in each row of the table, where necessary.
Now we have all the numbers we need for Sigma-metrics.
Calculate Sigma metrics
Sigma-metrics takes both imprecision and bias into account in a single equation. We're going to calculate Sigma-metrics using both "Ricos goals" and the CLIA goals.
Remember the equation for Sigma metric is (TEa - bias%) / CV.
Example calculation: for the Vitros 5600, Albumin has a 10% quality requirement, given 7.4% imprecision and 17.15% bias:
(10 - 39.2) / 2.45 = -29.2 / 2.45 = negative
Once we get below zero, there is not a useful value to the Sigma-metric equation. We simply know that the verdict on this Albumin assay is harsh. Results are going to be significantly different between the two instruments.
Let's try to use the Sigma-metric equation in a slightly better case. The Hitachi 7170 Albumin. Again the TEa is 10%, but this time, bias is 16.1% and the imprecision is 3%.
(10 - 16.1) / 3 = -6.1 / 3 = negative
Whoops. Okay, the Hitachi value is also very different than the Cobas 8000 value. This is disconcerting, to think that there are three instruments in this health care system, and they are all going to give significantly different results.
Let's try to find an example where there is some good news. Take Alkaline Phosphatase on the Vitros 5600, where TEa is 30%, bias is 16.33% and imprecision is 1.74%.
(30 - 16.33) / 1.74 = 13.67 / 1.74 = 7.86 = >6 Sigma
So here we have an assay that is better than Six Sigma. In practical terms, it's not significant that there is a 7 Sigma or 7.8 Sigma. This assay has simply achieved the Six Sigma performance.
So here's the table with all the Sigma-metrics using the (again mostly CLIA) analytical performance goals:
| Vitros 5600 | TEa |
CV | Bias % | Sigma-metric |
| Albumin | 10.00 | 2.45 | -39.20 | negative |
| Alk Phosphatase | 30.00 | 1.74 | 16.33 | >6 |
| ALT | 20.00 | 3.71 | 34.86 | -4.01 |
| AST/GOT | 20.00 | 2.94 | 30.46 | negative |
| Calcium | 11.06 | 2.11 | 7.23 | 1.81 |
| Chloride | 5.00 | 1.48 | 2.78 | 1.50 |
| CK | 30.00 | 2.97 | 7.04 | >6 |
| Creatinine | 15.00 | 2.53 | 13.26 | 0.69 |
| GGT | 22.11 | 3.24 | 6.51 | 4.81 |
| Glucose | 10.00 | 1.54 | 9.69 | 0.20 |
| LD | 20.00 | 3.21 | 5.12 | 4.64 |
| Sodium | 3.48 | 1.38 | 0.16 | 2.41 |
| Total Protein | 10.00 | 2.66 | 0.88 | 3.43 |
| Uric Acid | 17.00 | 1.96 | 2.94 | >6 |
Now here's the Hiatchi 7170
| Hitachi 7170 | TEa | CV | Bias % | Sigma- metric |
| Albumin | 10.00 | 3 | 16.10 | negative |
| Alk Phosphatase | 30.00 | 4.56 | 11.47 | 4.06 |
| ALT | 20.00 | 2.48 | 10.10 | 3.99 |
| AST/GOT | 20.00 | 1.88 | 10.31 | 5.16 |
| Calcium | 11.06 | 1.9 | 0.15 | 5.74 |
| Chloride | 5.00 | 1.06 | 0.02 | 4.70 |
| CO2 | 25.00 | 7.03 | 4.79 | 2.87 |
| Cholesterol | 10.00 | 2.96 | 0.48 | 3.21 |
| CK | 30.00 | 1.22 | 6.42 | >6 |
| Creatinine | 15.00 | 2.18 | 4.87 | 4.65 |
| GGT | 22.11 | 2.28 | 4.15 | >6 |
| Glucose | 10.00 | 1.83 | 0.35 | 5.28 |
| HDL | 30.00 | 4.53 | 2.45 | >6 |
| hs CRP | 56.60 | 4.2 | 1.50 | >6 |
| Lactate | 30.40 | 1.72 | 6.98 | >6 |
| LD | 20.00 | 2.02 | 5.19 | >6 |
| Magnesium | 25.00 | 2.62 | 7.82 | >6 |
| Phosphorous | 10.70 | 1.7 | 5.11 | 3.29 |
| Potassium | 20.00 | 1.22 | 0.98 | >6 |
| Sodium | 3.48 | 1.22 | 5.81 | negative |
| Total Bilirubin | 20.00 | 3.93 | 6.07 | 3.54 |
| Direct Bilirubin | 44.50 | 3.02 | 7.31 | >6 |
| Triglycerides | 25.00 | 2.56 | 1.05 | >6 |
| Total Protein | 10.00 | 1.86 | 1.23 | 4.71 |
| Urea | 9.00 | 4.71 | 5.97 | 0.64 |
| Uric Acid | 17.00 | 1.42 | 2.75 | >6 |
Just to re-emphasize two points: any Sigma-metric above 6 is simply treated the same way as Six Sigma. Similarly, the Sigma-metrics that are "below zero" are not necessarily worse - but they do indicate that the bias is significant. Any time the bias exceeds the allowable total error, you will find a Sigma-metric of zero. This essentially means that the difference between the comparative method and the new method is so large that they are effectively aiming at different targets. The next question is now: which method is correct? A more important question comes up when all the different methods are in the same healthcare system: how does a clinician interpret results for a single patient if they've have their blood tested on these different instruments?
Overall, there are a lot of troubling metrics here, particularly for the Vitros 5600. The Hitachi 7170 has several assays performing at world class, but a few that are also in low Sigma or negative territory.
Summary of Performance by Sigma-metrics Method Decision Chart and OPSpecs chart
We can make visual assessments of this performance using a Normalized Sigma-metric Method Decision Chart:
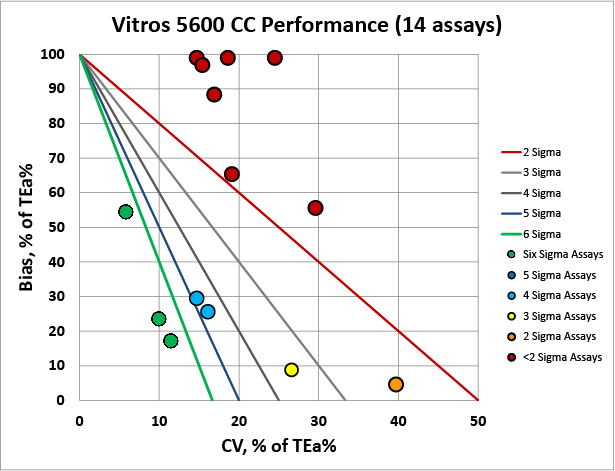
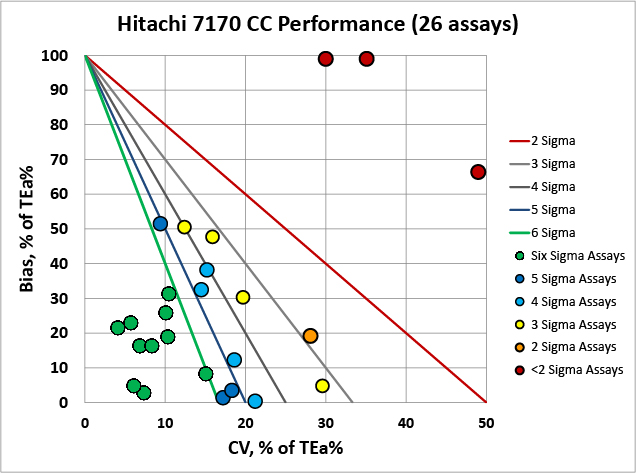
It's very clear that the Hitachi 7170 is more comparable with the Cobas 8000 than the Vitros 5600.
Now what about QC? How do we monitor and control these methods? For that, we would usually need a Normalized OPSpecs chart. However, because the differences between methods are so significant, we should probably stop and consider our options.
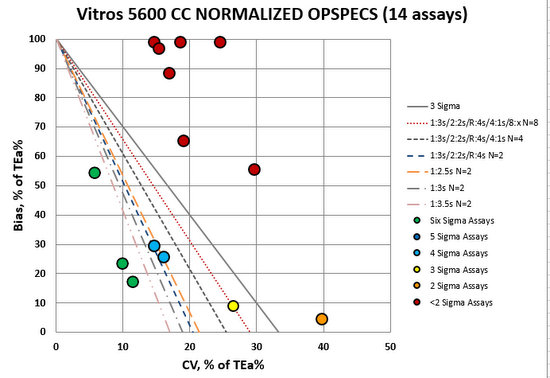
For many of these Vitro methods, we need "maximum QC": a lot of "Westgard Rules", a lot of controls, and probably we should consider more frequent QC and maybe even watching average of normals. Very few assays are in the bull's-eye here, which means this will take more time, effort, resources, and money to operate this instrument. Most critically, we need some way to reconcile the significant differences between the instrument results.
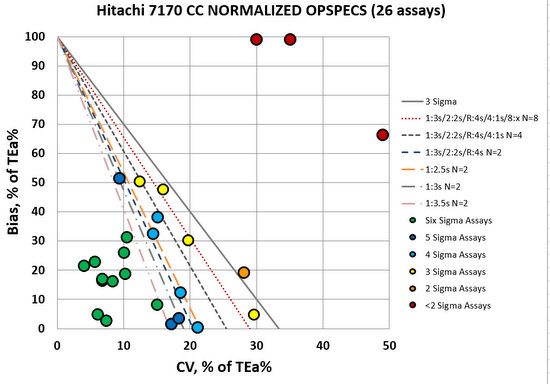
Compared to the Vitros 5600, the Hitachi 7170 looks much better. Many assays in the bull's-eye, many assays that are going to be easily controlled with 2.5s, 3s, or even 3.5s control limits and just 2 controls per run. This is an opportunity to make some efficiency gains. Now we still have three methods in the red - these need "maximum QC", so it's not as if we're free and clear here.
The authors also commented on these significant biases: "[C]onsidering the significant unparallel results between dry and wet chemical analytical systems, reference intervals should be validated and transferred from Cobas 8000 to Vitros 5600 based on CLSI documents C28-A3.... Furthermore, users should clearly define the application fields to avoid simultaneously use [sic.] of both dry and wet analytical systems for the same analyte at the same site."
These suggested practices are both difficult and problematic. Remember these biases were determined on patient samples. This is REAL BIAS. So these differences are not just something that is showing up in the controls but not impacting patients. These biases are real and if clinicians are getting results from multiple instruments, those differences are present and will affect the interpretation of patient status.
Conclusion
The authors stated "Significant differences for several analytes between distinct analyzers were found, especially between dry chemical analyzer and conventional wet chemical analyzer, whose most relative predicted bias can reach 30% [actually more!], which is worthy of our concern. When one analyte was detected on more than one device, a strict method comparison study should be performed regularly."
Based on Sigma-metric analysis, we strongly agree with these conclusions. It looks like comparability is not achievable between the wet and the dry. In our era of "standardization and harmonization", this is a stark outlier. The only way to get standardized and harmonized, it appears, would be to get rid of one of the discrepant instruments. And again, for the metrology crowd that believes bias should not be allowed to exist, there is a major reality check here. Bias exists and exists significantly in this hospital and laboratory. In order to express MU for our tests, we need to eliminate bias - does this mean that the metrologists want to eliminate the dry chemistry analyzers from this laboratory, or even the entire field of laboratory medicine?