Sigma Metric Analysis
An Olympus AU 640 and AU 2700 in a Veterinary Reference Laboratory
At a recent veterinary laboratory conference, we had the chance to review some instrument evaluations. As it happens, these evaluations are based on QC and EQA data which applies to test performance relevant to human testing as well as veterinary testing.
Sigma-metric Analysis of an AU 640 and an AU 2700 in a Veterinary Reference Laboratory
Sten Westgard, MS
November 2017
- The Precision, Comparison and Sigma-metric data
- Summary of Performance according to CLIA Goals by Sigma-metrics Normalized Method Decision charts
- QC Implications of AU 5800 Performance by Normalized OPSpecs chart
- Conclusion
[Note: This QC application is an extension of the lesson From Method Validation to Six Sigma: Translating Method Performance Claims into Sigma Metrics. This article assumes that you have read that lesson first, and that you are also familiar with the concepts of QC Design, Method Validation, and Six Sigma metrics. If you aren't, follow the link provided.]
A few months ago I was privileged enough to attend the Veterinary Conference in London. And during this conference, I had the opportunity to review a number of papers where the performance of instruments was evaluated through Sigma-metric. One paper in particular was particularly interesting:
Alison J. Farr, Kathleen P. Freeman, Quailty control validation, application of sigma metrics, and performance comparison between two biochemistry analyzers in a commercial veterinary laboratory, J Vet Diagn Invest 20:536-544 (2008)
This study, while focused on the evaluation of two Olympus instruments for veterinary testing use, has data that is equally suitable for evaluating the use of these instruments on human testing. The study looked at the Olympus 640 and the Olympus 2700 at the IDEXX veterinary laboratory in West Yorkshire, England. While the study used customized veterinary allowable total analytical error specifications, we can just as easily use CLIA and Ricos desirable TEa's.
The Imprecision, Bias and Sigma-metric Data
"The CV was estimated by calculating the mean from 6 months of IQC data. The CV for the control material most closely approximating the level of clinical significance with the most stringent quality requirement was used...."
"The bias was determined by calculating the mean bias from EQA reports for 6 months for the control material most closely approximating the level of clinical significance with the most stringent quality requirement...."
In some cases, two levels of performance were recorded, while in others, only one level was recorded.
| AU 640 | TEa Source | TEa | % Bias | CV |
| Albumin | CLIA | 10 | 2.6 | 1.5 |
| Alk Phos | CLIA | 30 | 2.5 | 1.9 |
| ALT | CLIA | 20 | 2.0 | 1.7 |
| Amylase | CLIA | 30 | 6.5 | 1.3 |
| AST | CLIA | 20 | 1.1 | 1.7 |
| Bilirubin, Total | CLIA | 20 | 29.1 | 3.8 |
| Calcium | CLIA | 11.90 | 2.8 | 1.8 |
| Calcium | CLIA | 6.94 | 1.9 | 1.7 |
| Chloride | CLIA | 5 | 1.5 | 0.730 |
| Chloride | CLIA | 5 | 0.98 | 0.620 |
| Cholesterol, total | CLIA | 10 | 0.37 | 2.020 |
| Cholesterol, total | CLIA | 10 | 1.70 | 1.680 |
| Creatinine Kinase | CLIA | 30 | 4.65 | 1.250 |
| Creatinine | CLIA | 15.00 | 2.75 | 1.67 |
| Glucose | CLIA | 10 | 12.50 | 1.96 |
| Glucose | CLIA | 10 | 11.77 | 1.65 |
| GGT | Ricos | 22.11 | 4.2 | 1.5 |
| Lipase | Ricos | 29.10 | 6.4 | 3.5 |
| Ion Phosphorous | Ricos | 10.70 | 3.2 | 2.9 |
| Ion Phosphorous | Ricos | 10.70 | 1.8 | 1.9 |
| Sodium | CLIA | 2.96 | 1.0 | 0.7 |
| Sodium | CLIA | 2.58 | 1.2 | 0.7 |
| Protein, Total | CLIA | 10.00 | 2.2 | 1.6 |
| Protein, Total | CLIA | 10.00 | 0.4 | 1.4 |
| Urea | CLIA | 9.00 | 2.8 | 3.9 |
| Urea | CLIA | 9.00 | 2.1 | 3.7 |
Most of the same assays were recorded for the AU 2700 as well:
| AU 2700 | TEa Source | TEa | % Bias | CV |
| Albumin | CLIA | 10 | 3.65 | 1.82 |
| Alk Phos | CLIA | 30 | 0.13 | 2.42 |
| ALT | CLIA | 20 | 1.45 | 2.50 |
| Amylase | CLIA | 30 | 1.30 | 1.87 |
| AST | CLIA | 20 | 0.07 | 2.63 |
| Bilirubin, Total | CLIA | 20 | 24.62 | 3.05 |
| Calcium | CLIA | 11.90 | 1.80 | 1.87 |
| Calcium | CLIA | 6.94 | 2.10 | 1.63 |
| Chloride | CLIA | 5 | 0.42 | 0.93 |
| Chloride | CLIA | 5 | 0.52 | 0.80 |
| Cholesterol, total | CLIA | 10 | 1.40 | 2.63 |
| Cholesterol, total | CLIA | 10 | 0.65 | 2.00 |
| Creatinine Kinase | CLIA | 30 | 3.23 | 2.22 |
| Creatinine | CLIA | 15.00 | 0.65 | 2.45 |
| Glucose | CLIA | 10 | 9.72 | 1.93 |
| Glucose | CLIA | 10 | 3.82 | 1.83 |
| GGT | Ricos | 22.11 | 3.82 | 1.17 |
| Ion Phosphorous | Ricos | 10.70 | 5.57 | 6.80 |
| Ion Phosphorous | Ricos | 10.70 | 1.70 | 2.80 |
| Lipase | Ricos | 29.10 | 1.35 | 2.47 |
| Protein, Total | CLIA | 10.00 | 1.35 | 2.47 |
| Protein, Total | CLIA | 10.00 | 0.47 | 2.23 |
| Sodium | CLIA | 2.96 | 5.71 | 1.03 |
| Sodium | CLIA | 2.58 | 5.82 | 0.68 |
| Urea | CLIA | 9.00 | 3.27 | 3.23 |
| Urea | CLIA | 9.00 | 3.40 | 2.23 |
Yes, that is a whole lot of numbers!
Nevertheless, what do all these numbers mean? In the absence of context, it's hard to know.
So let's calculate the Sigma-metrics.
Sigma-metric calculations for AU 640 and AU 2700
Remember the equation for Sigma metric is (TEa - bias) / CV:
For a 10% quality requirement, for albumin on the AU 640, the equation is (10 -2.6) / 1.5 = 4.9
The metrics are displayed along the right columns.
| AU 640 | TEa Source | TEa% | % Bias | CV% | Sigma |
| Albumin | CLIA | 10 | 2.6 | 1.5 | 4.9 |
| Alk Phos | CLIA | 30 | 2.5 | 1.9 | 14.9 |
| ALT | CLIA | 20 | 2.0 | 1.7 | 10.6 |
| Amylase | CLIA | 30 | 6.5 | 1.3 | 18.3 |
| AST | CLIA | 20 | 1.1 | 1.7 | 11.14 |
| Bilirubin, Total | CLIA | 20 | 29.1 | 3.8 | negative |
| Calcium | CLIA | 11.90 | 2.8 | 1.8 | 5.14 |
| Calcium | CLIA | 6.94 | 1.9 | 1.7 | 3.08 |
| Chloride | CLIA | 5 | 1.5 | 0.730 | 4.8 |
| Chloride | CLIA | 5 | 0.98 | 0.620 | 6.5 |
| Cholesterol, total | CLIA | 10 | 0.37 | 2.020 | 4.8 |
| Cholesterol, total | CLIA | 10 | 1.70 | 1.680 | 4.9 |
| Creatinine Kinase | CLIA | 30 | 4.65 | 1.250 | 20.3 |
| Creatinine | CLIA | 15.00 | 2.75 | 1.67 | 7.3 |
| Glucose | CLIA | 10 | 12.50 | 1.96 | negative |
| Glucose | CLIA | 10 | 11.77 | 1.65 | negative |
| GGT | Ricos | 22.11 | 4.2 | 1.5 | 11.71 |
| Lipase | Ricos | 29.10 | 6.4 | 3.5 | 6.59 |
| Ion Phosphorous | Ricos | 10.70 | 3.2 | 2.9 | 2.58 |
| Ion Phosphorous | Ricos | 10.70 | 1.8 | 1.9 | 4.67 |
| Sodium | CLIA | 2.96 | 1.0 | 0.7 | 2.80 |
| Sodium | CLIA | 2.58 | 1.2 | 0.7 | 2.09 |
| Protein, Total | CLIA | 10.00 | 2.2 | 1.6 | 4.8 |
| Protein, Total | CLIA | 10.00 | 0.4 | 1.4 | 7.1 |
| Urea | CLIA | 9.00 | 2.8 | 3.9 | 1.6 |
| Urea | CLIA | 9.00 | 2.1 | 3.7 | 1.9 |
The negative Sigma-metrics simply indicate that the bias has completely exceeded the allowable total error (the method cannot hit the target that's been designated).
[In the instance of Sodium and Calcium the original paper did not include the Sigma-metric calculations, we speculate because of the challenge of converting unit-based allowable total errors into a % allowable total error. Using the reference ranges published in the paper, however, it is possible to make those TEa calculations and use them to determine Sigma-metrics.]
| AU 2700 | TEa Source | TEa | % Bias | CV | Sigma |
| Albumin | CLIA | 10 | 3.65 | 1.82 | 3.5 |
| Alk Phos | CLIA | 30 | 0.13 | 2.42 | 12.3 |
| ALT | CLIA | 20 | 1.45 | 2.50 | 7.4 |
| Amylase | CLIA | 30 | 1.30 | 1.87 | 15.3 |
| AST | CLIA | 20 | 0.07 | 2.63 | 7.58 |
| Bilirubin, Total | CLIA | 20 | 24.62 | 3.05 | negative |
| Calcium | CLIA | 11.90 | 1.80 | 1.87 | 5.40 |
| Calcium | CLIA | 6.94 | 2.10 | 1.63 | 2.97 |
| Chloride | CLIA | 5 | 0.42 | 0.93 | 4.9 |
| Chloride | CLIA | 5 | 0.52 | 0.80 | 5.6 |
| Cholesterol, total | CLIA | 10 | 1.40 | 2.63 | 3.3 |
| Cholesterol, total | CLIA | 10 | 0.65 | 2.00 | 4.7 |
| Creatinine Kinase | CLIA | 30 | 3.23 | 2.22 | 12.1 |
| Creatinine | CLIA | 15.00 | 0.65 | 2.45 | 5.9 |
| Glucose | CLIA | 10 | 9.72 | 1.93 | 0.1 |
| Glucose | CLIA | 10 | 3.82 | 1.83 | 3.4 |
| GGT | Ricos | 22.11 | 3.82 | 1.17 | 15.63 |
| Ion Phosphorous | Ricos | 10.70 | 5.57 | 6.80 | 0.75 |
| Ion Phosphorous | Ricos | 10.70 | 1.70 | 2.80 | 3.21 |
| Lipase | Ricos | 29.10 | 1.35 | 2.47 | 11.2 |
| Protein, Total | CLIA | 10.00 | 1.35 | 2.47 | 3.5 |
| Protein, Total | CLIA | 10.00 | 0.47 | 2.23 | 4.3 |
| Sodium | CLIA | 2.96 | 5.71 | 1.03 | negative |
| Sodium | CLIA | 2.58 | 5.82 | 0.68 | negative |
| Urea | CLIA | 9.00 | 3.27 | 3.23 | 1.8 |
| Urea | CLIA | 9.00 | 3.40 | 2.23 | 2.5 |
In this case, note that the total bilirubin is a negative Sigma-metric on both the AU 640 and AU 5800. But the AU 2700 has negative Sigma-metrics for sodium, not glucose (that was the AU 640). And to the list of assays with at least one level below 3 Sigma, we now add calcium, glucose, phosphorous, and urea. There are almost as many assays levels below 2 Sigma as there are assays above 6 Sigma.
Summary of Performance by Sigma-metrics Method Decision Chart using CLIA Goals
We can make visual assessments of this performance using a Normalized Sigma-metric Method Decision Chart:
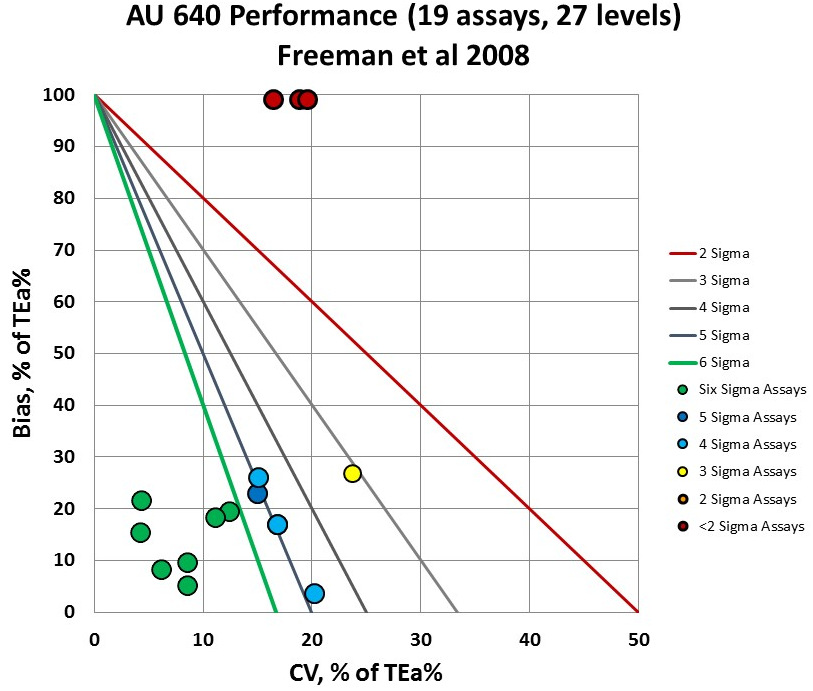
The glucose points and the one level of total bilirubin are tucked on the top of the graph, but they are actually "off the chart" due to the bias exceeding the allowable total error.
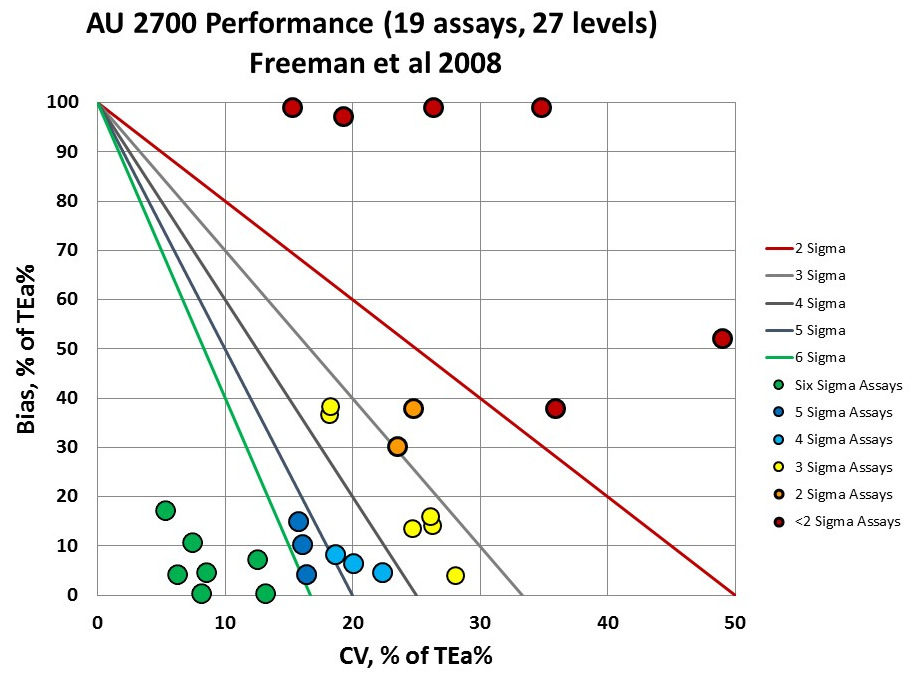
We can really see the variation in the quality of the different instruments, different levels and different assays now.
You can see the 6 levels of performance are below 2 Sigma, while you have 7 levels in the bull's-eye of the graph, at 6 Sigma or better performance. It's good news - bad news. The majority of the performance is 3 Sigma and lower.
Summary of QC Design by Normalized OPSpecs chart - using (mostly) CLIA Goals
The benefit of the Sigma-metric approach is that labs can do more than assess their quality, they can act on it. Using OPSpecs charts, they can actually optimize their QC procedures for each test.
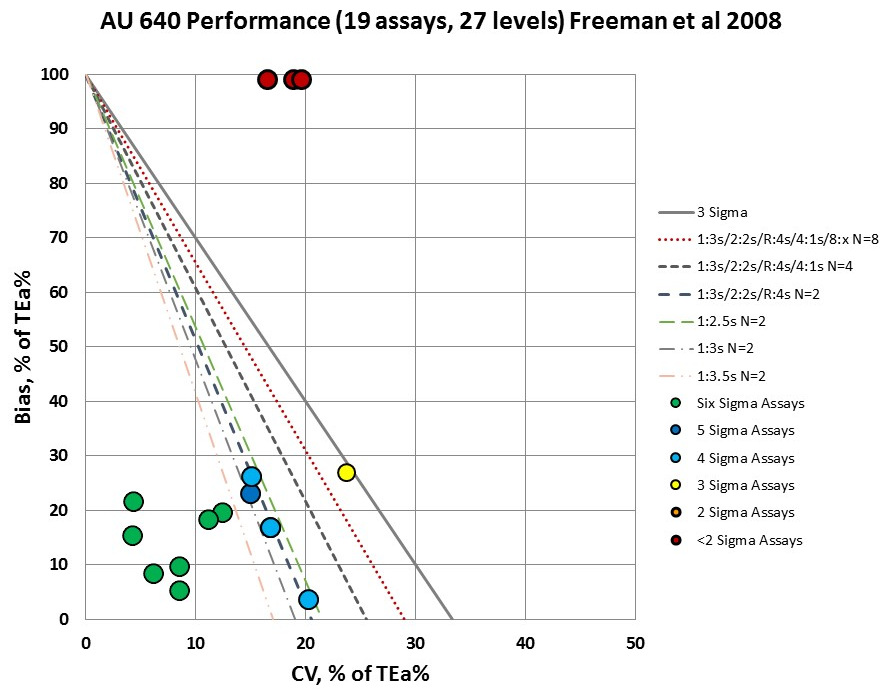
For the AU 640, there assay levels that are "off the charts" will require full "Westgard Rules" and at least 8 control measurements per run. In practical terms, you just can run enough controls or use enough rules to properly monitor those levels of performance. No amount of "Westgard Rules" and controls will suffice to fix the situation.
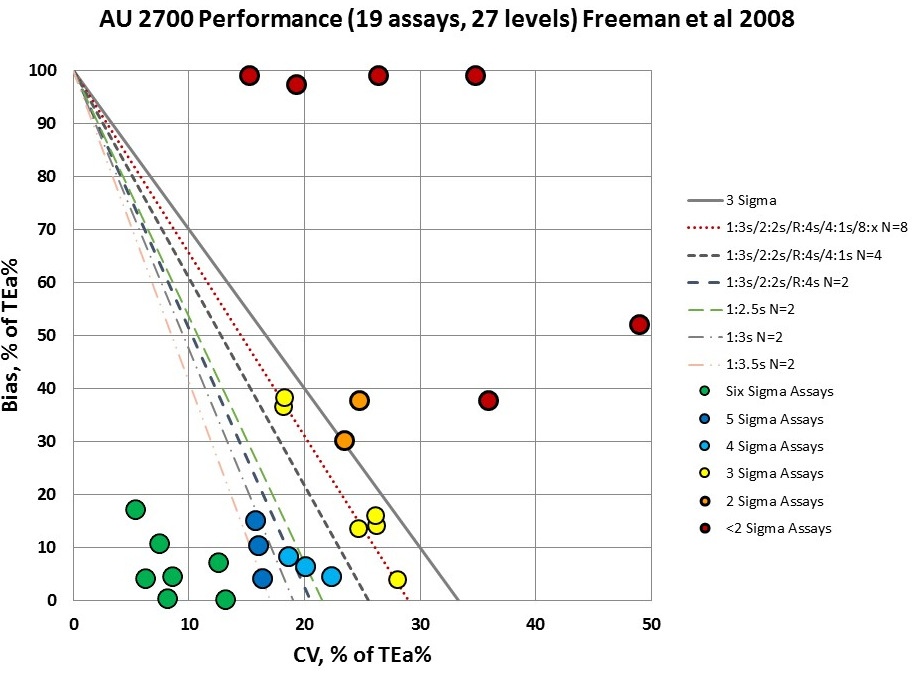
There are many QC rules that need to be implemented on this AU 2700 instrument, from just wide 3s limits and 2 controls, to the full "Westgard Rules" and at least 8 controls. The AU 2700 will need to keep an eye on a majority of the levels and analytes recorded in the study. So while a good number of assays are easy to to control, all the efficiencies gained there will be spent (and then some) on trying to work with the problem assays.
Conclusion
The authors stated "When an analyte is identified as being poorly controlled, the following mitigating steps may be taken.
"1. Limit the assay to the machine on which the statistical control is easier: This option is impractical in the authors' laboratory.
"2. Repeat low phosphorous results from teh AU2700 on the AU640 machine: This option is also not practial in the authors' laboratory based on a need for rapid turnaround times for biochemistry assays and high volume batch analyses.
"3. Consider the limitations of the assay when providing an interpretation for the result: This option is the most practical for the authors' laboratory. This option and the need for vigilance in interpretation would not hae been identified had the study of analyzer performance not been undertaken....
"The findings in the current study helped to illustrate a need for separate QC validation on every instrument; a need for QC that is specific for the analyte and the clinical decision level, and variation in performance of individual instruments despite uniformity of manufacturer, reagents, preventative maintenance, and age of the instrument."
These conclusions demonstrate the practical challenges of managing instruments with less than world class quality. Even when some assays are 6 Sigma, the assays that are below 3 Sigma will dominate how the instrument must be maintained and monitored.
The study had much rosier conclusions than we would have based on human TEa's. The veterinary allowable total errors are usually larger than those imposed by CLIA, Ricos, etc. So in the original study, more analytes were marked with higher Sigma-metrics. These instruments were deemed mostly fit for purpose for canines, felines, and the like. But when we hold them to the tougher standards for human testing, there are more assays that fall short.