Sigma Metric Analysis
Sigma-metrics of the KeyLab veterinary analyzer
What happens when you measure quality of a small wet chemistry veterinary analyzer using not only QC, but also pooled samples of canines and felines? Is this analyzer safe for any species?
Sigma-metric Analysis of KeyLab Veterinary chemistry analyzer
Sten Westgard, MS
December 2017
- The Precision, Comparison and Sigma-metric data
- Summary of Performance according to CLIA Goals by Sigma-metrics Normalized Method Decision charts
- Conclusion
[Note: This QC application is an extension of the lesson From Method Validation to Six Sigma: Translating Method Performance Claims into Sigma Metrics. This article assumes that you have read that lesson first, and that you are also familiar with the concepts of QC Design, Method Validation, and Six Sigma metrics. If you aren't, follow the link provided.]
In a previous Sigma-metric analysis, we leveraged a veterinary study to draw some conclusions about an instrument's fitness for purpose for humans. In this analysis, we're going to take a veterinary chemistry analyzer and focus solely on its use in animals, specifically canines and felines.
Katherine L. Irvine, Kay Burt, Kostas Papasouliotis, Evaluation of an in-practice wet-chemistry analyzer using canine and feline serum samples J Vet Diagn Invest 2016 28(1):38-45.
This study looks at a small analyzer that would be used within a clinic setting. In addition to running the usual controls to establish precision, the study authors also create pooled serum samples from canines and felines, allowing for additional species-specific evaluations:
"Blood samples from 66 dogs and 59 cats submitted to the Diagnostic Laboratories (University of Bristol, Langford, Bristol,UK) between March 2013 and March 2014 were included in the study.... Excess serum from clinical samples following analysis was frozen at -20C for up to 1 year and used in the study with owners' consent.... Pooled serum samples were also created for both species using excess serum from stored clinical samples. For simplicity, a single pooled sample from each species was used rather than multiple samples with different concentrations for all of the different analytes. Canine and feline pooled samples were created by mixing several samples containing within- or near-reference concentrations for all analytes in this study, as determined by the reference chemistry analyzer."
The Imprecision, Bias and Sigma-metric Data
"Two human-derived QCM (Eurocontrol N and Eurocontrol P) were run daily on the in-practice analyzer....The imprecision of the in-practice analyzer was assessed by within- and between-run repeatability using the QCM...and the canine and feline serum pools. Within-run repeatability was determined by measuring each analyte in the same sample 10 times sequentially within the same assay run. Between-run repeatability using the serum pools was determined by measuring each analyte in the same pool each day for 5 consecutive days. Between-run repeatblity using the QCM was determined from the daily control values generated over a 2-month period (10 measurements)."
"The bias was determined by calculating the mean bias from EQA reports for 6 months for the control material most closely approximating the level of clinical significance with the most stringent quality requirement...."
So for the QC materials, we have two levels measured for each analyte. Notice the column for TEa lists the specific goals for veterinary use. These are different than the usual CLIA, RCPA, or "Ricos Goals".
| Test | ASVCP TEa | Bias | CV |
| Albumin | 15 | 2 | 2.16 |
| Albumin | 15 | 9.5 | 1.17 |
| Alk Phos | 25 | 4 | 2.19 |
| Alk Phos | 25 | 1.4 | 1.55 |
| ALT | 20 | 7.3 | 2.68 |
| ALT | 20 | 2.5 | 1.9 |
| Total Bilirubin | 30 | 17.5 | 4.51 |
| Total Bilirubin | 30 | 11.2 | 1.3 |
| Calcium | 10 | 2.6 | 1.96 |
| Calcium | 10 | 9.2 | 1.07 |
| Cholestrol-Total | 20 | 0.8 | 1.41 |
| Cholestrol-Total | 20 | 0.6 | 2.17 |
| Creatinine | 20 | 6 | 5.68 |
| Creatinine | 20 | 3.9 | 4.2 |
| GGT | 22.1 | 2.7 | 1.29 |
| GGT | 22.1 | 7.9 | 1.79 |
| Glucose | 10 | 4.3 | 2.23 |
| Glucose | 10 | 5.1 | 2.31 |
| Phosphorus | 15 | 27.3 | 13.72 |
| Phosphorus | 15 | 14.4 | 7.21 |
| Total Protein | 10 | 2.9 | 0.54 |
| Total Protein | 10 | 4.2 | 2.7 |
| Urea | 12 | 1.8 | 5.15 |
| Urea | 12 | 10.3 | 1.58 |
And here are the canine serum pool numbers:
| ASCVP | ASCVP TEa | Bias% | CV% |
| Albumin | 15 | 25 | 2.16 |
| Alk Phos | 25 | 108.7 | 1.81 |
| ALT | 20 | 1.9 | 11.71 |
| Total Bilirubin | 30 | 177.78 | 4.51 |
| Calcium | 10 | 6.79 | 4.76 |
| Cholestrol-Total | 20 | 3.55 | 0.24 |
| Creatinine | 20 | 23.1 | 2.33 |
| GGT | 22.1 | 0 | 5.08 |
| Glucose | 10 | 2.2 | 1.66 |
| Phosphorus | 15 | 11.8 | 5.39 |
| Total Protein | 10 | 8.43 | 1.88 |
| Urea | 12 | 13.56 | 3.88 |
Finally, here are the feline serum pool metrics:
| TEST | ASCVP TEa | % Bias | CV |
| Albumin | 15 | 22.99 | 2.46 |
| Alk Phos | 25 | 157.14 | 5.22 |
| ALT | 20 | 42.62 | 4.98 |
| Total Bilirubin | 30 | 129.55 | 7.28 |
| Calcium | 10 | 6.79 | 10.61 |
| Cholestrol-Total | 20 | 4.25 | 1.74 |
| Creatinine | 20 | 13.11 | 1.58 |
| Glucose | 10 | 0.93 | 2.12 |
| Phosphorus | 15 | 17.72 | 4.09 |
| Total Protein | 10 | 6.27 | 2.97 |
| Urea | 12 | 8.93 | 1.96 |
Wow, that's a huge amount of numbers. What do they all mean? In the absence of context, it's hard to know.
So let's calculate the Sigma-metrics.
Sigma-metric calculations for the KeyLab Vet Analyzer
Remember the equation for the Sigma metric is (TEa - bias) / CV:
For a 15% quality requirement for albumin on the KeyLab, the equation is (15 -2) / 2.16 = 6.02
The metrics are displayed along the right column.
| Assay | ASVCP TEa | Bias | CV | Sigma |
| Albumin | 15 | 2 | 2.16 | 6.02 |
| Albumin | 15 | 9.5 | 1.17 | 4.70 |
| Alk Phos | 25 | 4 | 2.19 | 9.59 |
| Alk Phos | 25 | 1.4 | 1.55 | 15.23 |
| ALT | 20 | 7.3 | 2.68 | 4.74 |
| ALT | 20 | 2.5 | 1.9 | 9.21 |
| Total Bilirubin | 30 | 17.5 | 4.51 | 2.77 |
| Total Bilirubin | 30 | 11.2 | 1.3 | 14.46 |
| Calcium | 10 | 2.6 | 1.96 | 3.78 |
| Calcium | 10 | 9.2 | 1.07 | 0.75 |
| Cholestrol-Total | 20 | 0.8 | 1.41 | 13.62 |
| Cholestrol-Total | 20 | 0.6 | 2.17 | 8.94 |
| Creatinine | 20 | 6 | 5.68 | 2.46 |
| Creatinine | 20 | 3.9 | 4.2 | 3.83 |
| GGT | 22.1 | 2.7 | 1.29 | 15.04 |
| GGT | 22.1 | 7.9 | 1.79 | 7.93 |
| Glucose | 10 | 4.3 | 2.23 | 2.56 |
| Glucose | 10 | 5.1 | 2.31 | 2.12 |
| Phosphorus | 15 | 27.3 | 13.72 | negative |
| Phosphorus | 15 | 14.4 | 7.21 | 0.08 |
| Total Protein | 10 | 2.9 | 0.54 | 13.15 |
| Total Protein | 10 | 4.2 | 2.7 | 2.15 |
| Urea | 12 | 1.8 | 5.15 | 1.98 |
| Urea | 12 | 10.3 | 1.58 | 1.08 |
This is a mixed bag of performance. Some very high Sigma-metrics for some assays, whereas very low Sigma-metrics for others. A few cases where the bias exceeds the allowable total error.
Remember this study did not one, but two, very unique things. They built serum pools for both canines and felines.
So we have two more sets of Sigma-metrics. Here are the Sigma-metrics for canines:
| ASCVP | ASCVP TEa | Bias% | CV% | Sigma-metric |
| Albumin | 15 | 25 | 2.16 | negative |
| Alk Phos | 25 | 108.7 | 1.81 | negative |
| ALT | 20 | 1.9 | 11.71 | 1.55 |
| Total Bilirubin | 30 | 177.78 | 4.51 | negative |
| Calcium | 10 | 6.79 | 4.76 | 0.67 |
| Cholestrol-Total | 20 | 3.55 | 0.24 | 68.53 |
| Creatinine | 20 | 23.1 | 2.33 | negative |
| GGT | 22.1 | 0 | 5.08 | 4.3 |
| Glucose | 10 | 2.2 | 1.66 | 4.70 |
| Phosphorus | 15 | 11.8 | 5.39 | 0.59 |
| Total Protein | 10 | 8.43 | 1.88 | 0.83 |
| Urea | 12 | 13.56 | 3.88 | negative |
You can see very quickly that there are significant biases between the canine samples measured on the KeyLab and the core laboratory. There's also an extremely low CV for cholesterol that produces an extremely high Sigma-metric, but that metric seems a little suspicious (maybe a typo, recording error, or outright fluke?).
Finally, here are the feline Sigma-metrics.
| TEST | ASCVP TEa | % Bias | CV | Sigma |
| Albumin | 15 | 22.99 | 2.46 | negative |
| Alk Phos | 25 | 157.14 | 5.22 | negative |
| ALT | 20 | 42.62 | 4.98 | negative |
| Total Bilirubin | 30 | 129.55 | 7.28 | negative |
| Calcium | 10 | 6.79 | 10.61 | 0.30 |
| Cholestrol-Total | 20 | 4.25 | 1.74 | 9.05 |
| Creatinine | 20 | 13.11 | 1.58 | 4.36 |
| Glucose | 10 | 0.93 | 2.12 | 4.28 |
| Phosphorus | 15 | 17.72 | 4.09 | negative |
| Total Protein | 10 | 6.27 | 2.97 | 1.26 |
| Urea | 12 | 8.93 | 1.96 | 1.57 |
There are even more analytes here with negative Sigma-metrics.
Summary of Performance by Sigma-metrics Method Decision Chart using ASVCP Goals
We can make visual assessments of this performance using a Normalized Sigma-metric Method Decision Chart:
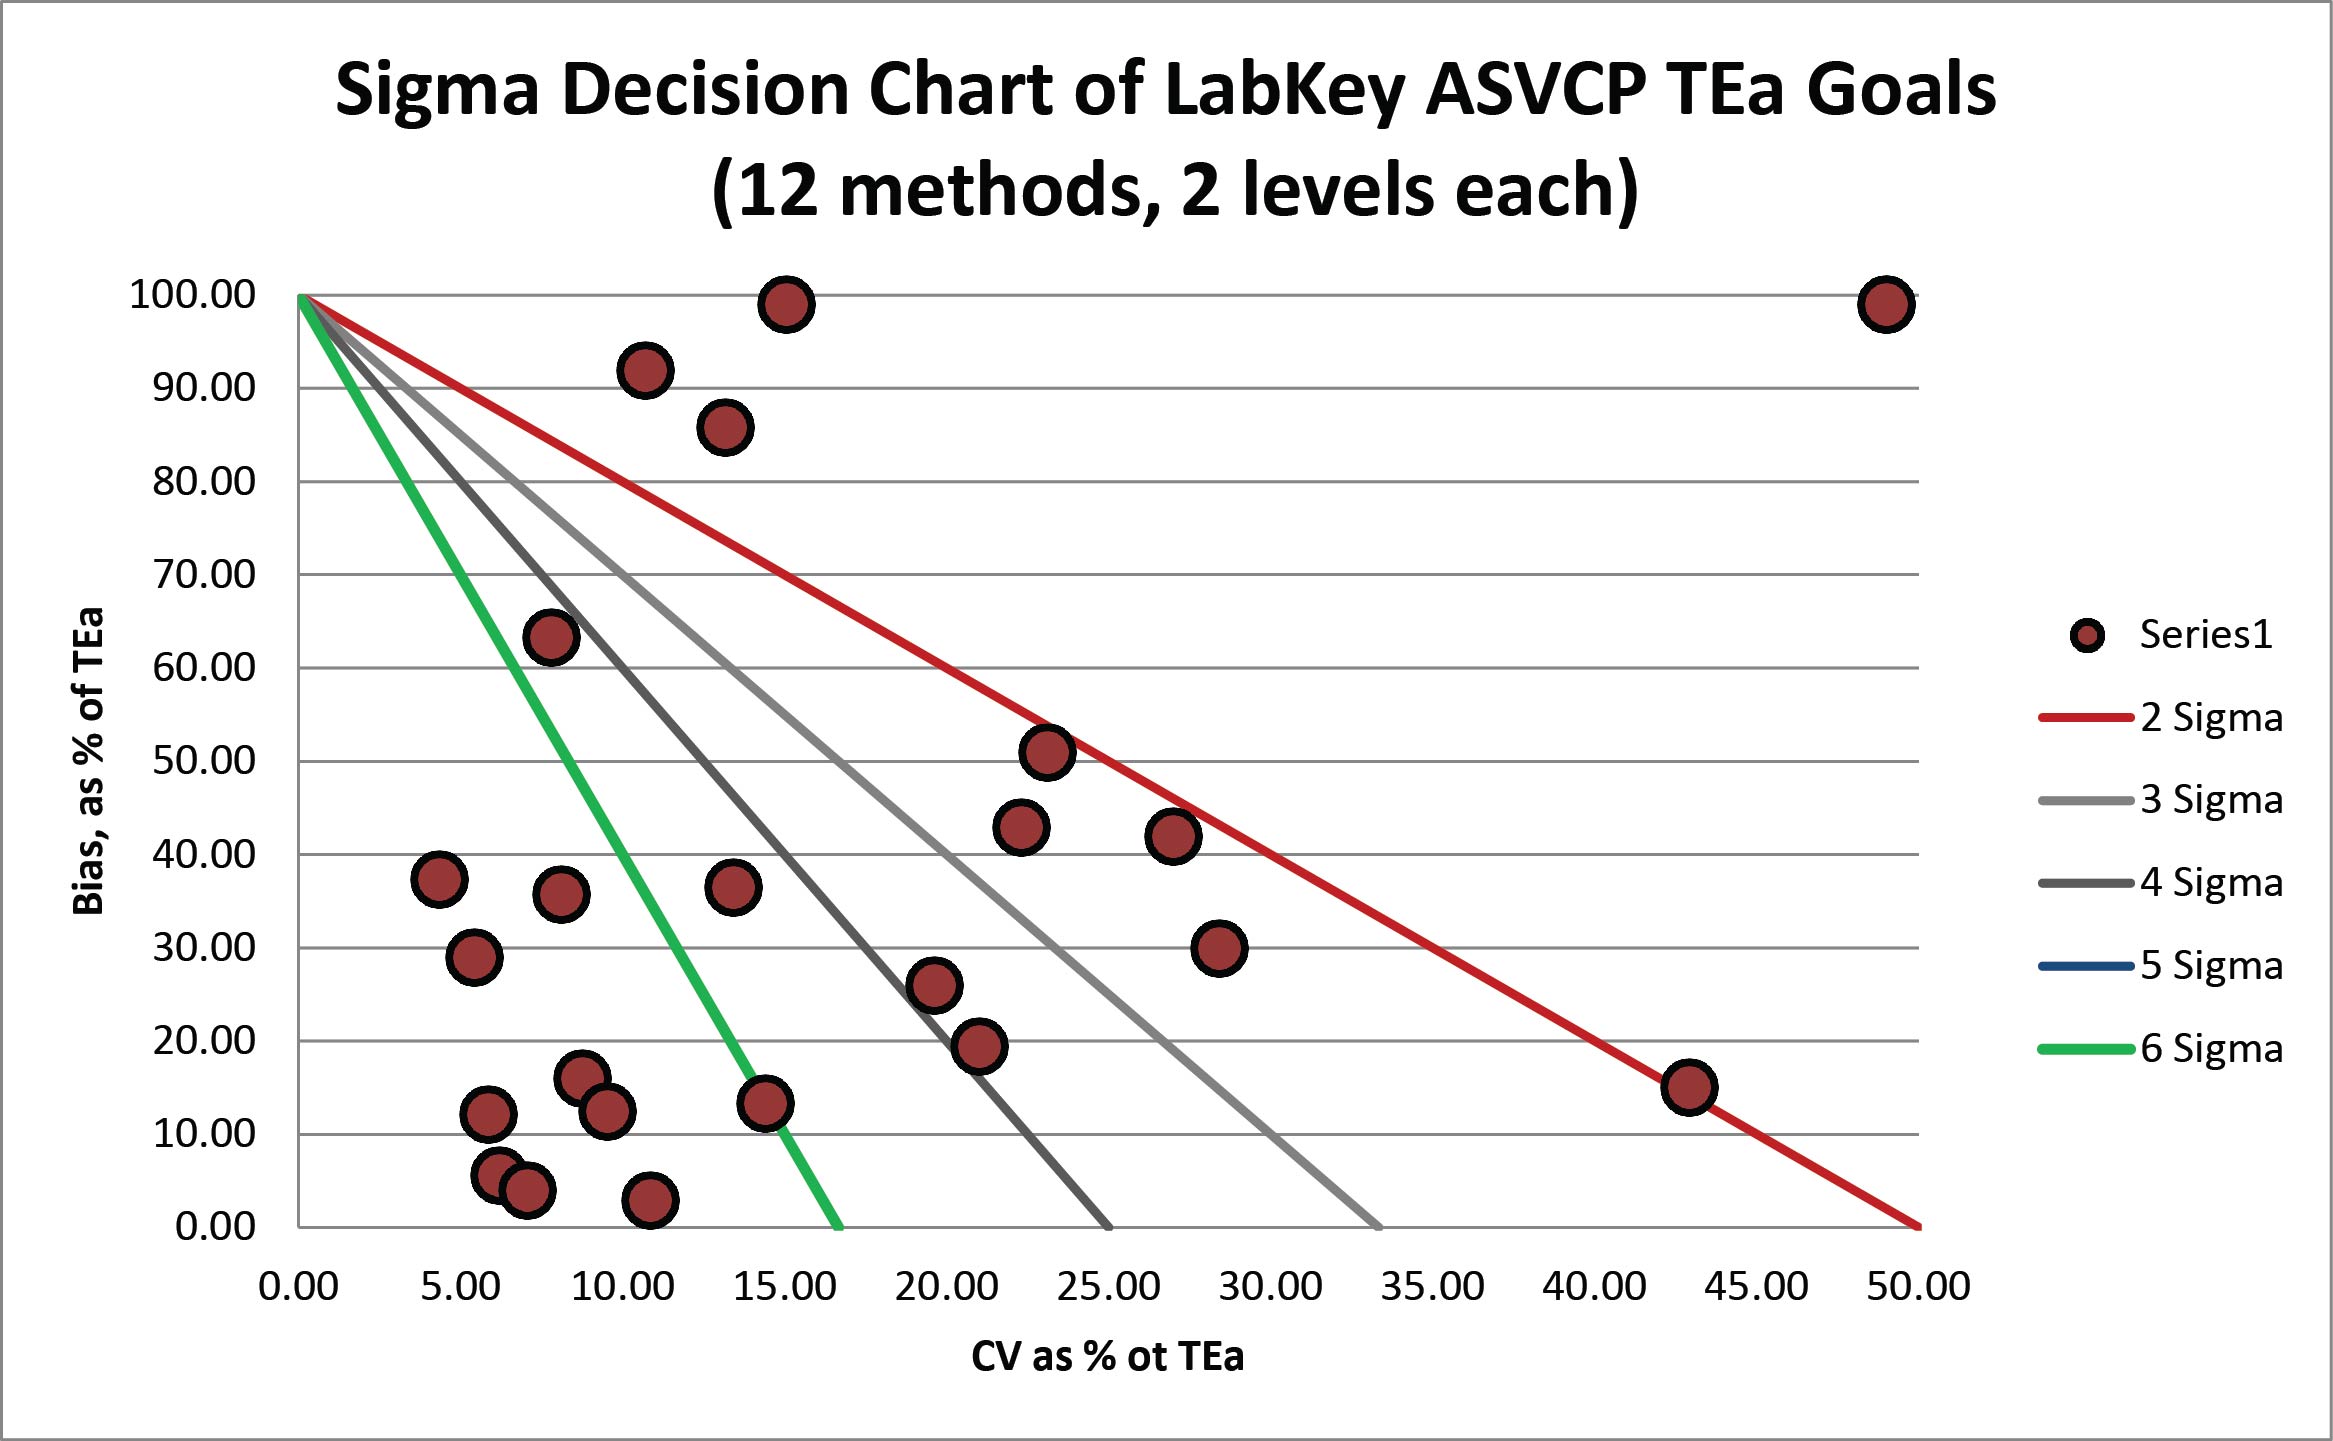
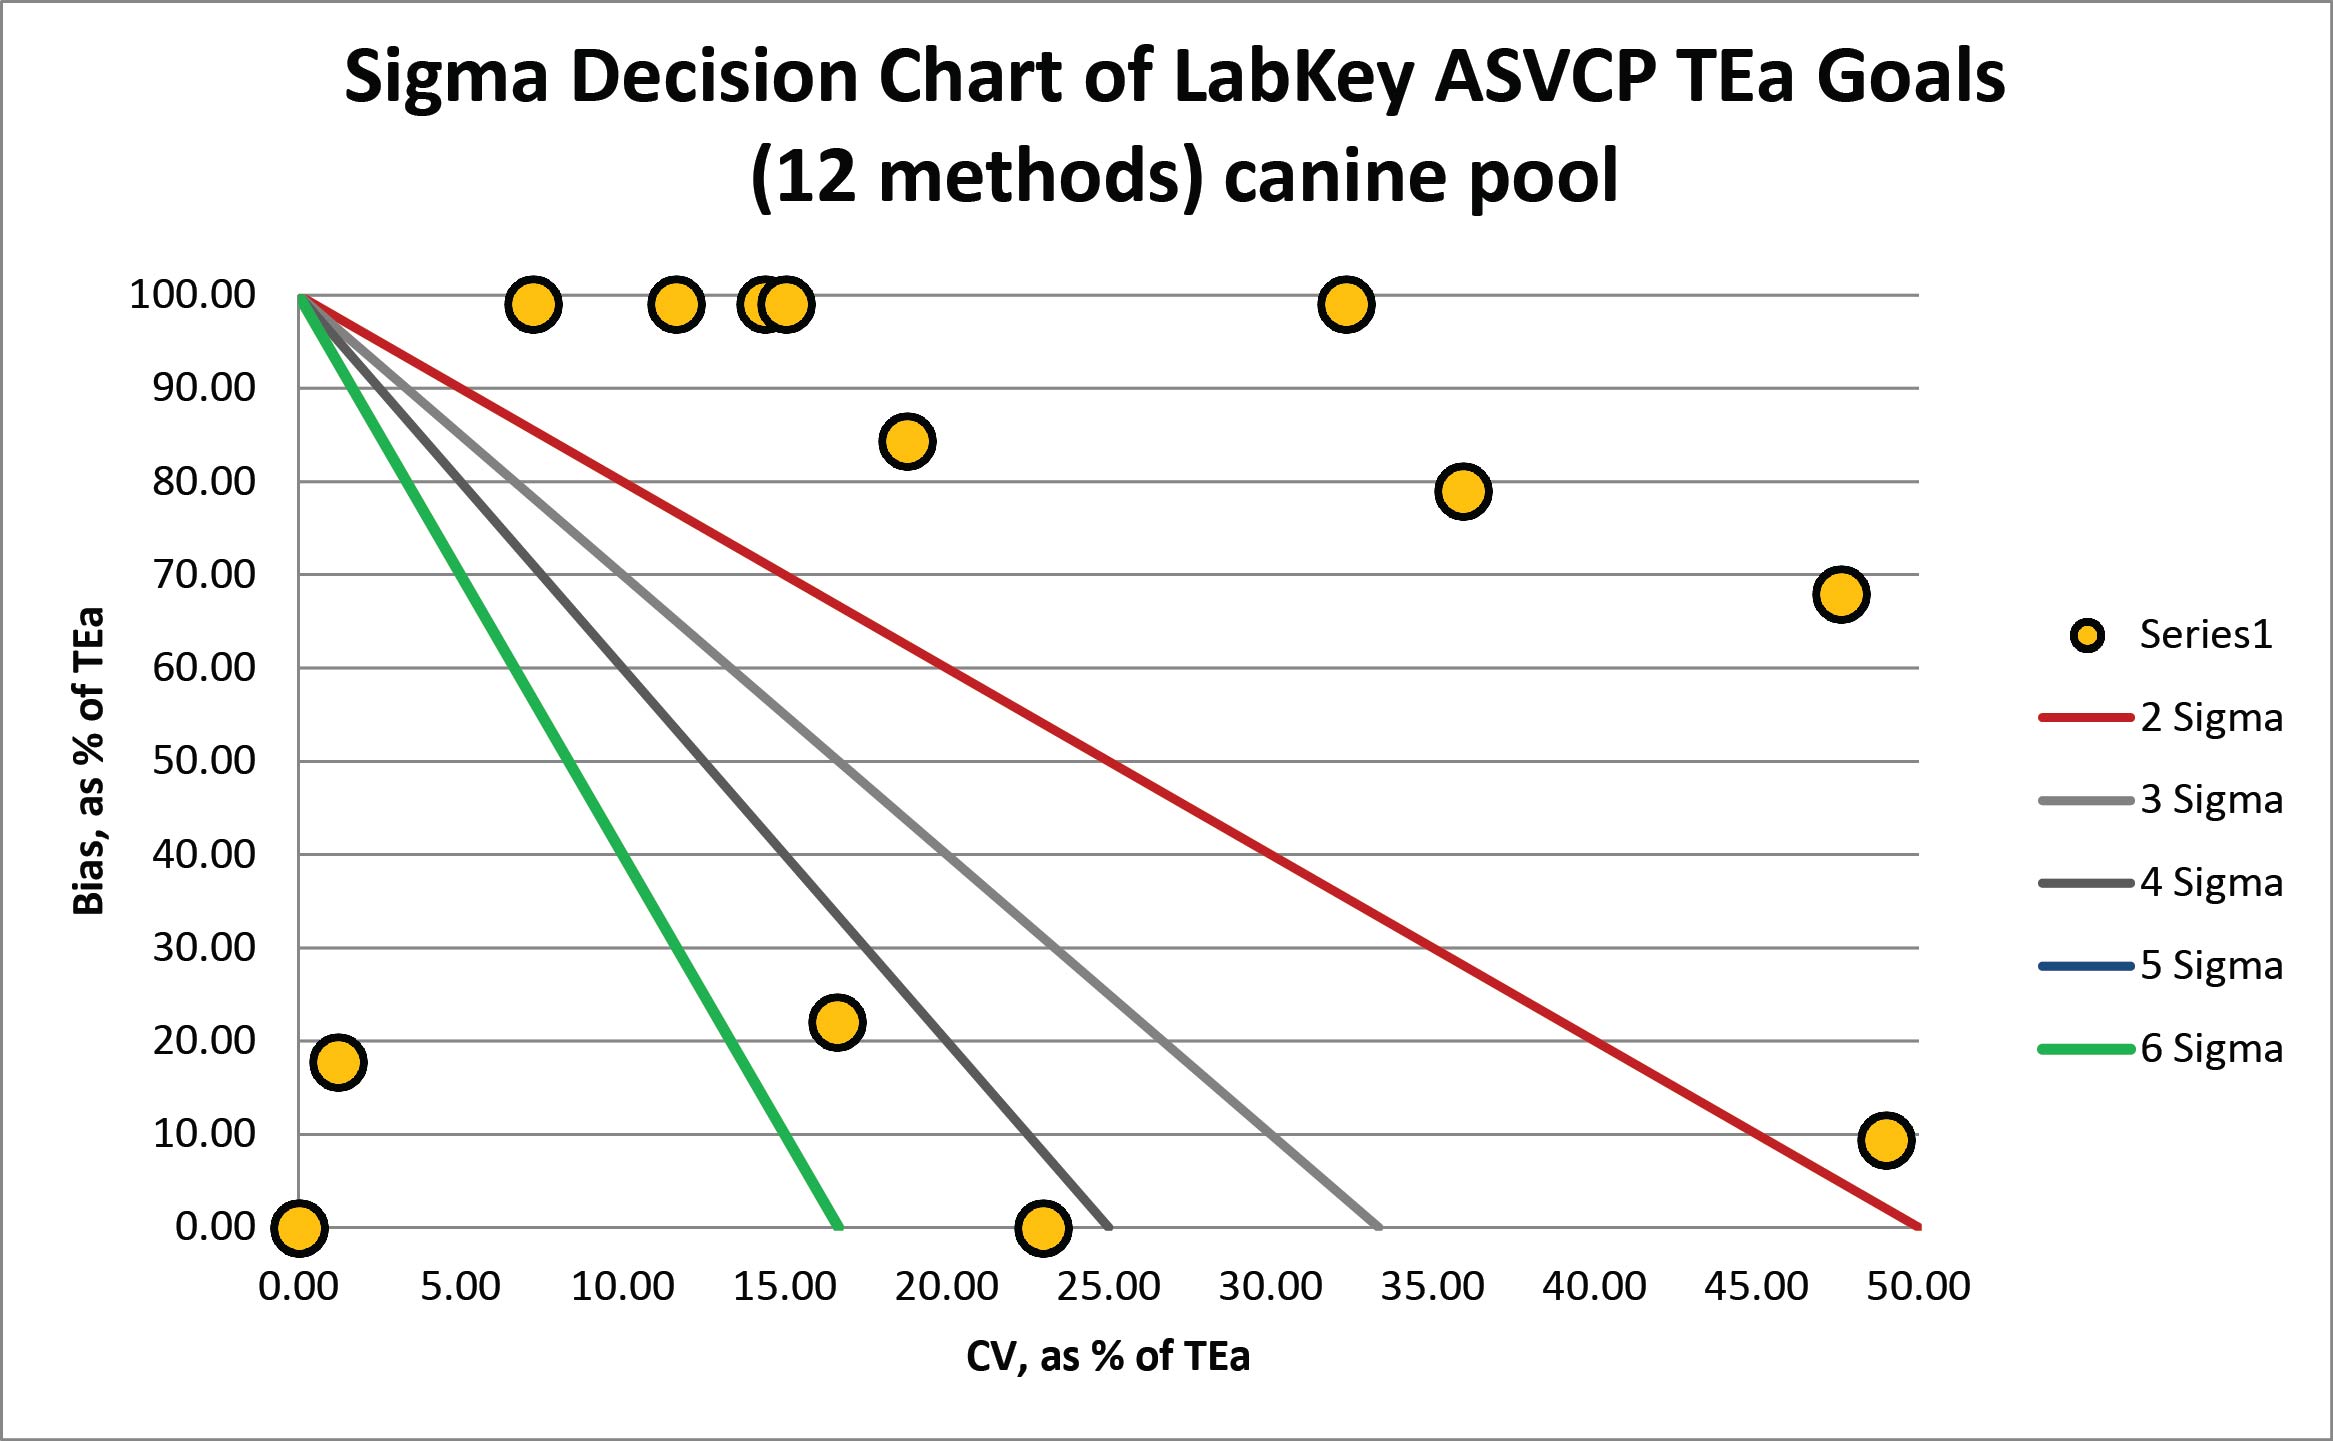
There are four levels here that have completely missed the target, with less than 2 Sigma performance. This would be considered bad, but when we look at the canine pool, the story gets considerably worse.
And here is the feline chart:
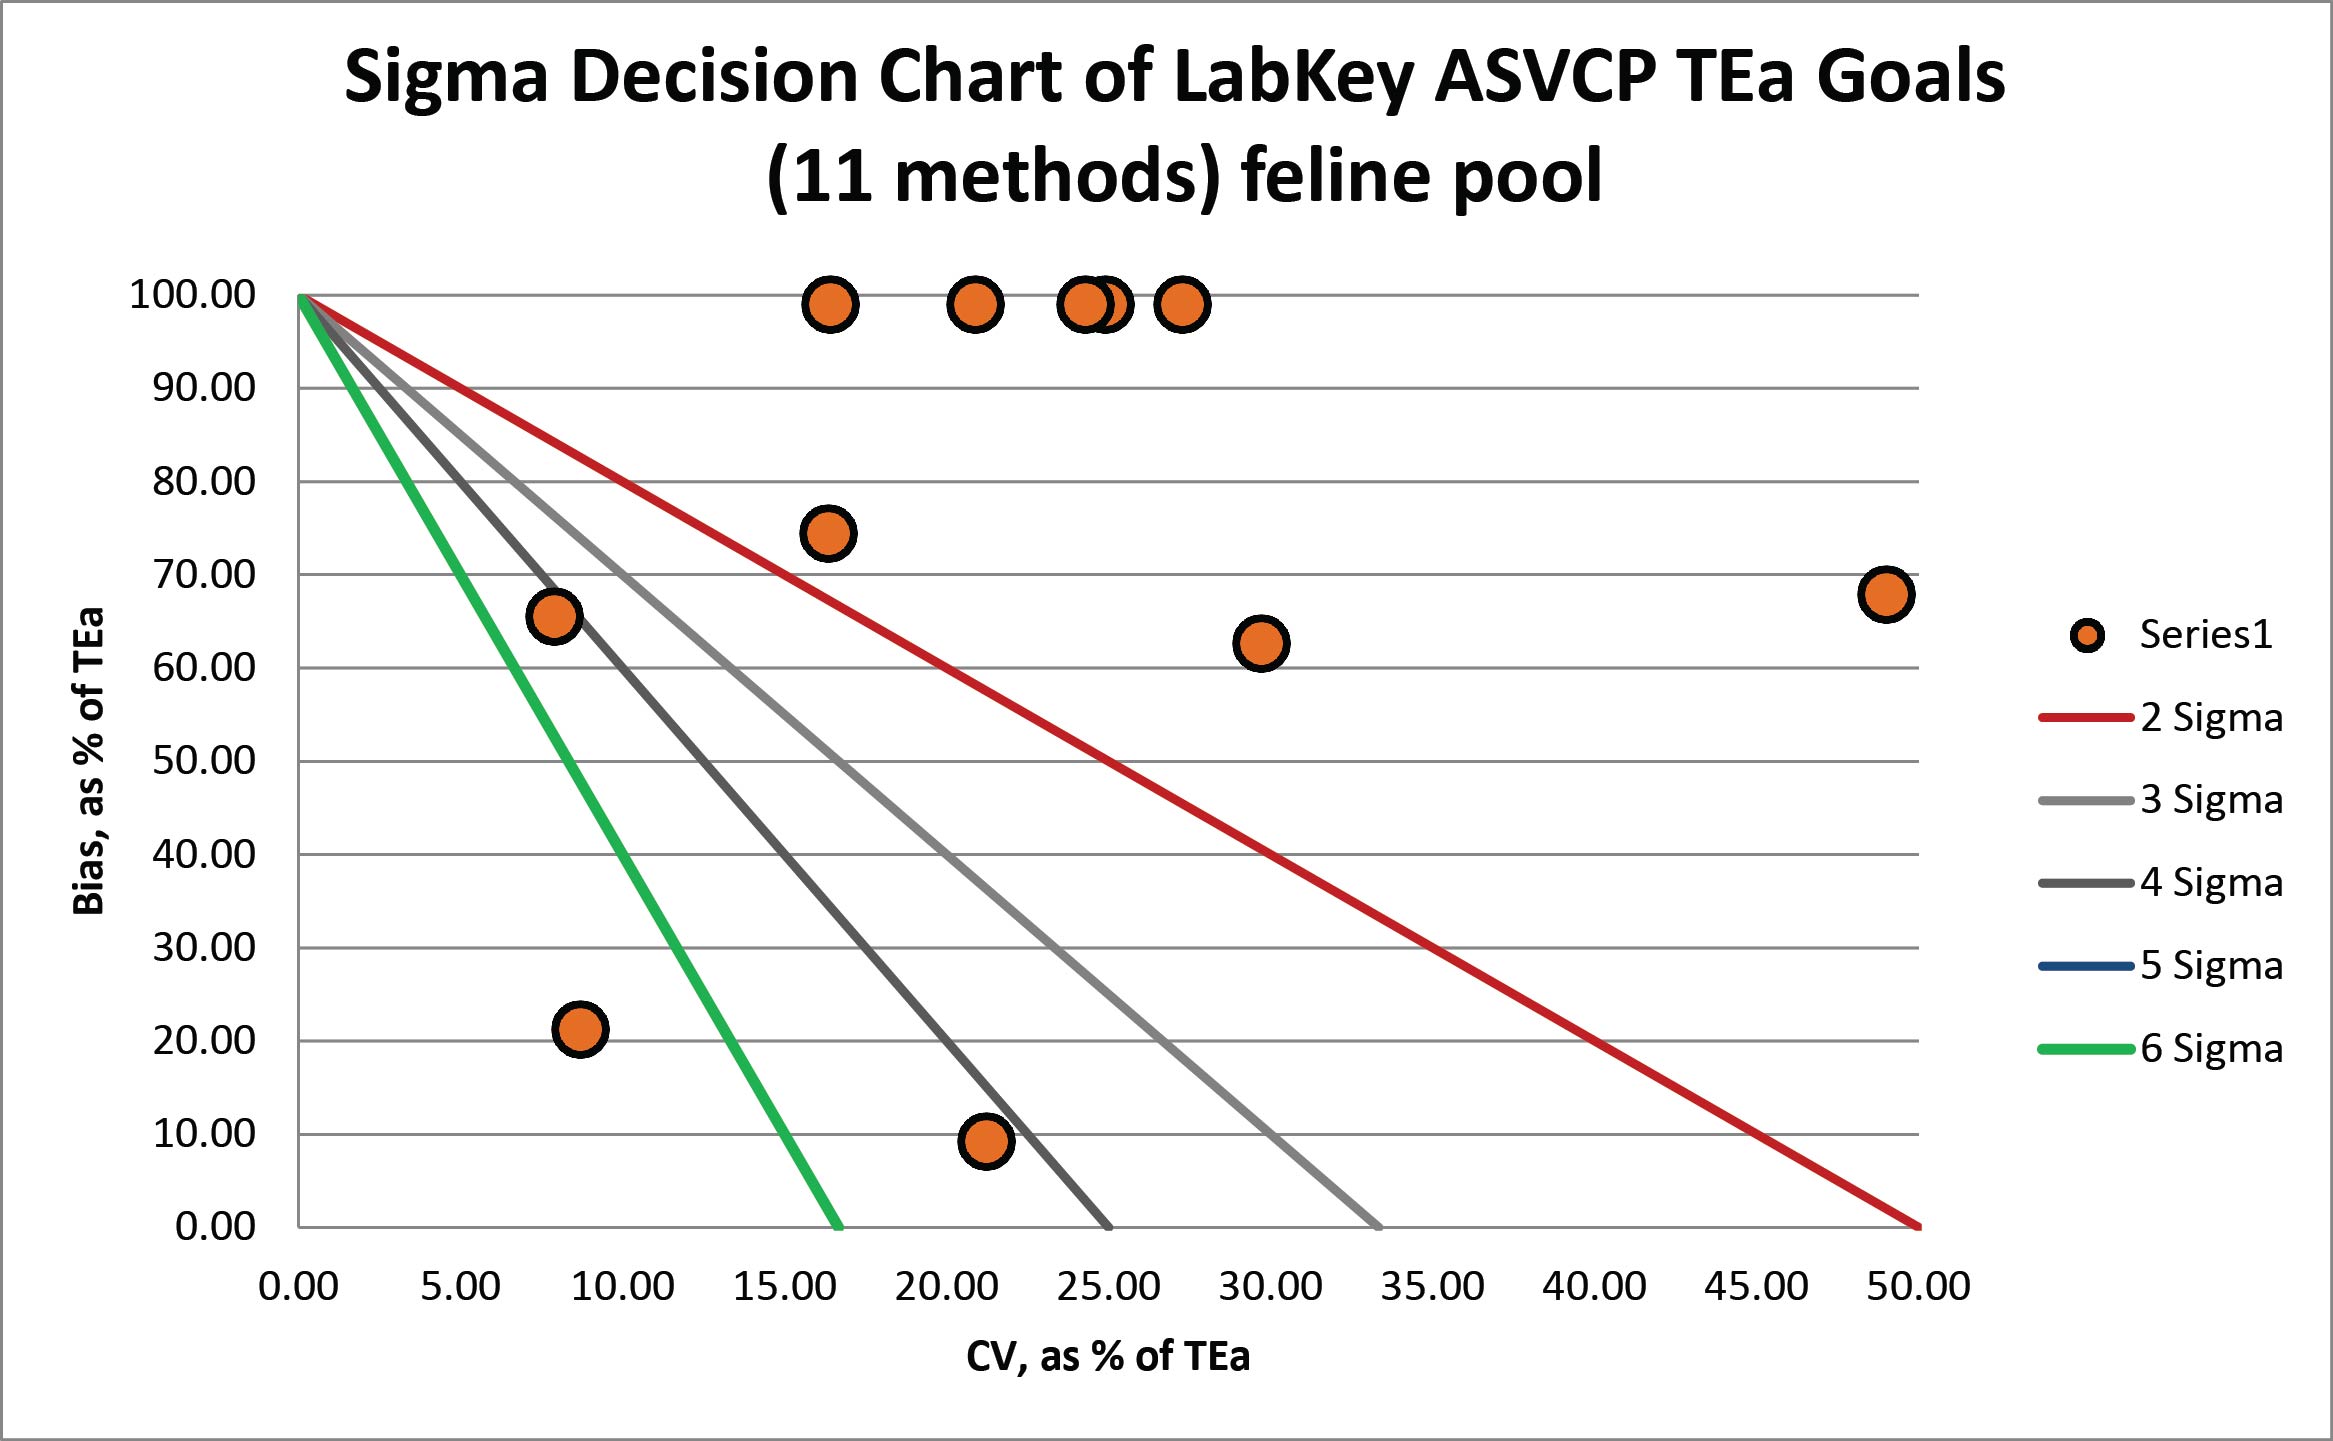
The feline pool has more tests missing the target than hitting it. Traditionally, we operate under the assumption that our control materials are essentially the same as patient samples. But here we see the opposite. It looks like the QC materials have a difference verdict on the fitness of this instrument than what the feline and canine pools are indicating. It appears that the patient pools are finding that there are significant biases between this instrument and its peer instruments.
Normally at this stage, we would try to estimate what level of QC effort would be required for the laboratory if indeed the instrument was installed. However, with three different verdicts, two of them pretty bad, with one of them questionable, the QC is less of a question, and the bigger question is whether this should be installed in any lab at all.
There is also the further challenge that most small clinic analyzers have very limited, even primitive, QC capabilities. So if we were able to determine that this instrument should be running full "Westgard Rules" with 4 or 8 controls per run, we might be very disapointed to discover that the instrument is only capable of implementing 2 SD limits and can only run 2 or 3 controls at a time. The smaller devices are often not only challenged in their performance, they are also limited in their QC features.
Conclusion: Unsafe for any species?
The authors stated "The in-practice analyzer showed good overall performance, with only calcium and phosphate analytes identified as significantly problematic."
We would reach a different conclusion based on the data and graphs above. If we believe the canine and feline serum pools, we have an instrument which is not fit for purpose for many of these assays. Most of these assays are "significantly problematic" when we use the Sigma scale. Performance this poor will generally require multiple tests, additional consults, more time spent visiting the vet, and etc.