Sigma Metric Analysis
i-Smart 300 analyser: Sigma-metric assessment
A new cartridge-type blood gas analyzer, the i-Smart 300, was assessed in a traditional method validation study. When Six Sigma is used as the standard, is selecting this POC instrument a smart choice?
Sigma-metric Analysis of the i-Smart 300 Cartridge-Type Blood Gas Analyzer
Sten Westgard, MS
April 2018
[NOTE: 4/18/2018 CORRECTIONS MADE TO IMPRECISION OF SODIUM AND CHLORIDE. WE APOLOGIZE FOR THE ERRORS.]
- The Precision, Comparison and Sigma-metric data
- Summary of Performance according to CLIA Goals by Sigma-metrics Normalized Method Decision charts
- QC Implications of i-Smart Performance by Normalized OPSpecs chart
- Conclusion
[Note: This QC application is an extension of the lesson From Method Validation to Six Sigma: Translating Method Performance Claims into Sigma Metrics. This article assumes that you have read that lesson first, and that you are also familiar with the concepts of QC Design, Method Validation, and Six Sigma metrics. If you aren't, follow the link provided.]
We came across an interesting POC blood gas analyzer evaluation:
As Westgard, we don't often dip our toe in the waters of blood gas analyzers. But it was about time we took another look at the latest the industry has to offer.
The Imprecision, Bias and Sigma-metric Data
"IThe total run imprecision was determined using within-laboratory precision with the CLSI EP5-A3. It uses a design with 20 testing days, two runs per tesing day, and two replicate measurements per run (20 X 2 X 2) for each samples using a single reagent and single calibrator lot...
"Method comparison and difference estimation were assessed using a NOVA CCX in the core laboratory. Forty heparinized whole blood specimens were analyzed on the i-Smart and the Nova CCX according to the CLSI EP9-A3."
We really couldn't ask for better method validation studies. They are following the CLSI guidelines, collecting a good set of data over a good set of time. So we will have CV% for the control levels, and then we will have the regression equation from the comparison study, which will allow us to calculate the bias at each control level.
There were for most of the analytes, three levels of control. (there was one analyte, hematocrit, for which we only have two levels of data). We will work with all the data in this analysis.
While the study didn't apply any real performance specifications, we will supply our own: CLIA goals for analytical performance. For these assays, CLIA goals will be quite demanding.
| TEST | TEa Source | Level | TEa | slope | y-int | bias units | % Bias | CV |
| pH | CLIA | 7.16 | 0.56 | 1.33 | -2.36 | 0.00 | 0.0 | 0.1 |
| pH | CLIA | 7.41 | 0.54 | 1.33 | -2.36 | 0.09 | 1.2 | 0.05 |
| pH | CLIA | 7.64 | 0.52 | 1.33 | -2.36 | 0.16 | 2.1 | 0.1 |
| pCO2 | CLIA | 18.77 | 8.00 | 0.95 | -3.38 | -4.32 | 23.0 | 1.4 |
| pCO2 | CLIA | 39.23 | 8.00 | 0.95 | -3.38 | -5.34 | 13.6 | 1.2 |
| pCO2 | CLIA | 66.21 | 8 | 0.95 | -3.38 | -6.69 | 10.1 | 1.1 |
| Sodium | CLIA | 113.7 | 3.52 | 1.02 | -3.09 | -0.82 | 0.7 | 0.52 |
| Sodium | CLIA | 132.4 | 3.02 | 1.02 | -3.09 | -0.44 | 0.3 | 0.46 |
| Sodium | CLIA | 154.8 | 2.58 | 1.02 | -3.09 | 0.01 | 0.0 | 0.46 |
| Potassium | CLIA | 2.02 | 24.75 | 0.88 | 0.34 | 0.10 | 4.8 | 2.1 |
| Potassium | CLIA | 4.28 | 11.68 | 0.88 | 0.34 | -0.17 | 4.1 | 1.0 |
| Potassium | CLIA | 5.98 | 8.36 | 0.88 | 0.34 | -0.38 | 6.3 | 1.1 |
| Chloride | CLIA | 74.9 | 5.00 | 1.05 | -4.17 | -0.42 | 0.6 | 0.07 |
| Chloride | CLIA | 94.4 | 5 | 1.05 | -4.17 | 0.55 | 0.6 | 0.64 |
| Chloride | CLIA | 126 | 5 | 1.05 | -4.17 | 2.13 | 1.7 | 0.73 |
| Calcium | CLIA | 0.577 | 43.2 | 1.05 | -0.15 | -0.12 | 21.0 | 1.6 |
| Calcium | CLIA | 1.163 | 21.4 | 1.05 | -0.15 | -0.09 | 7.9 | 1.0 |
| Calcium | CLIA | 1.474 | 16.9 | 1.05 | -0.15 | -0.08 | 5.2 | 1.2 |
| Hematocrit | CLIA | 27 | 6 | 1.07 | -5.08 | -3.19 | 11.8 | 1.8 |
| Hematocrit | CLIA | 51.6 | 6 | 1.07 | -5.08 | -1.47 | 2.8 | 1.1 |
Yes, that is a whole lot of numbers!
Nevertheless, what do all these numbers mean? In the absence of context, it's hard to know. We're going to be using the CLIA goals for analytical performance specifications. With many of these analytes, to use a different set of goals, such as the "Ricos goals", would set impossible targets to reach.
So let's calculate the Sigma-metrics.
Sigma-metric calculations for the i-Smart
Remember the equation for Sigma metric is (TEa - bias) / CV:
For many of these analytes, (pH, pCO2, Sodium, etc.) the quality requirement / analytical performance specification is actually a unit-based goal, which means at each level of the test, the goal changes.
For simplicity's sake, let's look at the Chloride test, which has a fixed goal of 5%.
For chloride on the low level of the i-smart 300, the equation is (5 - 0.6) / 2.8 = 1.58
The Sigma-metrics are displayed along the right columns.
| TEST | TEa Source | Level | TEa | slope | y-int | bias units | % Bias | CV | Sigma |
| PH | CLIA | 7.16 | 0.56 | 1.33 | -2.36 | 0.00 | 0.0 | 0.1 | 7.42 |
| pH | CLIA | 7.41 | 0.54 | 1.33 | -2.36 | 0.09 | 1.2 | 0.05 | negative |
| pH | CLIA | 7.64 | 0.52 | 1.33 | -2.36 | 0.16 | 2.1 | 0.1 | negative |
| PCO2 | CLIA | 18.77 | 8.00 | 0.95 | -3.38 | -4.32 | 23.0 | 1.4 | negative |
| PCO2 | CLIA | 39.23 | 8.00 | 0.95 | -3.38 | -5.34 | 13.6 | 1.2 | negative |
| PCO2 | CLIA | 66.21 | 8 | 0.95 | -3.38 | -6.69 | 10.1 | 1.1 | negative |
| Sodium | CLIA | 113.7 | 3.52 | 1.02 | -3.09 | -0.82 | 0.7 | 0.52 | 5.39 |
| Sodium | CLIA | 132.4 | 3.02 | 1.02 | -3.09 | -0.44 | 0.3 | 0.46 | 5.84 |
| Sodium | CLIA | 154.8 | 2.58 | 1.02 | -3.09 | 0.01 | 0.0 | 0.46 | 5.61 |
| Potassium | CLIA | 2.02 | 24.75 | 0.88 | 0.34 | 0.10 | 4.8 | 2.1 | 9.49 |
| Potassium | CLIA | 4.28 | 11.68 | 0.88 | 0.34 | -0.17 | 4.1 | 1.0 | 7.48 |
| Potassium | CLIA | 5.98 | 8.36 | 0.88 | 0.34 | -0.38 | 6.3 | 1.1 | 1.91 |
| Chloride | CLIA | 74.9 | 5.00 | 1.05 | -4.17 | -0.42 | 0.6 | 0.07 | very high |
| Chloride | CLIA | 94.4 | 5 | 1.05 | -4.17 | 0.55 | 0.6 | 0.64 | 6.90 |
| Chloride | CLIA | 126 | 5 | 1.05 | -4.17 | 2.13 | 1.7 | 0.73 | 4.53 |
| Calcium | CLIA | 0.577 | 43.2409 | 1.05 | -0.15 | -0.12 | 21.0 | 1.6 | 13.82 |
| Calcium | CLIA | 1.163 | 21.45314 | 1.05 | -0.15 | -0.09 | 7.9 | 1.0 | 13.69 |
| Calcium | CLIA | 1.474 | 16.92673 | 1.05 | -0.15 | -0.08 | 5.2 | 1.2 | 10.0 |
| Hematocrit | CLIA | 27 | 6 | 1.07 | -5.08 | -3.19 | 11.8 | 1.8 | negative |
| Hematocrit | CLIA | 51.6 | 6 | 1.07 | -5.08 | -1.47 | 2.8 | 1.1 | 2.79 |
Yes, there are more than a few Negative Sigma-metrics. This is unusual, reflecting a situation when the bias completely exceeds the allowable total error. That means the i-Smart 300 results are significantly different than the comparison instrument the Nova CCX. Using both of these instruments in the same facility might generate significantly different results for the same patient.
Summary of Performance by Sigma-metrics Method Decision Chart using CLIA Goals
We can make a visual assessment of this performance using a Normalized Sigma-metric Method Decision Chart:
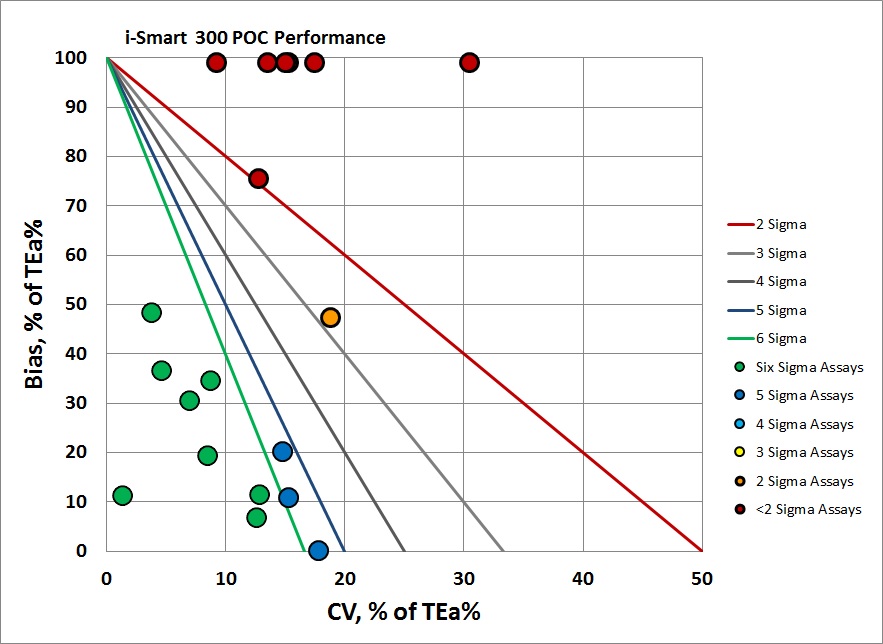
Overall, you can see that there is some good news - 6 levels where the performance is Six Sigma. Then there is another set of levels where performance is "off the charts" vertically, near the top of the chart. There are trueness challenges here.
Summary of QC Design by Normalized OPSpecs chart - using CLIA Goals
The benefit of the Sigma-metric approach is that labs can do more than assess their quality, they can act on it and design what QC rules and controls are needed. Using Normalized OPSpecs charts, we can actually see what QC procedures would be necessary to operate this instrument.
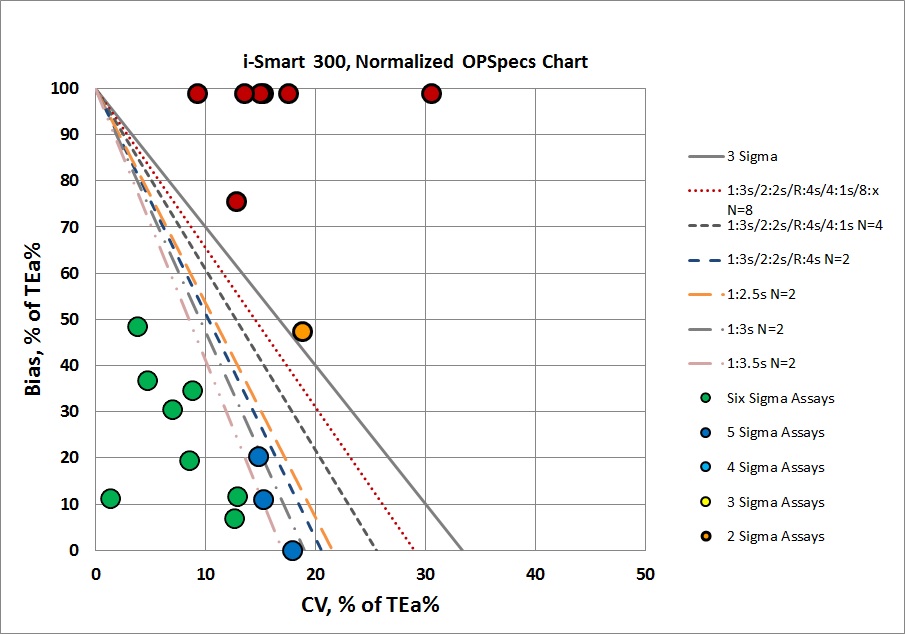
For several analytes, we can use simple 3s limits, no "Westgard Rules" needed. But for many methods, performance is challenged, we not only need the full "Westgard Rules", we need to realize that we need to double or triple the number of controls we are running. For the assays with high bias, we need to determine with further studies whether the problem is the discrepancy a methodology difference between the i-Smart 300 and Nova CCX, or if there is a real trueness issue on the i-Smart 300. It may be we can recalibrate some of this bias away. But biases of this size usually portend larger problems - another study should be done to compare these blood gas results to whatever is being run in the core lab, to assure that the results are in alignment.
In other words, this instrument is going to require more work before we can really put it into routine use.
Conclusion
The authors stated "In conclusion, this study is the first evaluation of the newly launched i-Smart 300 according to the CLSI guidelines. The i-Smart 300 showed excellent precision, linearity, carry-over, and inter-analyzer correlation, even though it is a portable, cartridge-type blood gas analyzer."
We would disagree with these conclusions. It is encouraging to see that 65% of the levels measured are at 5 and 6 Sigma. But when we hold all of the analytes up to the core lab performance specifications set by CLIA, this instrument falls a little short. There are trueness problems. Some of this may be overcome with proper calibration and alignment of instrumentation. But selecting a different instrument for POC blood gas may be the smarter choice.
[Again, our intial post had erroneous judgments on sodium and chloride due to transcription errors on our part. We apologize for these errors. The sodium and chloride performance are actually quite good, part of the highlights of this instrument.]