Sigma Metric Analysis
Cobas b 101 HbA1c Analyzer: Sigma-metric assessment
The latest POC HbA1c analyzer is analyzed for its fitness for purpose, applying not only IFCC standards, Westgard standars, but also (Lenters-)Westra standards. Can this new instrument run the gauntlet of all these benchmarks?
Sigma-metric Analysis of the Cobas b 101 HbA1c Analyzer
Sten Westgard, MS
April 2018
- The Precision, Comparison and Sigma-metric data
- Summary of Performance according to CLIA Goals by Sigma-metrics Normalized Method Decision charts
- QC Implications of i-Smart Performance by Normalized OPSpecs chart
- Conclusion
[Note: This QC application is an extension of the lesson From Method Validation to Six Sigma: Translating Method Performance Claims into Sigma Metrics. This article assumes that you have read that lesson first, and that you are also familiar with the concepts of QC Design, Method Validation, and Six Sigma metrics. If you aren't, follow the link provided.]
[Please note: an earlier version of this article used a 10% TEa goal for DCCT/NGSP units, when that should have been 6.9%. This error has been corrected now.]
At the 2018 Quality in the Spotlight conference, Dr. Erna Lenters-Westra won the "Westgard Award" based on her tireless efforts to improve HbA1c methods. In her acceptance presentation, she discussed how the appropriate standards should be applied when judging HbA1c method acceptablity. Since HbA1c quality has improved dramatically over the last two decades (from something that was not reliable to an assay of sufficient quality to diagnose diabetes), it's clear that the global tightening to allowable total error standards have had a positive impact to patient care.
But even though those standards have been tightened, methods are still coming onto the market that don't meet them. After all, the tightest standards are essentially optional. Dr. Erna Lenters-Westra provides evaluations of HbA1c methods, but the manufacturers have to choose to submit to this rigorous evaluation. Many are too afraid to do so, and they simply comply with the lower regulatory standards and kick their device or method onto the market, hoping no one will notice.
In light of these developments, we're looking at a recent entry to the HbA1c POC market: the Cobas b 101 HbA1c Analyzer:
The Imprecision, Bias and Sigma-metric Data
"Repeatability and within-laboratory precision were determined using two quality control (QC) materials with different HbA1c levels, supplied by the manufacturer of teh cobas HbA1c control. Both QC materials were assayed in duplicate twice daily at 9 am and 3 pm for a total of 20 days according to the 2014 Clinical and Laboratory Standards Institute (CLIS) guideline EP05-A3."
The protocol being followed is ideal, however it would be better to use independent controls (3rd party) to give a more objective assessment.
"Linear regression and %differences in estimated HbA1c levels between the cobas b 101 and Variant II Turbo were determine according to the 2013 CLSI guideline EP09-A3 protocol...Two types of blood specimens were obtained immediately before the tests from the 40 enrolled participants: capillary blood and EDTA whole blood. The capillary finger prick samples and EDTA whole blood samples were analyzed using the cobas b 1010 POC system in the phlebotomy room and the EDTA whole blood samples were analyzed using the Variant II Turbo in the central laboraotry. the HbA1c levels of samples spanned the clinically relevant range of 4.8% to 8.6%."
This is good study design. The Variant II Turbo is an HPLC method considererd to be a reference method, "certified by the NGSP with documented traceability to the Diabetes Control and Complications Trial (DCCT) reference method.
Where this analysis gets more complicated is when we apply the different standards available from CAP/NGSP, IFCC standardization committee, and the Dr. Erna (Lenters-)Westra rules.
- The goal we typically apply is the CAP/NGSP goal of 6.0% TEa (allowable total error) at a level of 6.5% HbA1c, the level at which diagnosis of diabetes can be made
- The IFCC committee recommends setting a TEa of 5 mmol/mol in IFCC units ( 0.46% DCCT units), with a 2 Sigma criterion for routine laboratories passing and 4 sigma criterion for laboratories working in clinical trials Evaluating new HbA1c methods for adoption by the IFCC and NGSP reference networks using international quality targets, Erna Lenters-Westra, Emma English, Clin Chem Lab Med. 2017 Aug 28;55(9):1426-1434. doi: 10.1515/cclm-2017-0109. Dr. Lenters clarifies that there is a difference in the units:
"Total Allowable Error (TAE) for HbA1c has been set by the IFCC Task Force on Implementation of HbA1c standardization as a default of 5 mmol/mol (0.46% DCCT) at an HbA1c level of 50 mmol/mol (6.7% DCCT) which corresponds with a relative TAE of 10% ((5/50)*100%) in SI units (6.9% DCCT units ((0.46/6.7)*100%)) with risk levels of 2σ for routine laboratories and 4σ for laboratories performing clinical trials." - The (Lenters-)Westra rules: CV in CLSI EP-5 should be at 48 mmol/mol and 75 mmol/mol < or equal to 3% in SI units or < or equal to 2% in DCCT units; Bias in CLSI EP-9 at 48 mmol/mol and 75 mmol/mol compared with the mean of at least 3 certified secondary reference measurement procedures should < or equal to 2 mmol/mol or < or equal to 0.2% DCCT units.
Right out of the gate, you can see that the study did not use 3 certified secondary reference measurement procedures in order to calculate bias. I would hazard that only studies that involve Dr. Erna Lenters-Westra will include such a robust comparative study. She is essentially generating a gold standard for HbA1c evaluation study design that most typical studies do not reach.
Nevertheless, let's forge ahead. Here the performance data:
| TEa source | Level | TEa% | slope | y-int | bias units | bias$ | CV% |
| CAP/NGSP | 5.1 | 6.00 | 0.95 | 0.37 | 0.10 | 1.9 | 5.2 |
| CAP/NGSP | 9.5 | 6.00 | 0.95 | 0.37 | -0.14 | -1.5 | 2.56 |
| Lenters-Westra/IFCC | 5.1 | 6.9 | 0.95 | 0.37 | 0.10 | 1.9 | 5.2 |
| Lenters-Westra/IFCC | 9.5 | 6.9 | 0.95 | 0.37 | -0.14 | -1.5 | 2.56 |
In contrast, to our usual multitest instrument evaluations, there is a smaller, much more compact set of numbers to deal with here.
Unfortunately, not many of these numbers look that good. By Lenters-Westra rules, this method is exceeding both allowable imprecision and allowable bias.
Sigma-metric calculations for the cobas b 101
Remember the equation for Sigma metric is (TEa - bias) / CV:
For the CAP/NGSP goal, at the low end, the equation is (6 - 1.9) / 5.2 = 0.78
The Sigma-metrics are displayed along the right columns.
| TEa source | Level | TEa% | slope | y-int | bias units | bias$ | CV% | Sigma-metric |
Normalized |
Normalized y-coord |
| CAP/NGSP | 5.1 | 6.00 | 0.95 | 0.37 | 0.10 | 1.9 | 5.2 | 0.78 | 87.00 | 32.22 |
| CAP/NGSP | 9.5 | 6.00 | 0.95 | 0.37 | -0.14 | -1.5 | 2.56 | 1.77 | 42.67 | 24.39 |
| Westra/IFCC | 5.1 | 6.9 | 0.95 | 0.37 | 0.10 | 1.9 | 3.7 | 0.96 | 75.36 | 28.02 |
| Westra/IFCC | 9.5 | 6.9 | 0.95 | 0.37 | -0.14 | -1.5 | 4.4 | 2.12 | 37.10 | 21.21 |
The last two columns detail where we will graph these coordinates on Normalized Method Decision and Normalized OPSpecs chart.
According to the Lenters-Westra/IFCC standard, the cobas b 101 is achieving the minimum Sigma for acceptance forthe abnormal level: >2 Sigma, but just barely. For CAP/NGSP, the performance for both levels is below 2 Sigma. Given that the normal performance that other methods strive for is in the 4 to 6 Sigma range, this is not exactly an exciting result for a new method entering the market.
Summary of Performance by Sigma-metrics Method Decision Chart using CLIA Goals
We can make a visual assessment of this performance using a Normalized Sigma-metric Method Decision Chart:
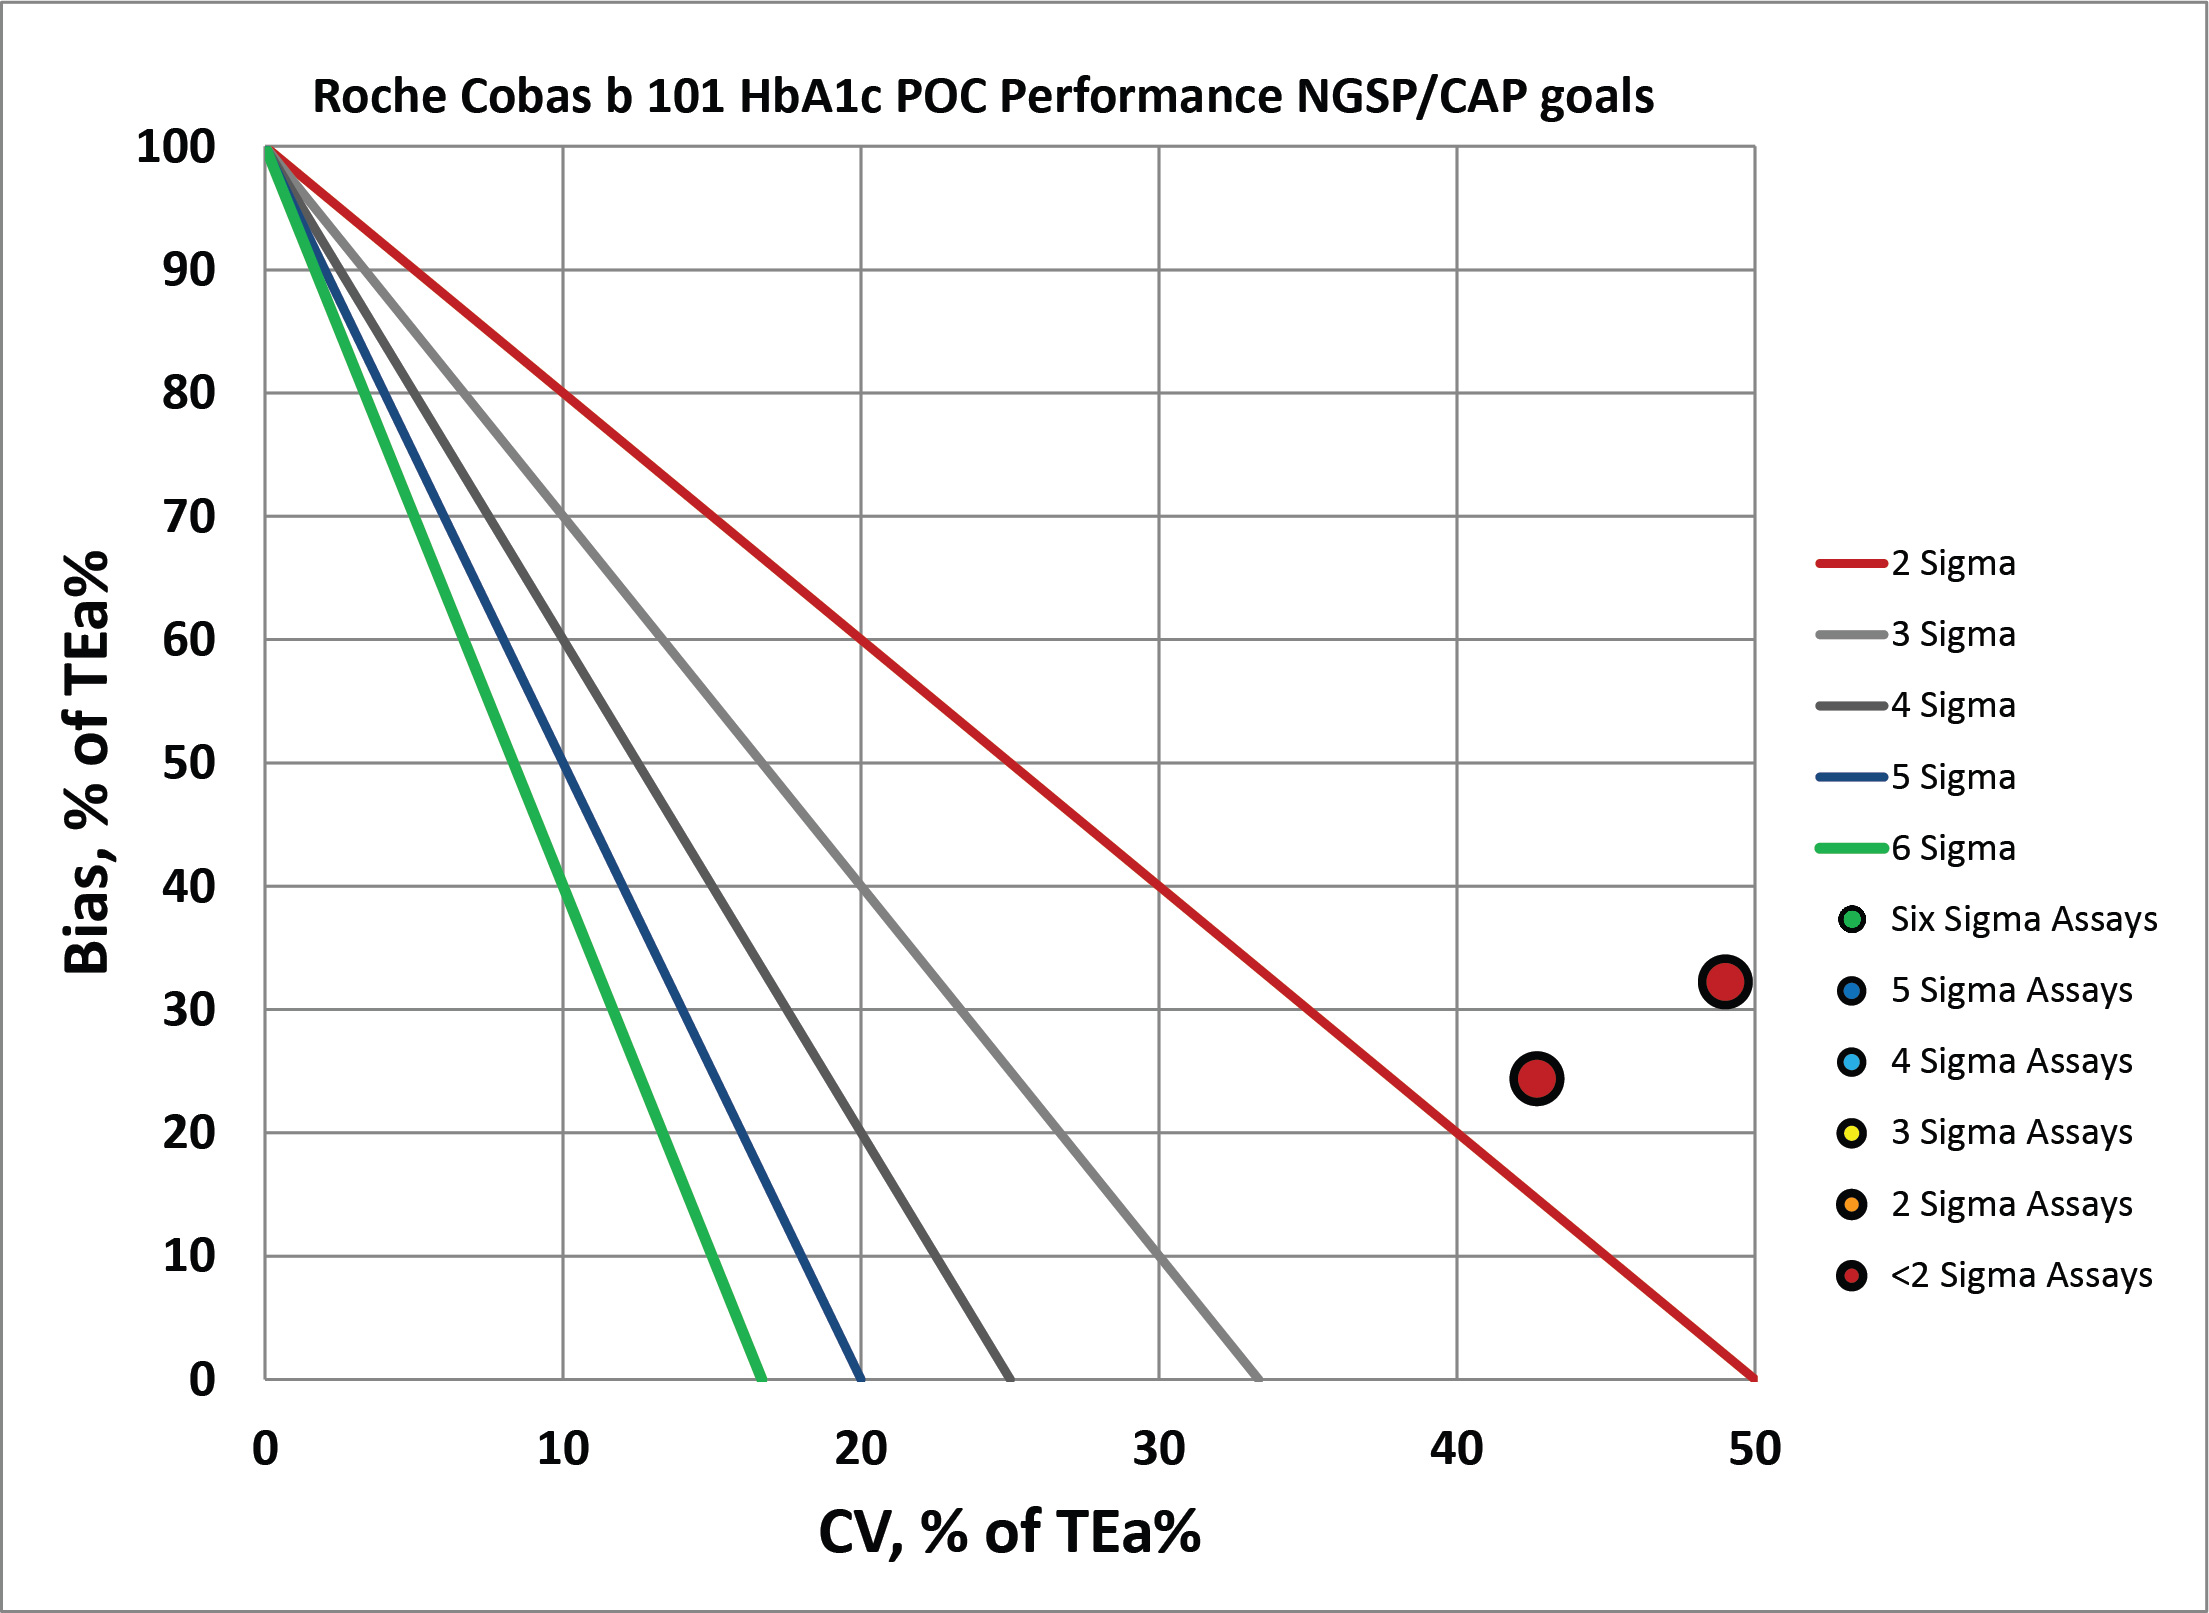
By CAP/NGSP, this method misses the target.
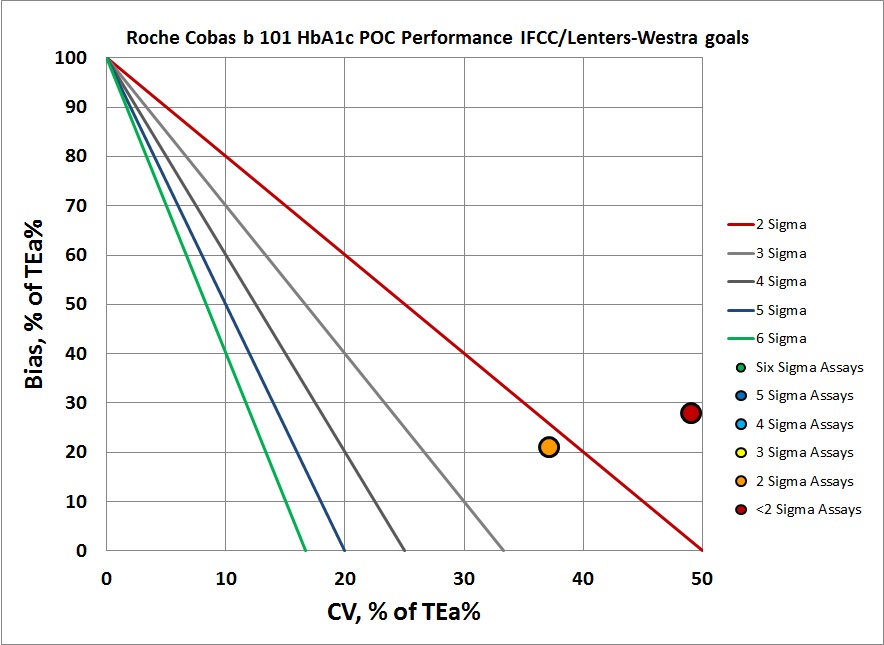
By IFCC/Lenters-Westra standards, it's not much better. But of course at the normal level the control does inch past the 2-Sigma line. So this method is half acceptable. The abnormal level, however, is actually off the chart, but we've tucked it in on the right edge of the graph.
Summary of QC Design by Normalized OPSpecs chart - using CLIA Goals
The benefit of the Sigma-metric approach is that labs can do more than assess their quality, they can act on it and design what QC rules and controls are needed. Using Normalized OPSpecs charts, we can actually see what QC procedures would be necessary to operate this instrument.
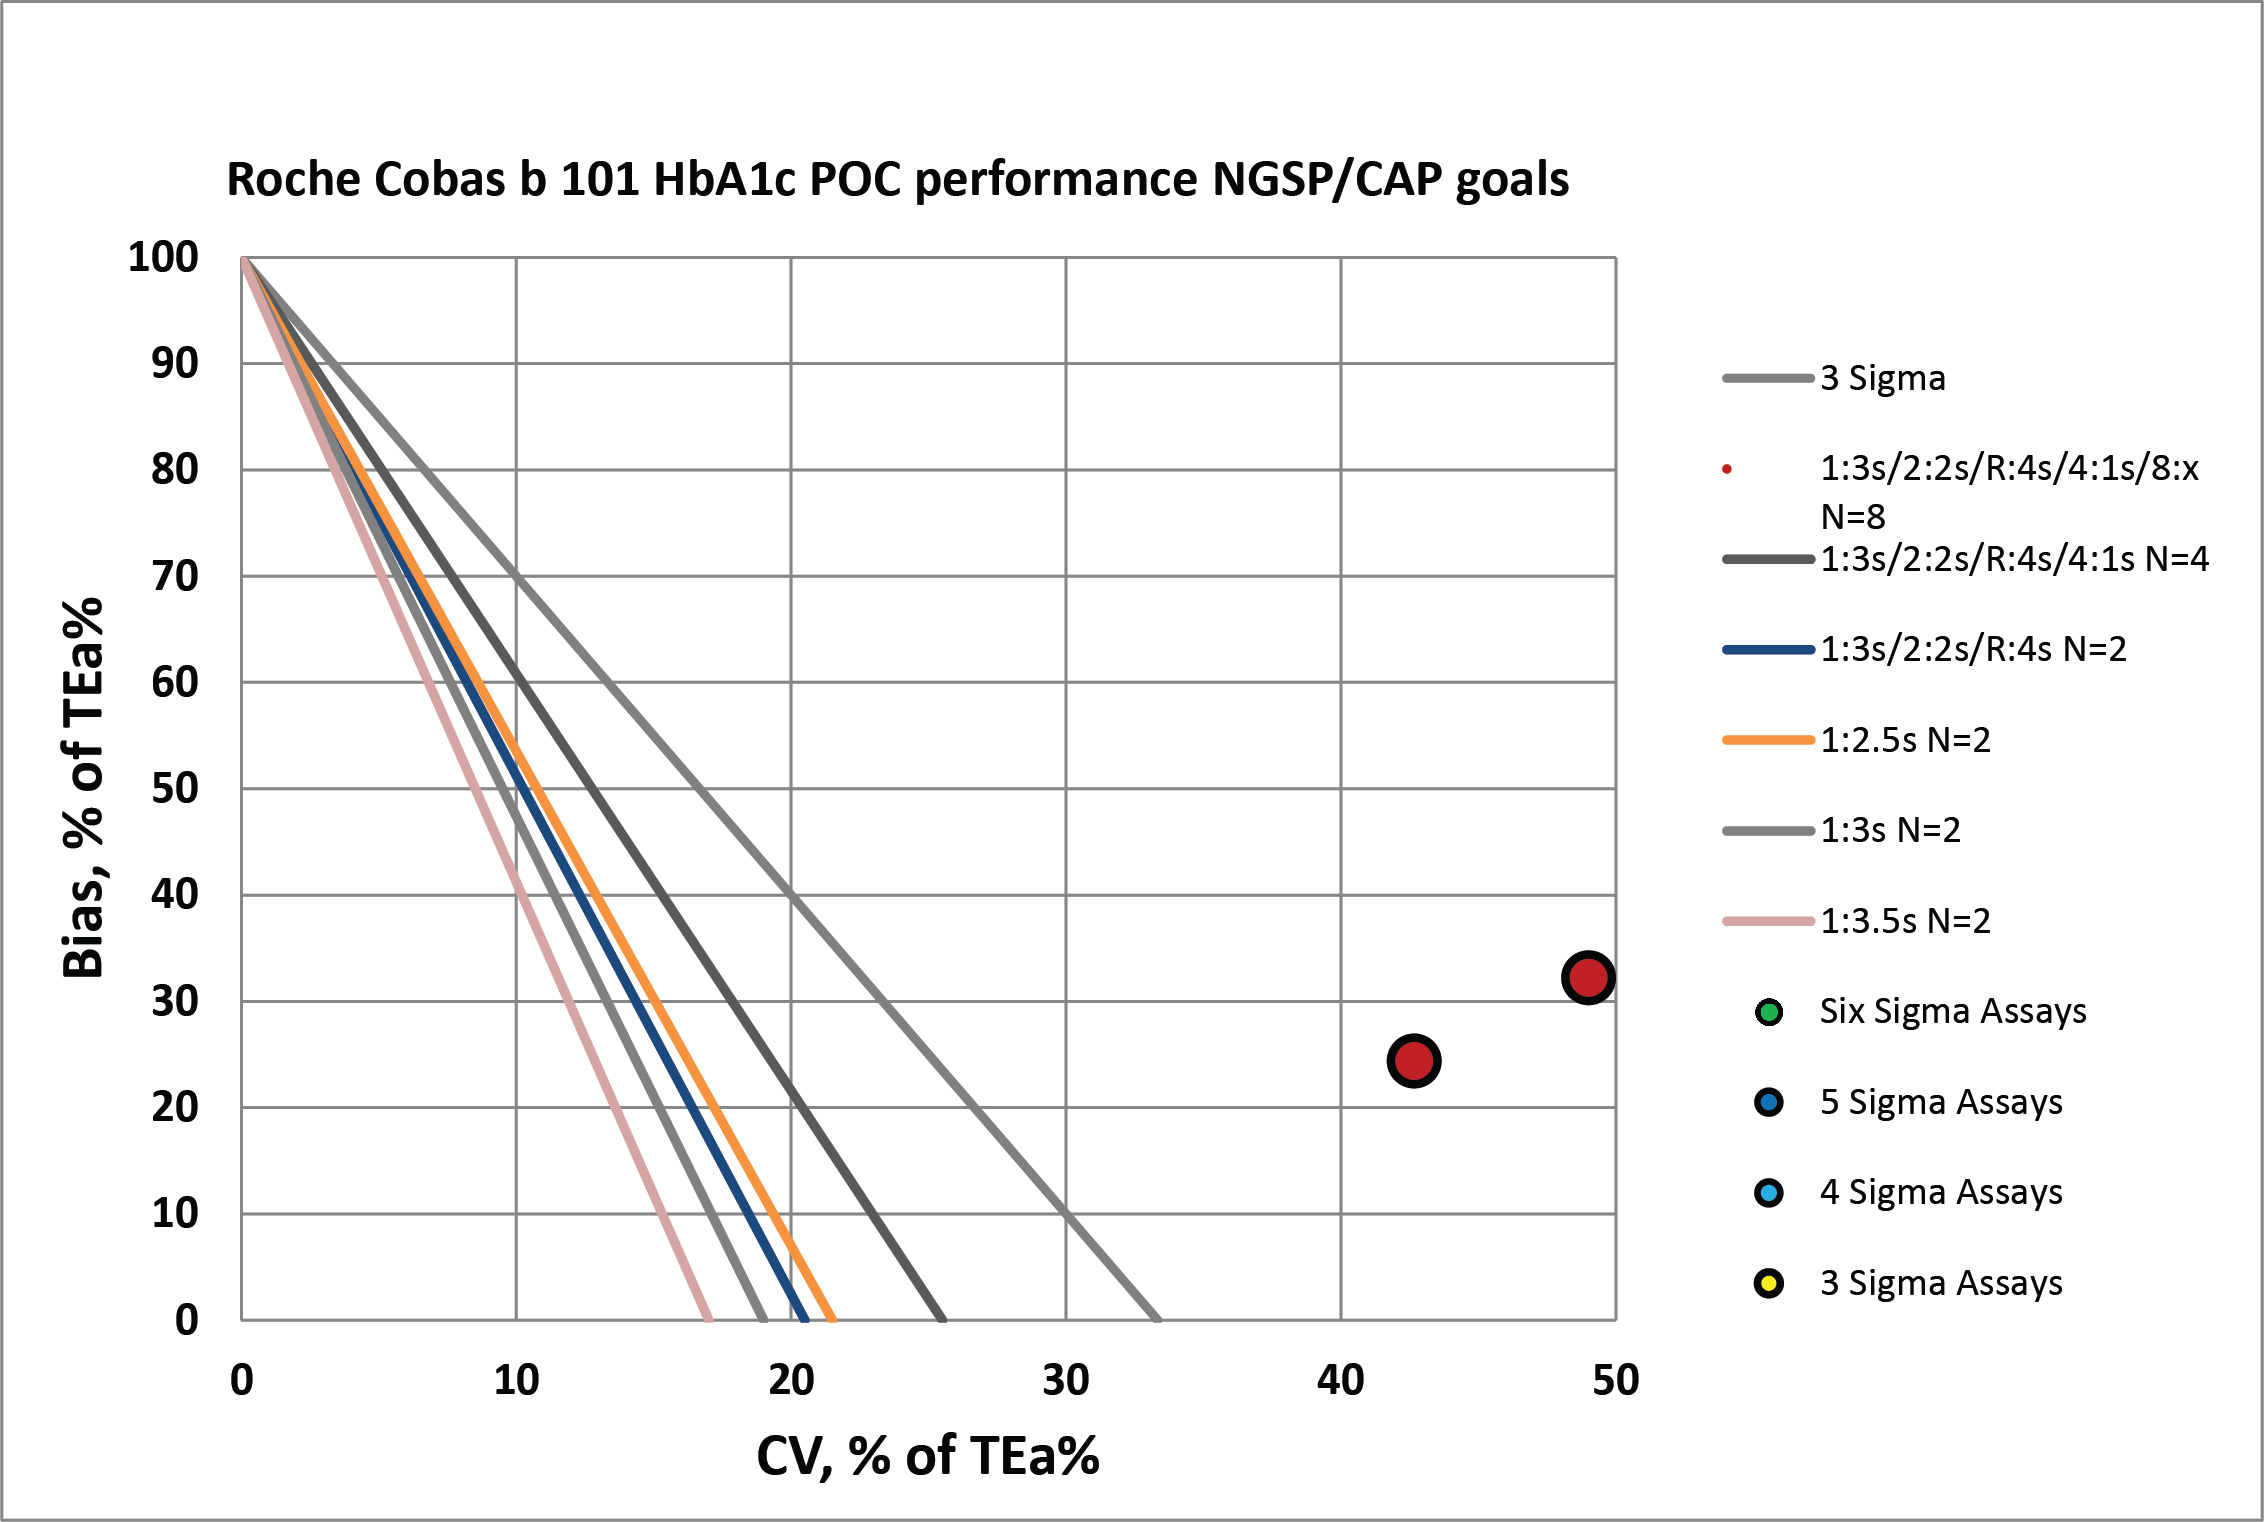
According to CAP/NGSP standards, this method is going to need all the "Westgard Rules" and more. If we were to apply a QC Frequency Nomogram, we would probably find the frequency of needing to run controls was extremely often.
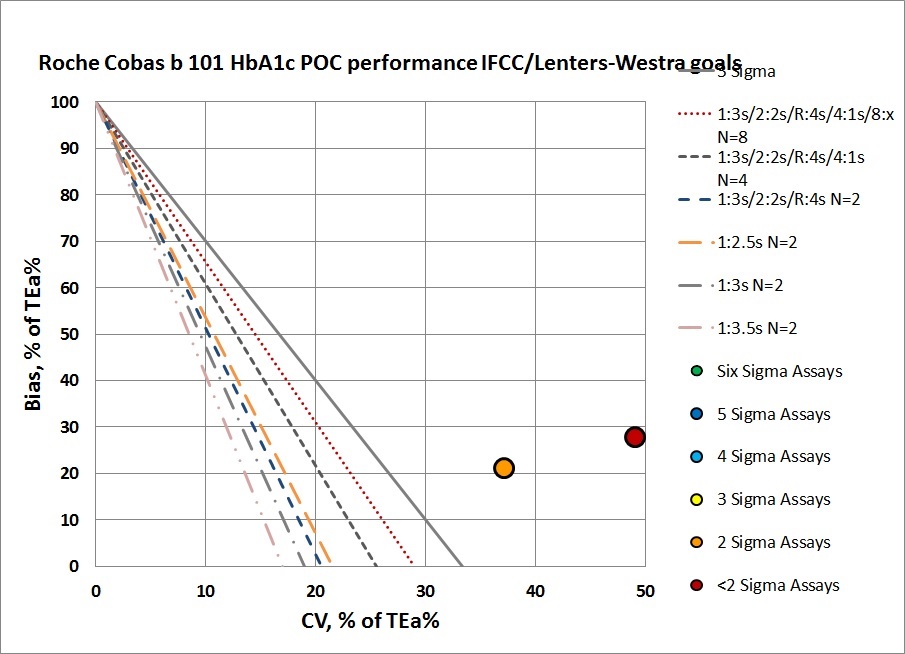
Neither of these levels can be controlled with even a maximum set of "Westgard Rules" and 4 to 8 controls per run. That will be necessary, but truly they need to do something more than just statistical QC to monitor this method. Perhaps running patients in replicates will help reduce the imprecision. he abnormal level is just missing the target. No amount of "Westgard Rules" and controls will bring this method back into acceptability.
It's also probably too optimistic to assume that this instrument has the capability to customize its QC based on levels, or that it could run more than a typical two controls per run.
Conclusion
The authors stated "In conclusion, comparative analyses with the reference method using the Variant II Turbo and the POC test using the cobas b 101 showed strong correlations using EDTA whole blood samples in our study....However, exhaustive precision analyses are necessary before clinical use. Therefore, the cobas b 101 analyzer is a convenient assay for HbA1c levles and may be useful for diabetes management."
We would characterize this conclusion as faint praise. As we all know, the correlation coefficient is NOT an appropriate way to evaluate an instrument. To qualify this study by recommending more exhaustive analysis on imprecision is also a tip-off that this method may not be appropriate. And if the last sentence only talks about possible convenience, without mentioning quality, that's another red flag.