Sigma Metric Analysis
JEOL BioMajesty JCA-BM6010/C Clinical Chemistry Analyzer: Sigma-metric analysis
Are there other choices than the big 5 diagnostic analyzers? Beyond Beckman, After Abbott, Roche, Siemens, and Vista, are there viable alternatives for chemisty analyzers? We take a look at a new automated clinical chemistry analyzer, evaluating both its "closed" and "open" reagent performance.
Sigma-metric Analysis of JEOL BioMajesty JCA/BM6010-/C Automated Clinical Chemistry Analyzer
Sten Westgard, MS
April 2018
- The Precision, Comparison and Sigma-metric data
- Summary of Performance according to CLIA and Ricos Goals by Sigma-metrics Normalized Method Decision charts
- QC Implications of Sysmex XN Performance by Normalized OPSpecs chart
- Conclusion
[Note: This QC application is an extension of the lesson From Method Validation to Six Sigma: Translating Method Performance Claims into Sigma Metrics. This article assumes that you have read that lesson first, and that you are also familiar with the concepts of QC Design, Method Validation, and Six Sigma metrics. If you aren't, follow the link provided.]
Are there only 5 choices when it comes to chemistry analyzers? Or are there other instruments entering the marketplace we should be considering? A recent paper gives us a chance to contemplate a new alternative.
Performance Evaluation of the JEOL BioMajesty JCA-BM6010/C Automated Clinical Chemistry Analyzer.Hyeong Nyeon Kim, Misuk Ji, Hee-Won Moon, Mina Hur, Yeo-Minn Yun, Lab Med Online Vol. 7, No3: 111-119, July 2017
The additional component of interest in this study is that they examined not only the closed reagents made by the manufacturer, but also the use of third-party reagents ("open" reagents). So we get a chance to see two different perspectives on performance on this instrument.
The Imprecision, Bias and Sigma-metric Data
"For evaluation of precision, we tests all the analytes in Liquid Assayed Multiqual (human serum based) chemistry control Level 1 and Level 2 (Bio-Rad Laboratories, Inc. Hercules, CA, USA) according to the Clinical and Laboratory Standards Institute (CLSI) guideline EP5-A2....After preliminary evaluation for five consecutive days, the two levels were tested in duplicate, with two runs per day over 20 days. Repeatability, between-run, between-day, and total precision were evaluated for all available analytes...."
"Method comparison was performed following CLSI guideline EP9-A2-IR....Specimens with variable measurement ranges were collected using leftover serum samples. In the first comparison of the 11 analytes, a set of 50 serum samples was tests using JCA-BM6010/C and the Roche-Hitachi Cobas 8000 c702 chemistry autoanalyzer (Cobas 8000, Roche diagnostics, Basel, Switzerland) in duplicate, using the reagenets provided by the respective manufacturers (JEOL vs Roche). In the second comparison, a set of 50 serum samples was tested for nine analytes (ALP, ALT, AST, calcium, creatinine, GGT, glucose, LDH and uric acid) in duplicate using teh JCA-BM6010/C analyzer with JEOL closed reagenets and other open reagents. The manufacturers of teh open reagenets were Sekisui (AST, ALT, GGT, calcium, and uric acid), Denka Seiken (Gluocose, LDH) and Roche (ALP, creatinine).... Each value was compared using Deming regression analysis and Blant-Altman plots."
Again, the design of the study is admirable, adhering to all the appropriate CLSI protocols. We can have confidence in the data produced, even if we're still not sure of the conclusion.
Two levels of performance were recorded. Bias was calculated using the Deming regression equations
| JCA-BM6010/C chemistry analyzer | CLOSED reagents | Instrument Information | ||||||
| TEST | TEa Source | TEa | Level | Slope | Intercept | Bias Units | % Bias | CV |
| Alk Phos | CLIA | 30 | 95.1 | 3.40 | 3.20 | 231.44 | 243.4 | 1.5 |
| Alk Phos | 30% | 30 | 603.7 | 3.40 | 3.20 | 1452.08 | 240.5 | 2.4 |
| ALT | CLIA | 20 | 25 | 1.16 | 0.70 | 4.70 | 18.8 | 2.7 |
| ALT | 20% | 20 | 190.6 | 1.16 | 0.70 | 31.20 | 16.4 | 1.9 |
| AST | CLIA | 20 | 42.5 | 1.08 | -0.31 | 3.09 | 7.3 | 1.4 |
| AST | 20% | 20 | 250.9 | 1.08 | -0.31 | 19.76 | 7.9 | 1.1 |
| Bilirubin, Total | CLIA 20% or | 66.67 | 0.60 | 0.98 | -0.01 | -0.02 | -3.7 | 2.3 |
| Bilirubin, Total | 0.4 mg/dL | 20.00 | 6.40 | 0.98 | -0.01 | -0.14 | -2.2 | 1.8 |
| Calcium | 1 mg/dL | 16.39344 | 6.1 | 1.05 | -0.22 | 0.09 | 1.4 | 1.5 |
| Calcium | 1 mg/dL | 7.352941 | 13.6 | 1.05 | -0.22 | 0.46 | 3.4 | 1.2 |
| Creatinine | CLIA | 57.14286 | 0.7 | 0.95 | -0.04 | -0.08 | -10.7 | 1.5 |
| Creatinine | 0.4 or 20% | 20 | 7 | 0.95 | -0.04 | -0.39 | -5.6 | 1.1 |
| GGT | Ricos | 22.11 | 30.10 | 1.05 | 9.96 | 11.47 | 38.1 | 2.1 |
| GGT | 22% | 22.11 | 141.30 | 1.05 | 9.96 | 17.03 | 12.0 | 1.0 |
| Glucose | CLIA 10% or | 10.00 | 62.40 | 0.99 | 1.86 | 1.24 | 2.0 | 1.4 |
| Glucose | 6 mg/dL | 10.00 | 360.20 | 0.99 | 1.86 | -1.74 | -0.5 | 1.4 |
| LDH | CAP | 20.00 | 111.20 | 1.04 | 7.65 | 12.10 | 10.9 | 2.0 |
| LDH | 20% | 20.00 | 374.60 | 1.04 | 7.65 | 22.63 | 6.0 | 1.6 |
| Protein, Total | CAP | 10.00 | 3.90 | 1.00 | -0.17 | -0.17 | -4.4 | 1.0 |
| Protein, Total | 10% | 10.00 | 6.80 | 1.00 | -0.17 | -0.17 | -2.5 | 1.3 |
| Uric Acid | CLIA | 17.00 | 3.40 | 1.00 | 0.03 | 0.03 | 0.9 | 1.7 |
| Uric Acid | 17% | 17.00 | 9.70 | 1.00 | 0.03 | 0.03 | 0.3 | 1.2 |
What may immediately jump out of this see of numbers are the regression slope and biases for Alkaline Phosphatase and the high biases for AST,
| JCA-BM6010/C chemistry analyzer | OPEN REAGENTS | Instrument Information | |||||||
| TEST | TEa Source | TEa | Level | Slope | Intercept | Bias Units | % Bias | CV | Reagent |
| Alk Phos | CLIA | 30 | 95.1 | 3.01 | 9.78 | 200.93 | 211.3 | 1.5 | Roche |
| Alk Phos | 30% | 30 | 603.7 | 3.01 | 9.78 | 1223.22 | 202.6 | 2.4 | |
| ALT | CLIA | 20 | 25 | 1.02 | -3.41 | -2.91 | -11.6 | 2.7 | Sekisui |
| ALT | 20% | 20 | 190.6 | 1.02 | -3.41 | 0.40 | 0.2 | 1.9 | |
| AST | CLIA | 20 | 42.5 | 0.99 | -0.41 | -0.83 | -2.0 | 1.4 | Roche |
| AST | 20% | 20 | 250.9 | 0.99 | -0.41 | -2.92 | -1.2 | 1.1 | |
| Calcium | 1 mg/dL | 16.39344 | 6.1 | 1.01 | 0.55 | 0.61 | 10.0 | 1.5 | Sekisui |
| Calcium | 1 mg/dL | 7.352941 | 13.6 | 1.01 | 0.55 | 0.69 | 5.0 | 1.2 | |
| Creatinine | CLIA | 57.14286 | 0.7 | 1.00 | -0.26 | -0.26 | -37.1 | 1.5 | Roche |
| Creatinine | 0.4 or 20% | 20 | 7 | 1.00 | -0.26 | -0.26 | -3.7 | 1.1 | |
| GGT | Ricos | 22.11 | 30.10 | 0.95 | 2.09 | 0.58 | 1.9 | 2.1 | Sekisui |
| GGT | 22% | 22.11 | 141.30 | 0.95 | 2.09 | -4.97 | -3.5 | 1.0 | |
| Glucose | CLIA 10% or | 10.00 | 62.40 | 1.00 | 0.05 | 0.05 | 0.1 | 1.4 | Denka Seiken |
| Glucose | 6 mg/dL | 10.00 | 360.20 | 1.00 | 0.05 | 0.05 | 0.0 | 1.4 | |
| LDH | CAP | 20.00 | 111.20 | 0.46 | 3.33 | -56.72 | -51.0 | 2.0 | Denka Seiken |
| LDH | 20% | 20.00 | 374.60 | 0.46 | 3.33 | -198.95 | -53.1 | 1.6 | |
| Uric Acid | CLIA | 17.00 | 3.40 | 1.03 | -0.23 | -0.13 | -3.8 | 1.7 | Sekisui |
| Uric Acid | 17% | 17.00 | 9.70 | 1.03 | -0.23 | 0.06 | 0.6 | 1.2 | |
Now that the instrument is using third-party reagents, the biases change, but some aren't any better than the "closed" system reagents. That alkaline phosphatase still has a huge regression slope and bias. LDH also has some significantly large biases, due to a very low regression slope. The BM6010/C just isn't comparable to the Roche Cobas 8000 on these methods.
Nevertheless, what do all these numbers mean? In the absence of context, it's hard to know.
So let's calculate the Sigma-metrics.
Sigma-metric calculations for the BM6010/C
Remember the equation for Sigma metric is (TEa - bias) / CV:
For a 30% quality requirement, for Alkaline Phosphatase on the low level of BM6010/C, the equation is (30-243.4) / 1.5 = very much less than zero
For a 30% quality requirement, for Alkaline Phosphatase on the high level of BM6010/C, the equation is (30 - 240.5) / 2.4 = very much less than zero
Bluntly, this alk phos method is going to generate very different numbers than the Cobas 8000. It's either going to confuse a clinician or prompt them toward the wrong diagnosis.
The metrics are displayed along the right columns. (The last two columns give us an idea of where we need to graph the points on our Normalized Method Decision Charts.)
| JCA-BM6010/C chemistry analyzer | CLOSED reagents | Instrument Information | |||||||||
| TEST | TEa Source | TEa | Level | Slope | Intercept | Bias Units | % Bias | CV | Sigma | NOPSx | NOPSy |
| Alk Phos | CLIA | 30 | 95.1 | 3.40 | 3.20 | 231.44 | 243.4 | 1.5 | negative | 5.00 | 811.22 |
| Alk Phos | 30% | 30 | 603.7 | 3.40 | 3.20 | 1452.08 | 240.5 | 2.4 | negative | 8.00 | 801.77 |
| ALT | CLIA | 20 | 25 | 1.16 | 0.70 | 4.70 | 18.8 | 2.7 | 0.4 | 13.50 | 94.00 |
| ALT | 20% | 20 | 190.6 | 1.16 | 0.70 | 31.20 | 16.4 | 1.9 | 1.9 | 9.50 | 81.84 |
| AST | CLIA | 20 | 42.5 | 1.08 | -0.31 | 3.09 | 7.3 | 1.4 | 9.1 | 7.00 | 36.35 |
| AST | 20% | 20 | 250.9 | 1.08 | -0.31 | 19.76 | 7.9 | 1.1 | 11.0 | 5.50 | 39.38 |
| Bilirubin, Total | CLIA 20% or | 66.67 | 0.60 | 0.98 | -0.01 | -0.02 | -3.7 | 2.3 | 27.4 | 3.45 | 5.50 |
| Bilirubin, Total | 0.4 mg/dL | 20.00 | 6.40 | 0.98 | -0.01 | -0.14 | -2.2 | 1.8 | 9.9 | 9.00 | 10.78 |
| Calcium | 1 mg/dL | 16.39344 | 6.1 | 1.05 | -0.22 | 0.09 | 1.4 | 1.5 | 10.0 | 9.15 | 8.50 |
| Calcium | 1 mg/dL | 7.352941 | 13.6 | 1.05 | -0.22 | 0.46 | 3.4 | 1.2 | 3.3 | 16.32 | 46.00 |
| Creatinine | CLIA | 57.14286 | 0.7 | 0.95 | -0.04 | -0.08 | -10.7 | 1.5 | 45.2 | 2.63 | 18.75 |
| Creatinine | 0.4 or 20% | 20 | 7 | 0.95 | -0.04 | -0.39 | -5.6 | 1.1 | 13.1 | 5.50 | 27.86 |
| GGT | Ricos | 22.11 | 30.10 | 1.05 | 9.96 | 11.47 | 38.1 | 2.1 | negative | 9.50 | 172.27 |
| GGT | 22% | 22.11 | 141.30 | 1.05 | 9.96 | 17.03 | 12.0 | 1.0 | 10.1 | 4.52 | 54.49 |
| Glucose | CLIA 10% or | 10.00 | 62.40 | 0.99 | 1.86 | 1.24 | 2.0 | 1.4 | 5.7 | 14.00 | 19.81 |
| Glucose | 6 mg/dL | 10.00 | 360.20 | 0.99 | 1.86 | -1.74 | -0.5 | 1.4 | 7.5 | 14.00 | 4.84 |
| LDH | CAP | 20.00 | 111.20 | 1.04 | 7.65 | 12.10 | 10.9 | 2.0 | 4.6 | 10.00 | 54.40 |
| LDH | 20% | 20.00 | 374.60 | 1.04 | 7.65 | 22.63 | 6.0 | 1.6 | 8.7 | 8.00 | 30.21 |
| Protein, Total | CAP | 10.00 | 3.90 | 1.00 | -0.17 | -0.17 | -4.4 | 1.0 | 14.4 | 10.00 | 43.59 |
| Protein, Total | 10% | 10.00 | 6.80 | 1.00 | -0.17 | -0.17 | -2.5 | 1.3 | 9.6 | 13.00 | 25.00 |
| Uric Acid | CLIA | 17.00 | 3.40 | 1.00 | 0.03 | 0.03 | 0.9 | 1.7 | 9.5 | 10.00 | 5.19 |
| Uric Acid | 17% | 17.00 | 9.70 | 1.00 | 0.03 | 0.03 | 0.3 | 1.2 | 13.9 | 7.06 | 1.82 |
So there's some good news, some great news, and some really, really bad news in this collection of metrics. Many of these analytes are good performers. But some are just outright terrible and we should investigate the study, the method, the reagent, and think seriously about using that parameter if we do decide to use the instrument.
Is it any better when the instrument is using third-party reagent?
| JCA-BM6010/C chemistry analyzer | OPEN REAGENTS | Instrument Information | |||||||||
| TEST | TEa Source | TEa | Level | Slope | Intercept | Bias Units | % Bias | CV | Sigma | NOPSx | NOPSy |
| Alk Phos | CLIA | 30 | 95.1 | 3.01 | 9.78 | 200.93 | 211.3 | 1.5 | negative | 5.00 | 704.28 |
| Alk Phos | 30% | 30 | 603.7 | 3.01 | 9.78 | 1223.22 | 202.6 | 2.4 | negative | 8.00 | 675.40 |
| ALT | CLIA | 20 | 25 | 1.02 | -3.41 | -2.91 | -11.6 | 2.7 | 3.1 | 13.50 | 58.20 |
| ALT | 20% | 20 | 190.6 | 1.02 | -3.41 | 0.40 | 0.2 | 1.9 | 10.4 | 9.50 | 1.05 |
| AST | CLIA | 20 | 42.5 | 0.99 | -0.41 | -0.83 | -2.0 | 1.4 | 12.9 | 7.00 | 9.82 |
| AST | 20% | 20 | 250.9 | 0.99 | -0.41 | -2.92 | -1.2 | 1.1 | 17.1 | 5.50 | 5.82 |
| Calcium | 1 mg/dL | 16.39344 | 6.1 | 1.01 | 0.55 | 0.61 | 10.0 | 1.5 | 4.3 | 9.15 | 61.10 |
| Calcium | 1 mg/dL | 7.352941 | 13.6 | 1.01 | 0.55 | 0.69 | 5.0 | 1.2 | 1.9 | 16.32 | 68.60 |
| Creatinine | CLIA | 57.14286 | 0.7 | 1.00 | -0.26 | -0.26 | -37.1 | 1.5 | 13.3 | 2.63 | 65.00 |
| Creatinine | 0.4 or 20% | 20 | 7 | 1.00 | -0.26 | -0.26 | -3.7 | 1.1 | 14.8 | 5.50 | 18.57 |
| GGT | Ricos | 22.11 | 30.10 | 0.95 | 2.09 | 0.58 | 1.9 | 2.1 | 9.6 | 9.50 | 8.79 |
| GGT | 22% | 22.11 | 141.30 | 0.95 | 2.09 | -4.97 | -3.5 | 1.0 | 18.6 | 4.52 | 15.92 |
| Glucose | CLIA 10% or | 10.00 | 62.40 | 1.00 | 0.05 | 0.05 | 0.1 | 1.4 | 7.1 | 14.00 | 0.80 |
| Glucose | 6 mg/dL | 10.00 | 360.20 | 1.00 | 0.05 | 0.05 | 0.0 | 1.4 | 7.1 | 14.00 | 0.14 |
| LDH | CAP | 20.00 | 111.20 | 0.46 | 3.33 | -56.72 | -51.0 | 2.0 | negative | 10.00 | 255.03 |
| LDH | 20% | 20.00 | 374.60 | 0.46 | 3.33 | -198.95 | -53.1 | 1.6 | negative | 8.00 | 265.56 |
| Uric Acid | CLIA | 17.00 | 3.40 | 1.03 | -0.23 | -0.13 | -3.8 | 1.7 | 7.8 | 10.00 | 22.15 |
| Uric Acid | 17% | 17.00 | 9.70 | 1.03 | -0.23 | 0.06 | 0.6 | 1.2 | 13.6 | 7.06 | 3.70 |
This time there are more Negative Sigma-metrics. Any time this happens is unusual, reflecting a situation when the bias completely exceeds the allowable total error.
Summary of Performance by Sigma-metrics Method Decision Chart using CLIA and Ricos Goals
We can make visual assessments of this performance using a Normalized Sigma-metric Method Decision Chart:
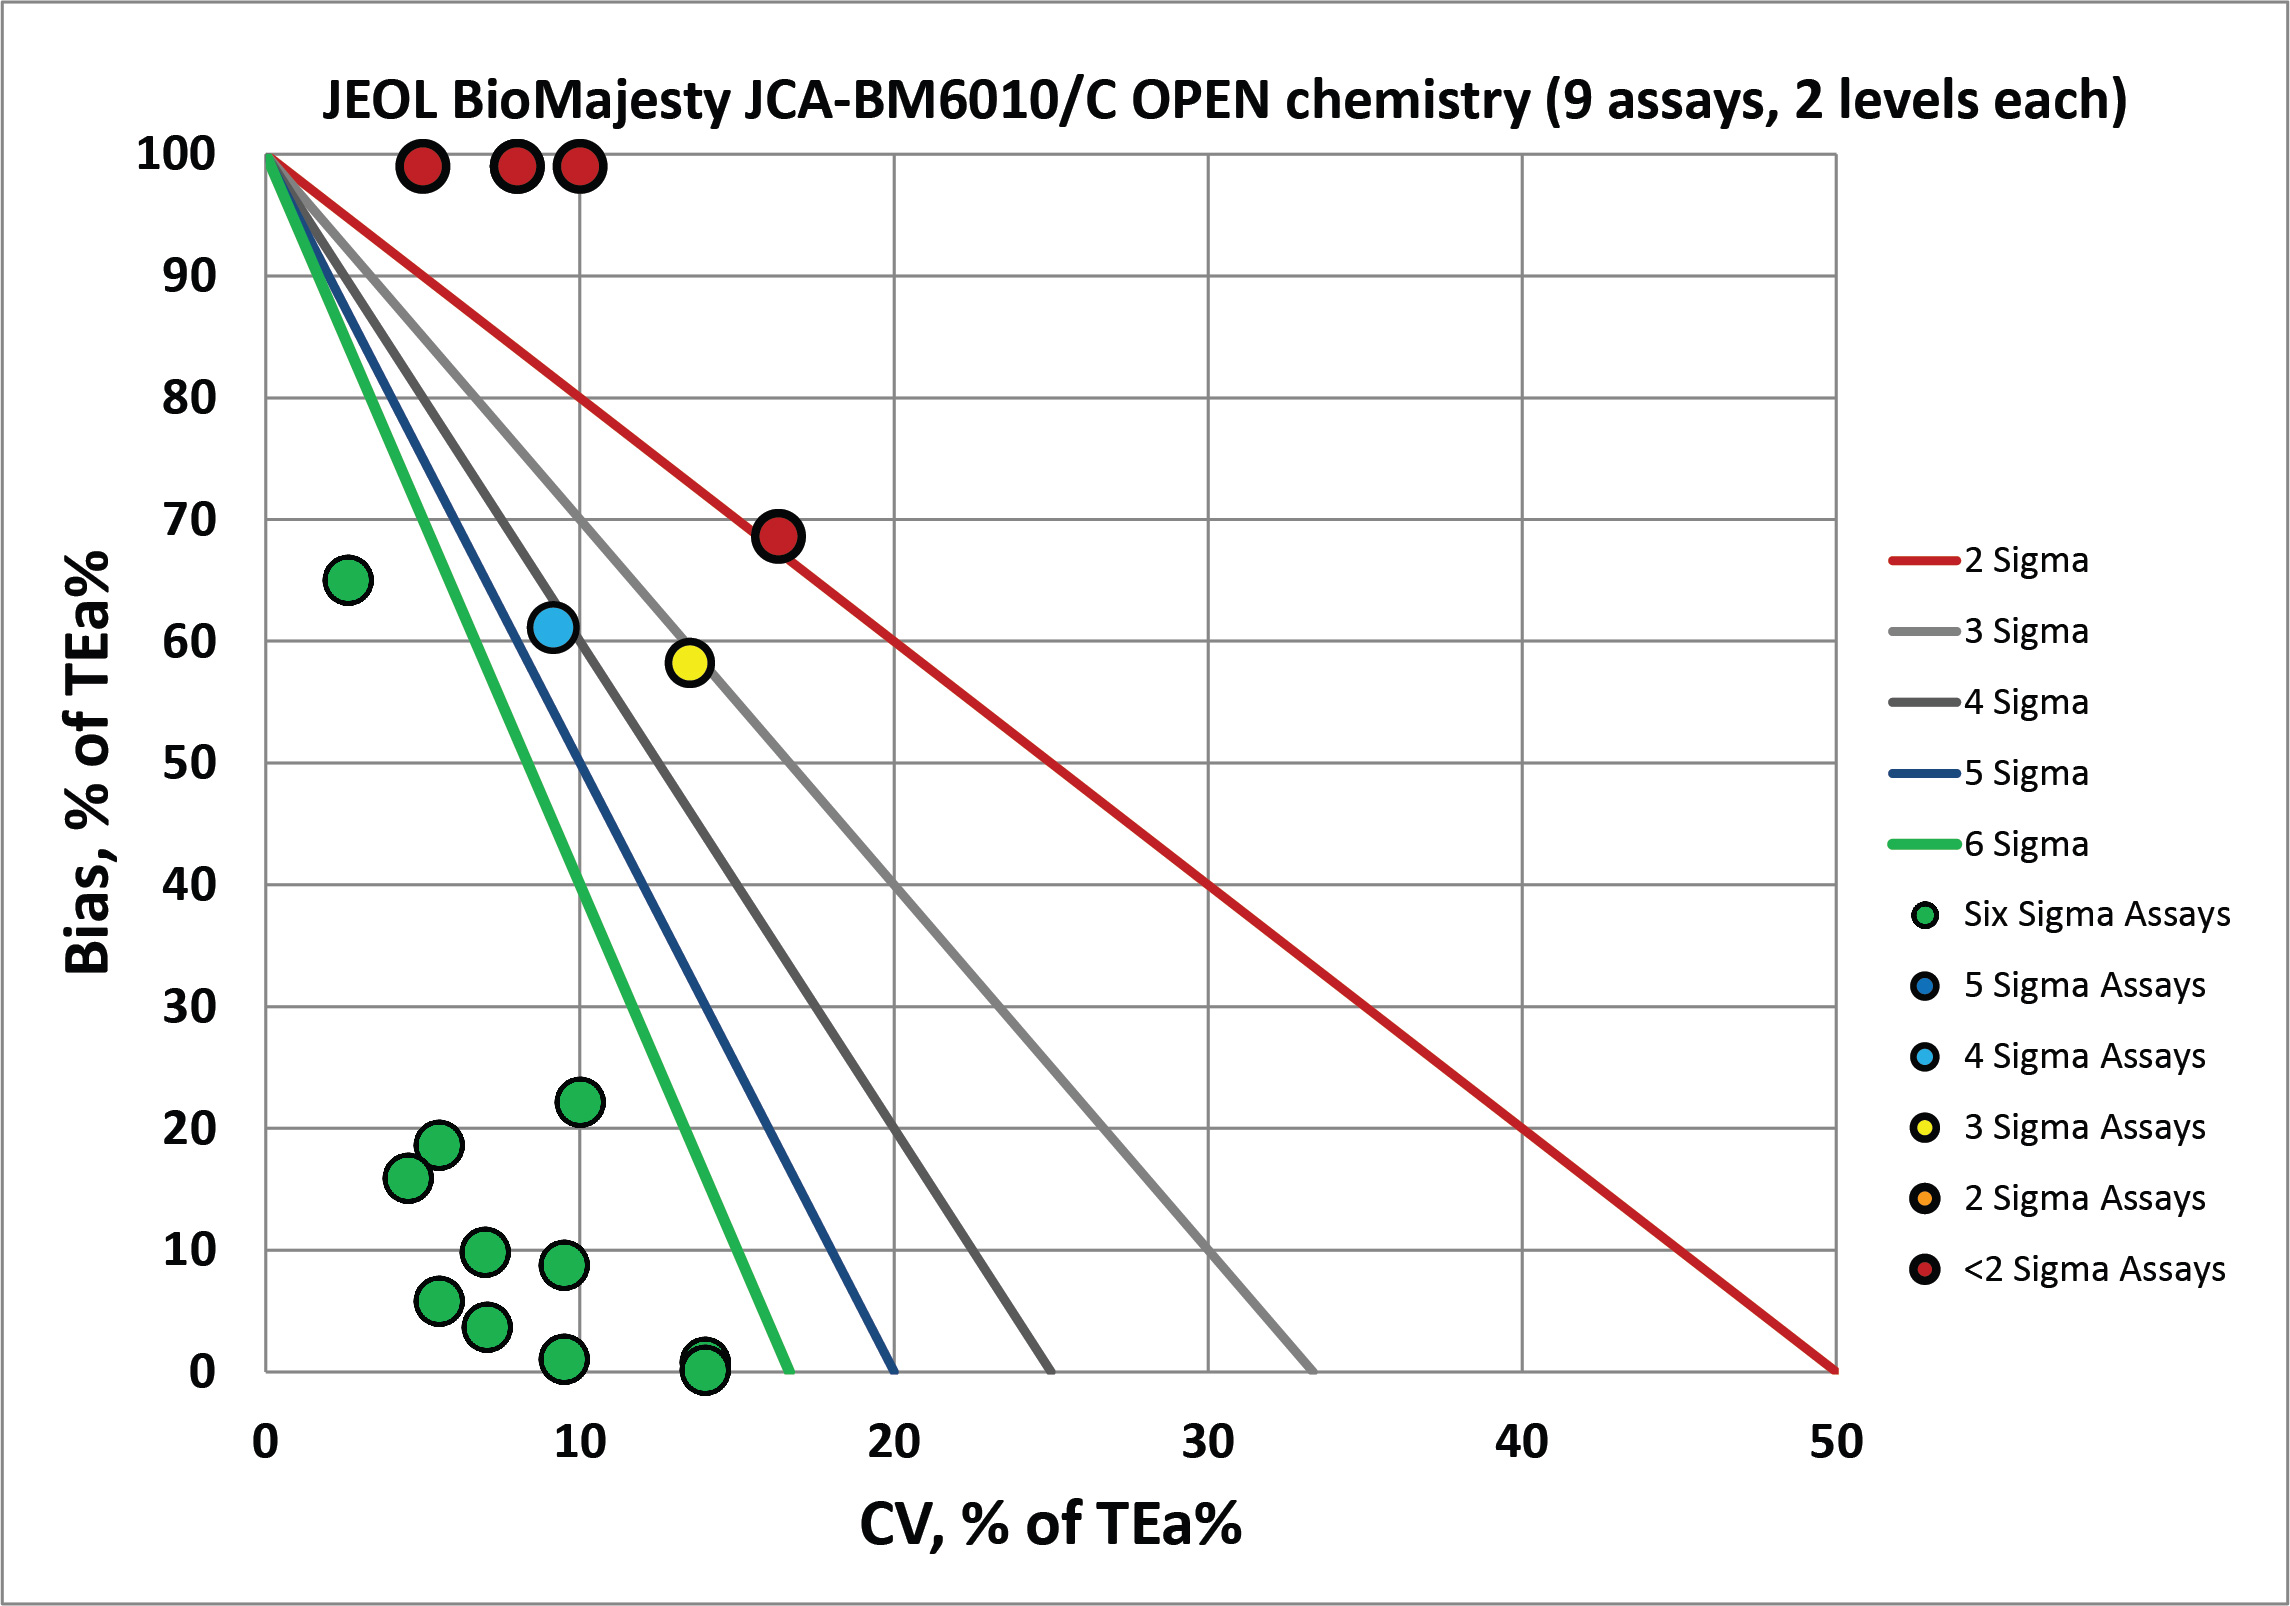
With the "open" reagents, there is an encouraging cluster of bull's-eyes, but the the few analytes with extreme bias are "off the charts".
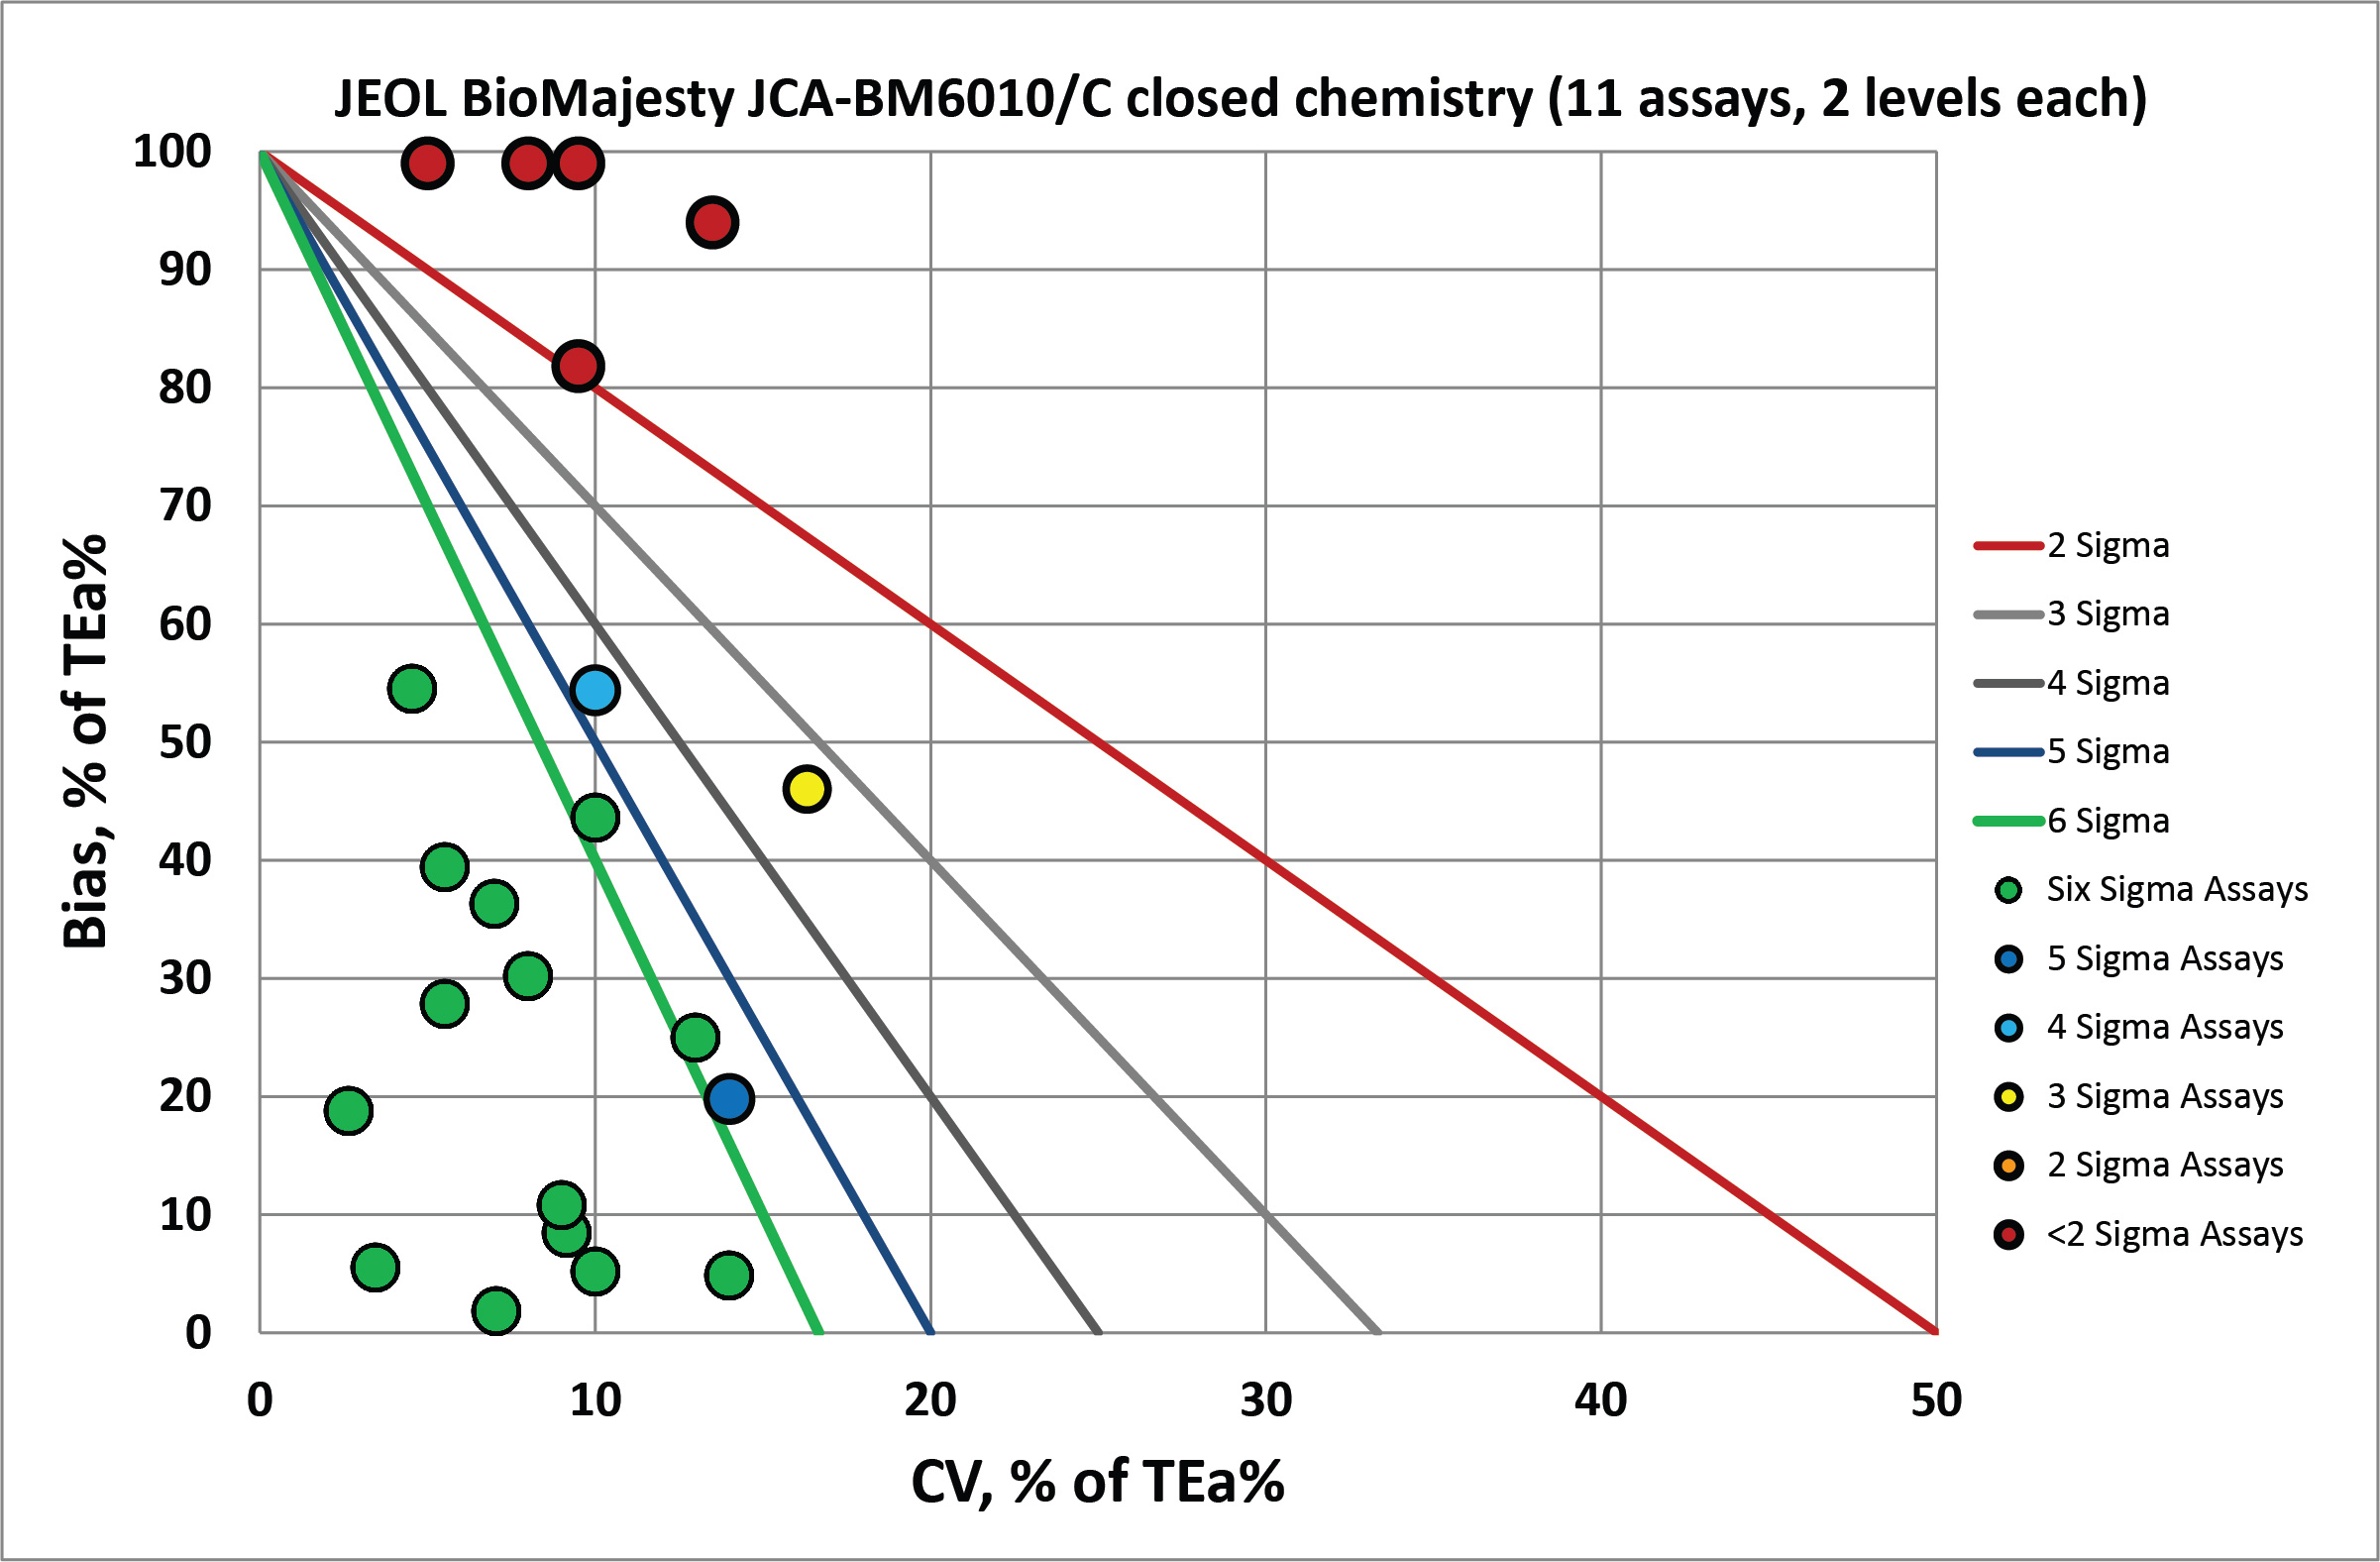
Since there are more analytes involved in the closed reagents, there are more bull's-eyes but also more extremely biased analytes that are off the charts.
Summary of QC Design by Normalized OPSpecs chart - using CLIA and Ricos Goals
The benefit of the Sigma-metric approach is that labs can do more than assess their quality, they can act on it. Using OPSpecs charts, they can actually optimize their QC procedures for each test.
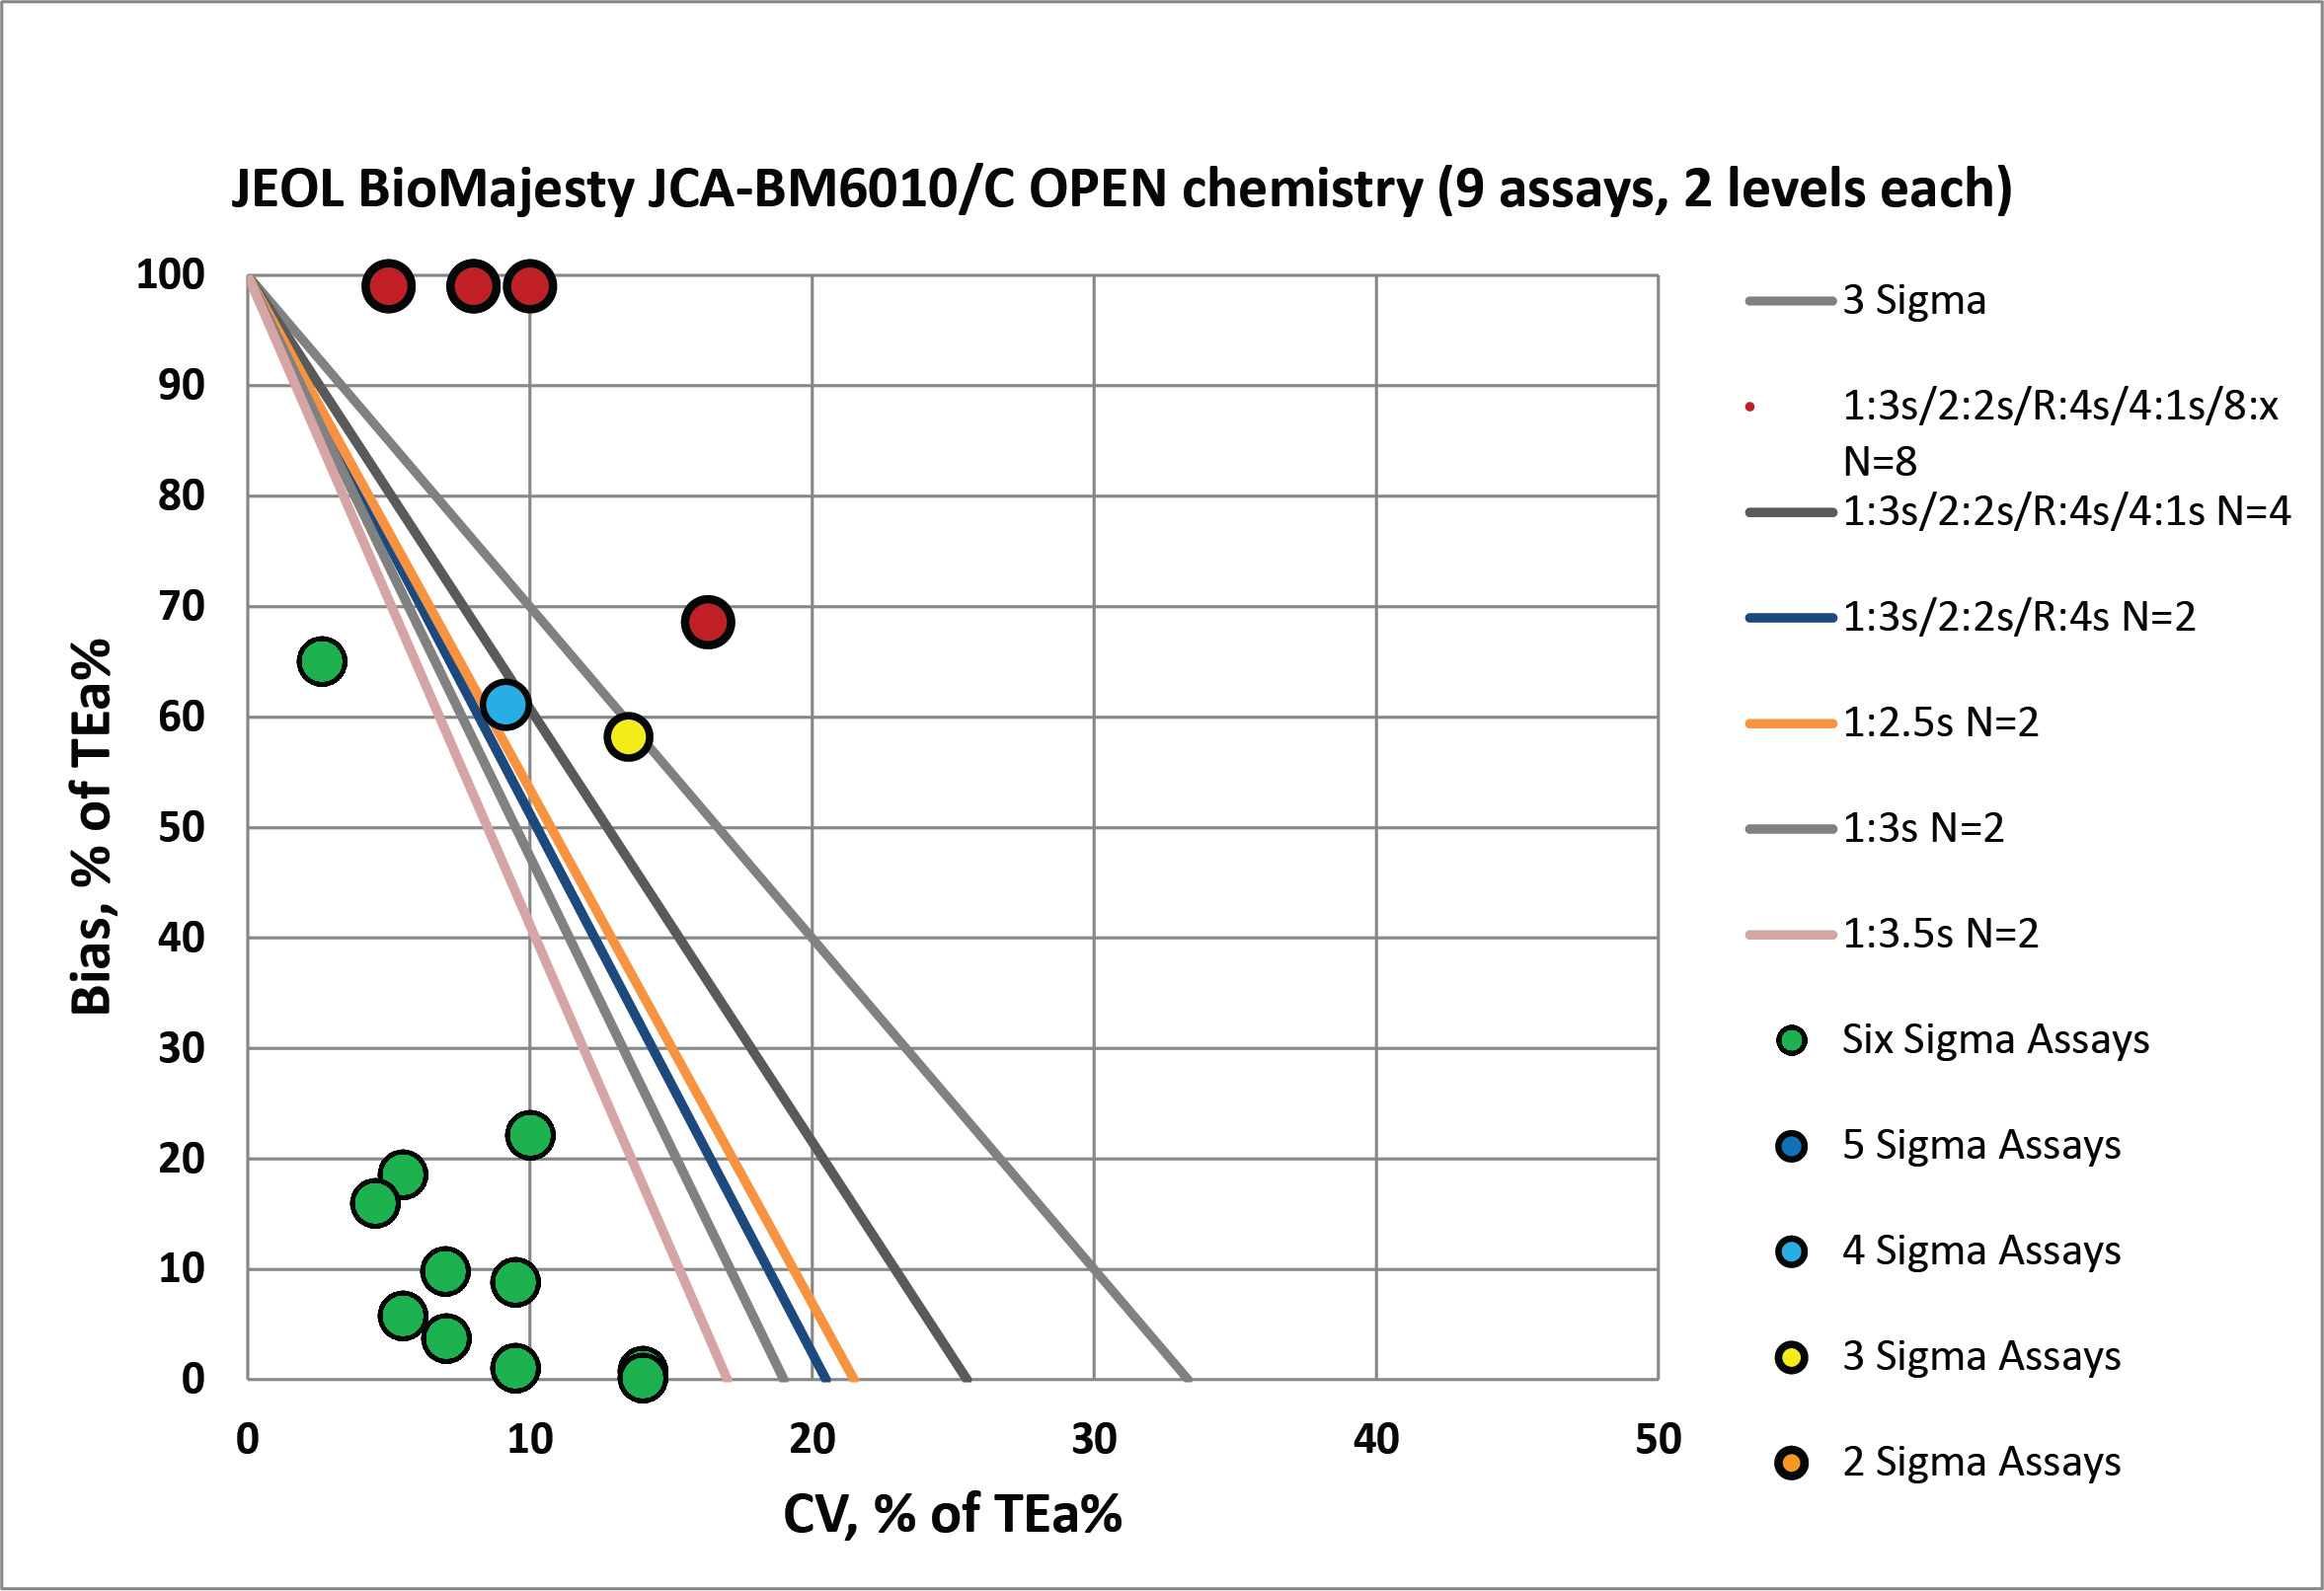
For the open reagents, all the green dots represent performance where control limits can be widened to 3.5 SD and only 2 controls are necessary. However, for the "off the charts" assays, all the "Westgard Rules" are going to be necessary, and many more control measurements should be made, perhaps 6 or even 9 per run. QC frequency should be much higher for those analytes, too. Not once a day, but many times per day - unless that bias can somehow be fixed. If this large bias is resolved, the QC rules needed will be pretty simple. But if the bias is real, then either a recalibration needs to occur, or a re-education of the clinician to a new reference interval, or a kind of "fudge factor" will have to be applied when reporting out. None of these options is desirable.
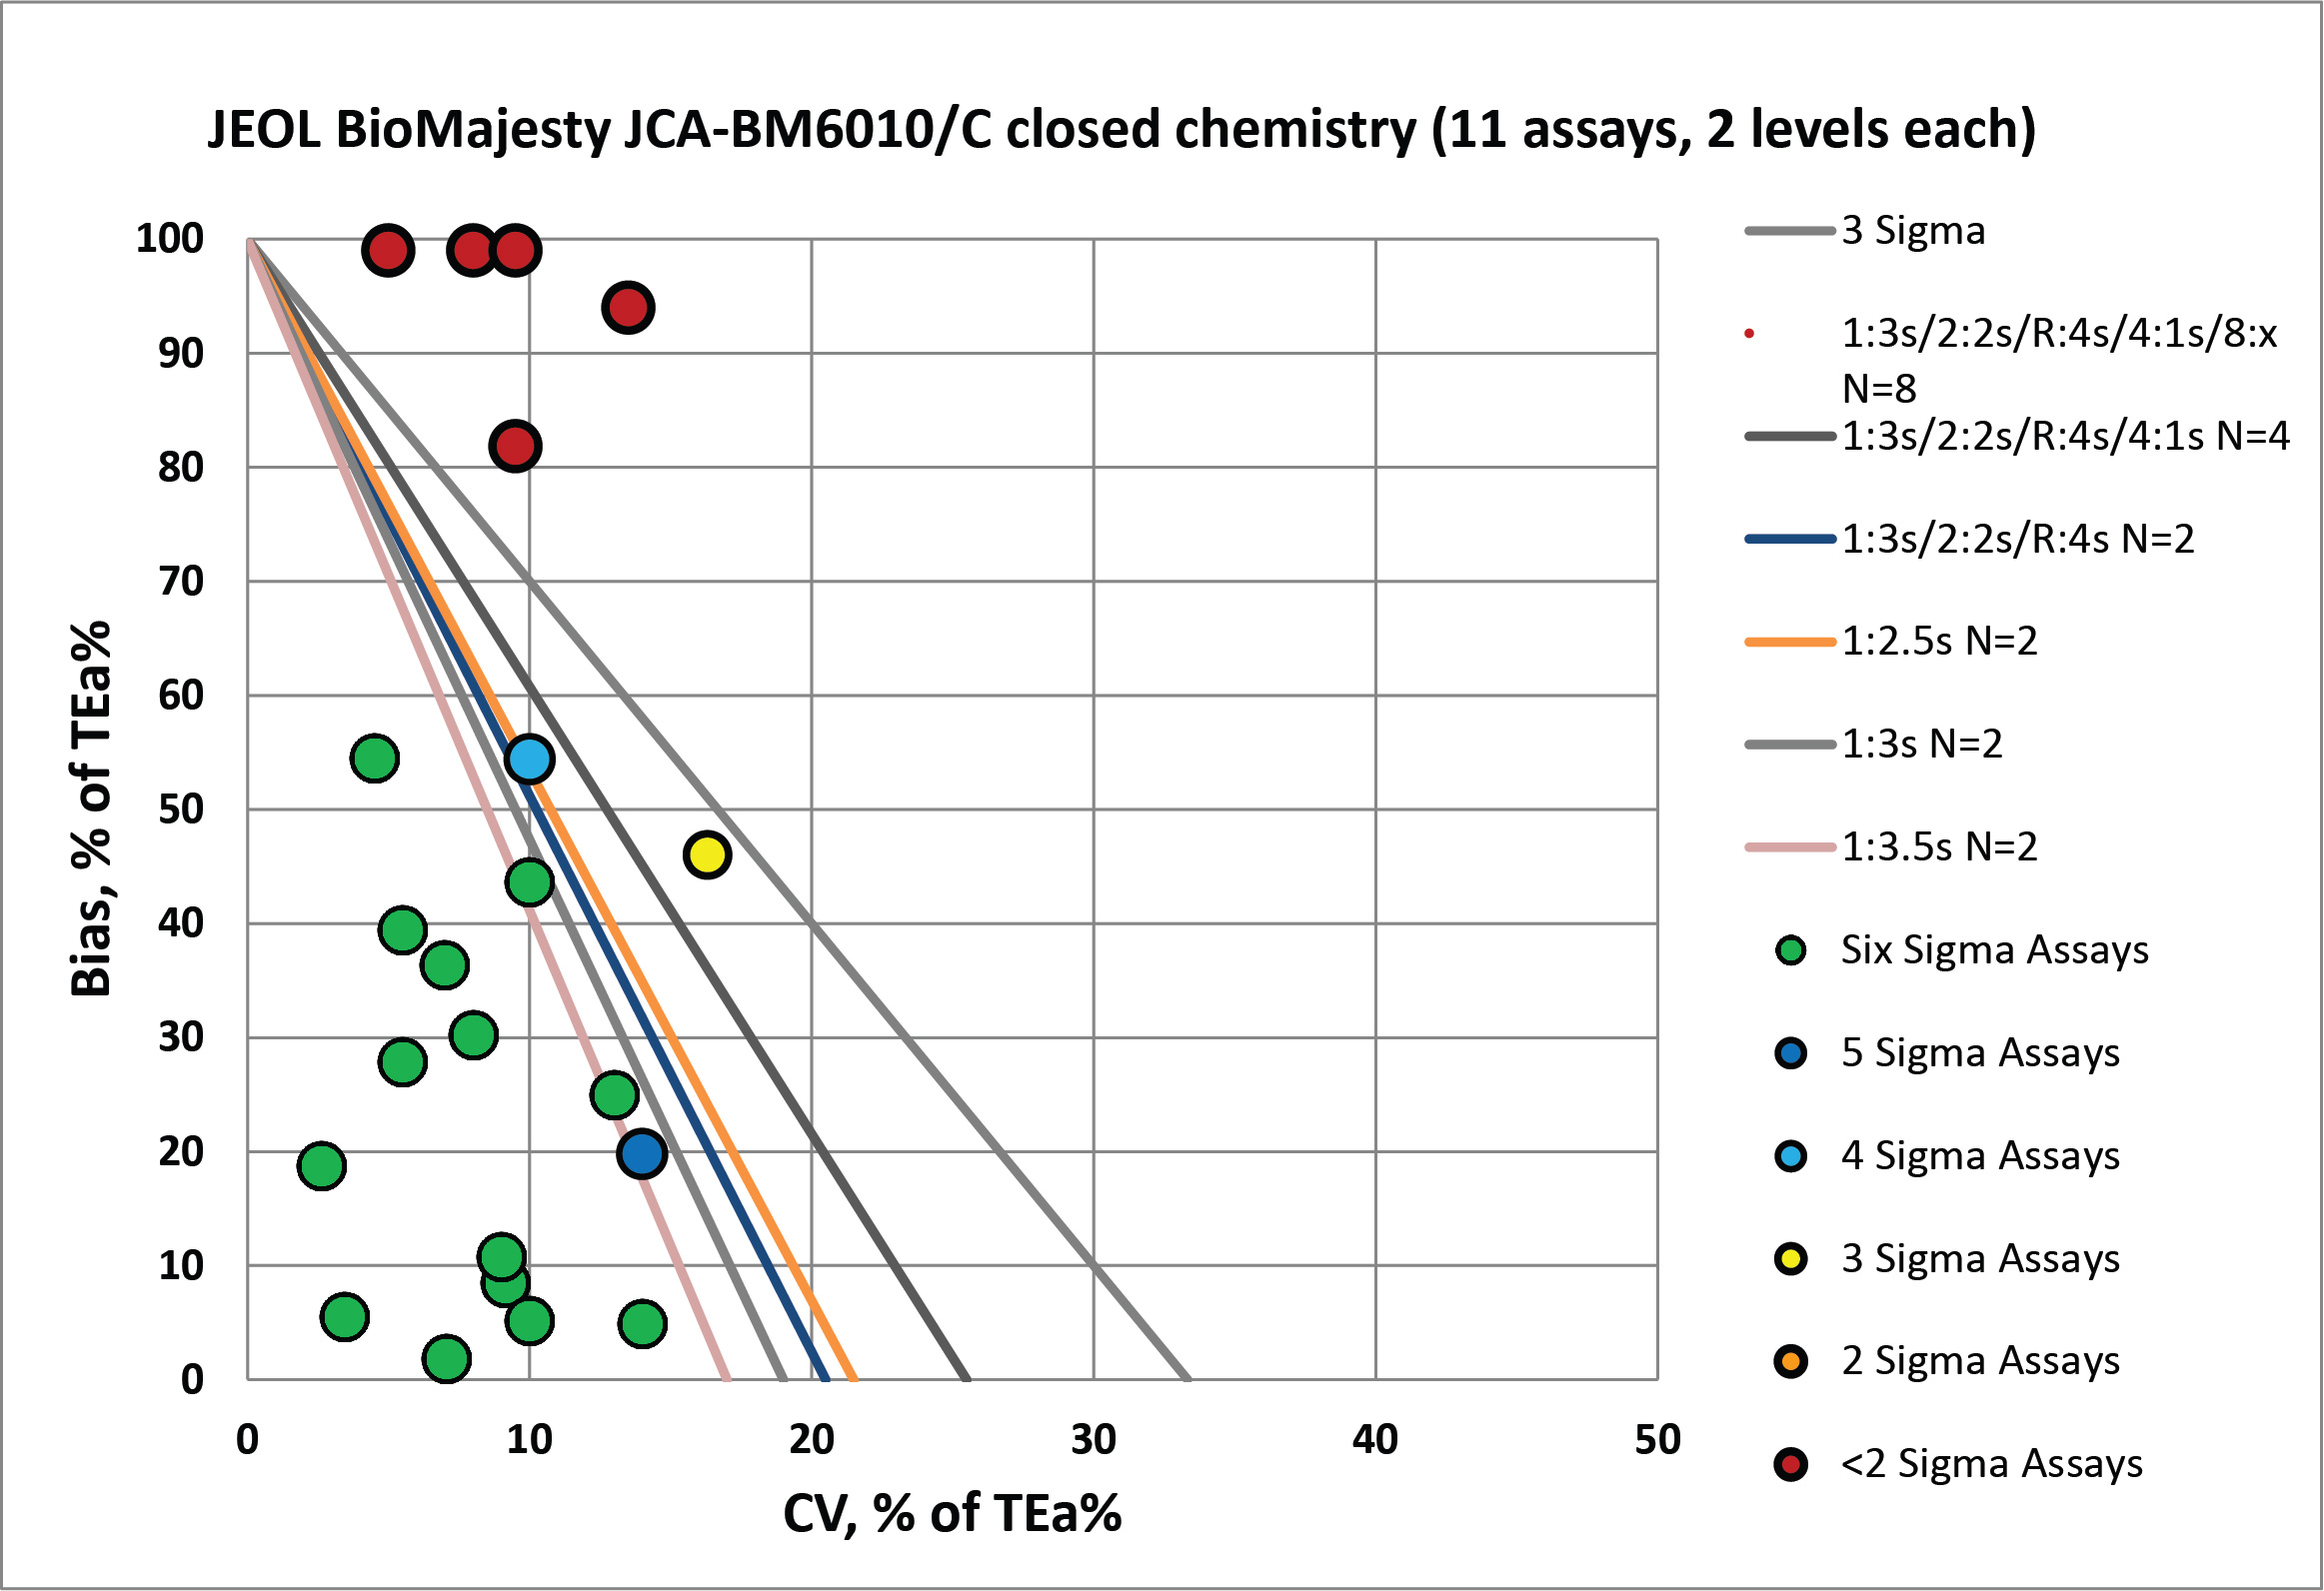
For the closed reagents, you can see there is more bias present in most of the assays, and there are more troublesome assays that need serious attention.
Conclusion
The authors stated "When the analysis was conducted using JEOL closed reagents, the results of JCA-BM6010/C strongly correlated with those of the Cobas 8000 as well as with those obtained using other open reagents.... In addition, JCA-BM6010/C showed acceptable mean difference by excluding analytes showing notable differences. It is suspected that the reason for this discrepancy was the difference in teh analytical method used for each reagent by the Roche and JEOL systems (ALP, IFCC/JSCC; calcium, OCPC/Phosphonazo III; creatinine, Jaffe/Enzymatic). JCA-BM6010/C yielded slightly higher values than the Cobas 8000 for GGT. In the second comparison using the open reagents, JCA-BM6010/C demonstrated an acceptable mean difference by excluding analytes showing notable differences; these could be attributed to the difference in analytical meethod for each open reagent (ALP, Roche, IFCC; calcium, Sekisui, Arsenazo III; creatinine, Roche, Jaffe; LDH, Denka Seiken, P-L)."
It's an interesting phrase, to find that all methods are acceptable, when you exclude the ones that aren't. If these method problems were so significant, probably a better comparative method should have been found. However, given the practical reality that there are a lot of Roche Cobas 8000 instruments out there, it's very significant to find that this new analyzer doesn't compare well with those results. That's going to be a problem that can't be overcome just by shrugging your shoulders - this is something that will need to be addressed by any lab that uses it.
The authors conclude, "JCA-BM6010/C showed excellent performance in terms of precision, linearity, correlation, accuracy, and sample carryover according to CLSI guidelines. JCA-BM6010/C is an ultra-compact analyzer with a wide AMR and shows comparable performance with that of other instruments. Therefore, JCA-BM6010/C is suitable for small laboratories, especially those with a small staff. We conclude that JCA-BM6010/C would be a useful routine chemistry analyzer in medical laboratories."
We do not reach the same conclusion. Despite the many assays that show Six Sigma performance on this instrument, the significant biases found on a few of these analytes are such that we would disagree. This analyzer needs improvements before all of its assays could be considered comparable and acceptable. If used in a laboratory, several analytes should be turned off.