Sigma Metric Analysis
Sigma metric Analysis of a Landwind LW D3600
A recent study assessed the performance of a new hematology analyzer, the Landwind LW D3600.
Sigma-metric Analysis of Landwind LW D3600
Sten Westgard, MS
July 2018
- The Precision, Comparison and Sigma-metric data
- Summary of Performance according to CLIA and Ricos Goals by Sigma-metrics Normalized Method Decision charts
- QC Implications of Sysmex XN Performance by Normalized OPSpecs chart
- Conclusion
[Note: This QC application is an extension of the lesson From Method Validation to Six Sigma: Translating Method Performance Claims into Sigma Metrics. This article assumes that you have read that lesson first, and that you are also familiar with the concepts of QC Design, Method Validation, and Six Sigma metrics. If you aren't, follow the link provided.]
Critical Systematic Errors in the Implementation and Follow-up of Performance in the Hematology Area: A Prospective Study. Critical Systematic Errors in the Implementation and Follow-up of Performance in the Hematology Area: A Prospective Study. Medicina Universitaria 2018;20(1):22-34. Jeel Moya-Salazar, Liz Pio-Davila.
The Imprecision, Bias and Sigma-metric Data
"The quality process was based on the evaluation of selected parameters during 19 days under the requirement guides CLSI EP-15 A2 and CLSI H26-A2. Before the beginning of the study, the system was calibrated under the maker's guidelines and an external quality control (data not shown). During the time of the study, control runs were conducted at the beginning of the work shift (12 h) 30 times before mixing the analysis tube. Each control level (low, normal, and high) was run in triplicate, obtaining an average value calculated by the auto hematology analyzer's software, which was established as a daily control value. no repetitions of controls were performed....
"The inaccurate results of the Auto hematology analyzer Landwind LW D3600 determined in this study when compared to the Samsung LABGEOHC10 hematology analyzer show that all the parameters disagree between the imprecision values (WBC, HB, MCV, MCH, and MCHC up to 4 times, RBC up to 8 times, and PLT up to 10 times more) in all levels of control. When we compare the results of the evaluation of the Sysmex XE-2100D analyzer (except HCT) and the Sysmex XE-2100 (except the erythrocyte indices), we observed that none of the hematological parameters showed agreement in the limits of imprecision determined in this study, evidencing a marked difference in performance between hematological analyzers."
Three levels of control performance were recorded. CV and Bias was listed in Table 2 of the paper:
| Landwind LW D3600 | |||||
| TEST | TEa Source | TEa | Level | % Bias | %CV |
| WBC | CLIA | 15.00 | 2.26 | 0.3 | 11.0 |
| WBC | 15% | 15.00 | 4.39 | 0.3 | 6.8 |
| WBC | 15% | 15.00 | 5.35 | 0.4 | 8.1 |
| RBC | CLIA | 6.00 | 1.93 | 0.2 | 8.4 |
| RBC | 6% | 6.00 | 7.04 | 0.7 | 10.1 |
| RBC | 6% | 6.00 | 17 | 1.2 | 7.3 |
| Hemoglobin | CLIA | 7.00 | 53.46 | 5.52 | 10.3 |
| Hemoglobin | 7% | 7.00 | 121.49 | 11.89 | 9.8 |
| Hemoglobin | 7% | 7.00 | 168.28 | 16.21 | 9.6 |
| Hematocrit | CLIA | 6.00 | 17.33 | 2.0 | 11.2 |
| Hematocrit | 6 | 6.00 | 36.57 | 3.5 | 9.5 |
| Hematocrit | 6% | 6.00 | 49.67 | 4.8 | 9.6 |
| MCV | Span Min | 7.00 | 71.80 | 1.6 | 2.2 |
| MCV | 7.00% | 7.00 | 83.00 | 1.5 | 1.8 |
| MCV | 7 | 7.00 | 92.70 | 2.1 | 2.2 |
| MCH | Span Min | 5.00 | 22.10 | 0.9 | 4.0 |
| MCH | 5 | 5.00 | 27.6 | 1.0 | 3.6 |
| MCH | 5 | 5.00 | 31.1 | 1.2 | 3.8 |
| MCHC | ESFEQA | 7.00 | 308.6 | 13.6 | 4.4 |
| MCHC | 7% | 7.00 | 333 | 12.0 | 3.6 |
| MCHC | 7 | 7.00 | 337.1 | 12.6 | 3.8 |
| PLT-I | CLIA | 25 | 114.43 | 35.5 | 31.1 |
| PLT-I | 25 | 25.00 | 257.72 | 31.3 | 12.1 |
| PLT-I | 25% | 25.00 | 515.26 | 31.5 | 6.1 |
Yes, that is a whole lot of numbers!
Nevertheless, what do all these numbers mean? In the absence of context, it's hard to know.
So let's calculate the Sigma-metrics.
Sigma-metric calculations for the Landwind
Remember the equation for Sigma metric is (TEa - bias) / CV:
For a 15% quality requirement, for WBC on the low level of the Landwind LW D3600, the equation is (15 - 0.3) / 11.0 = 1.34
For a 15% quality requirement, for WBC on the middle level of the Landwind LW D3600, the equation is (15 - 0.3) / 6.8 = 2.18
The metrics are displayed along the right columns.
| Landwind LW D3600 | ||||||
| TEST | TEa Source | TEa | Level | % Bias | %CV | Sigma |
| WBC | CLIA | 15.00 | 2.26 | 0.3 | 11.0 | 1.34 |
| WBC | 15% | 15.00 | 4.39 | 0.3 | 6.8 | 2.18 |
| WBC | 15% | 15.00 | 5.35 | 0.4 | 8.1 | 1.80 |
| RBC | CLIA | 6.00 | 1.93 | 0.2 | 8.4 | 0.69 |
| RBC | 6% | 6.00 | 7.04 | 0.7 | 10.1 | 0.53 |
| RBC | 6% | 6.00 | 17 | 1.2 | 7.3 | 0.65 |
| Hemoglobin | CLIA | 7.00 | 53.46 | 5.52 | 10.3 | 0.1 |
| Hemoglobin | 7% | 7.00 | 121.49 | 11.89 | 9.8 | -0.5 |
| Hemoglobin | 7% | 7.00 | 168.28 | 16.21 | 9.6 | -1.0 |
| Hematocrit | CLIA | 6.00 | 17.33 | 2.0 | 11.2 | 0.4 |
| Hematocrit | 6 | 6.00 | 36.57 | 3.5 | 9.5 | 0.3 |
| Hematocrit | 6% | 6.00 | 49.67 | 4.8 | 9.6 | 0.1 |
| MCV | Span Min | 7.00 | 71.80 | 1.6 | 2.2 | 2.5 |
| MCV | 7.00% | 7.00 | 83.00 | 1.5 | 1.8 | 3.1 |
| MCV | 7 | 7.00 | 92.70 | 2.1 | 2.2 | 2.2 |
| MCH | Span Min | 5.00 | 22.10 | 0.9 | 4.0 | 1.0 |
| MCH | 5 | 5.00 | 27.6 | 1.0 | 3.6 | 1.1 |
| MCH | 5 | 5.00 | 31.1 | 1.2 | 3.8 | 1.0 |
| MCHC | ESFEQA | 7.00 | 308.6 | 13.6 | 4.4 | -1.5 |
| MCHC | 7% | 7.00 | 333 | 12.0 | 3.6 | -1.4 |
| MCHC | 7 | 7.00 | 337.1 | 12.6 | 3.8 | -1.5 |
| PLT-I | CLIA | 25 | 114.43 | 35.5 | 31.1 | -0.3 |
| PLT-I | 25 | 25.00 | 257.72 | 31.3 | 12.1 | -0.5 |
| PLT-I | 25% | 25.00 | 515.26 | 31.5 | 6.1 | -1.1 |
Yes, there are a lot of low and negative Sigma-metrics. Negative Sigma is unusual, reflecting a situation when the bias completely exceeds the allowable total error.
Summary of Performance by Sigma-metrics Method Decision Chart using CLIA and Ricos Goals
We can make visual assessments of this performance using a Normalized Sigma-metric Method Decision Chart:
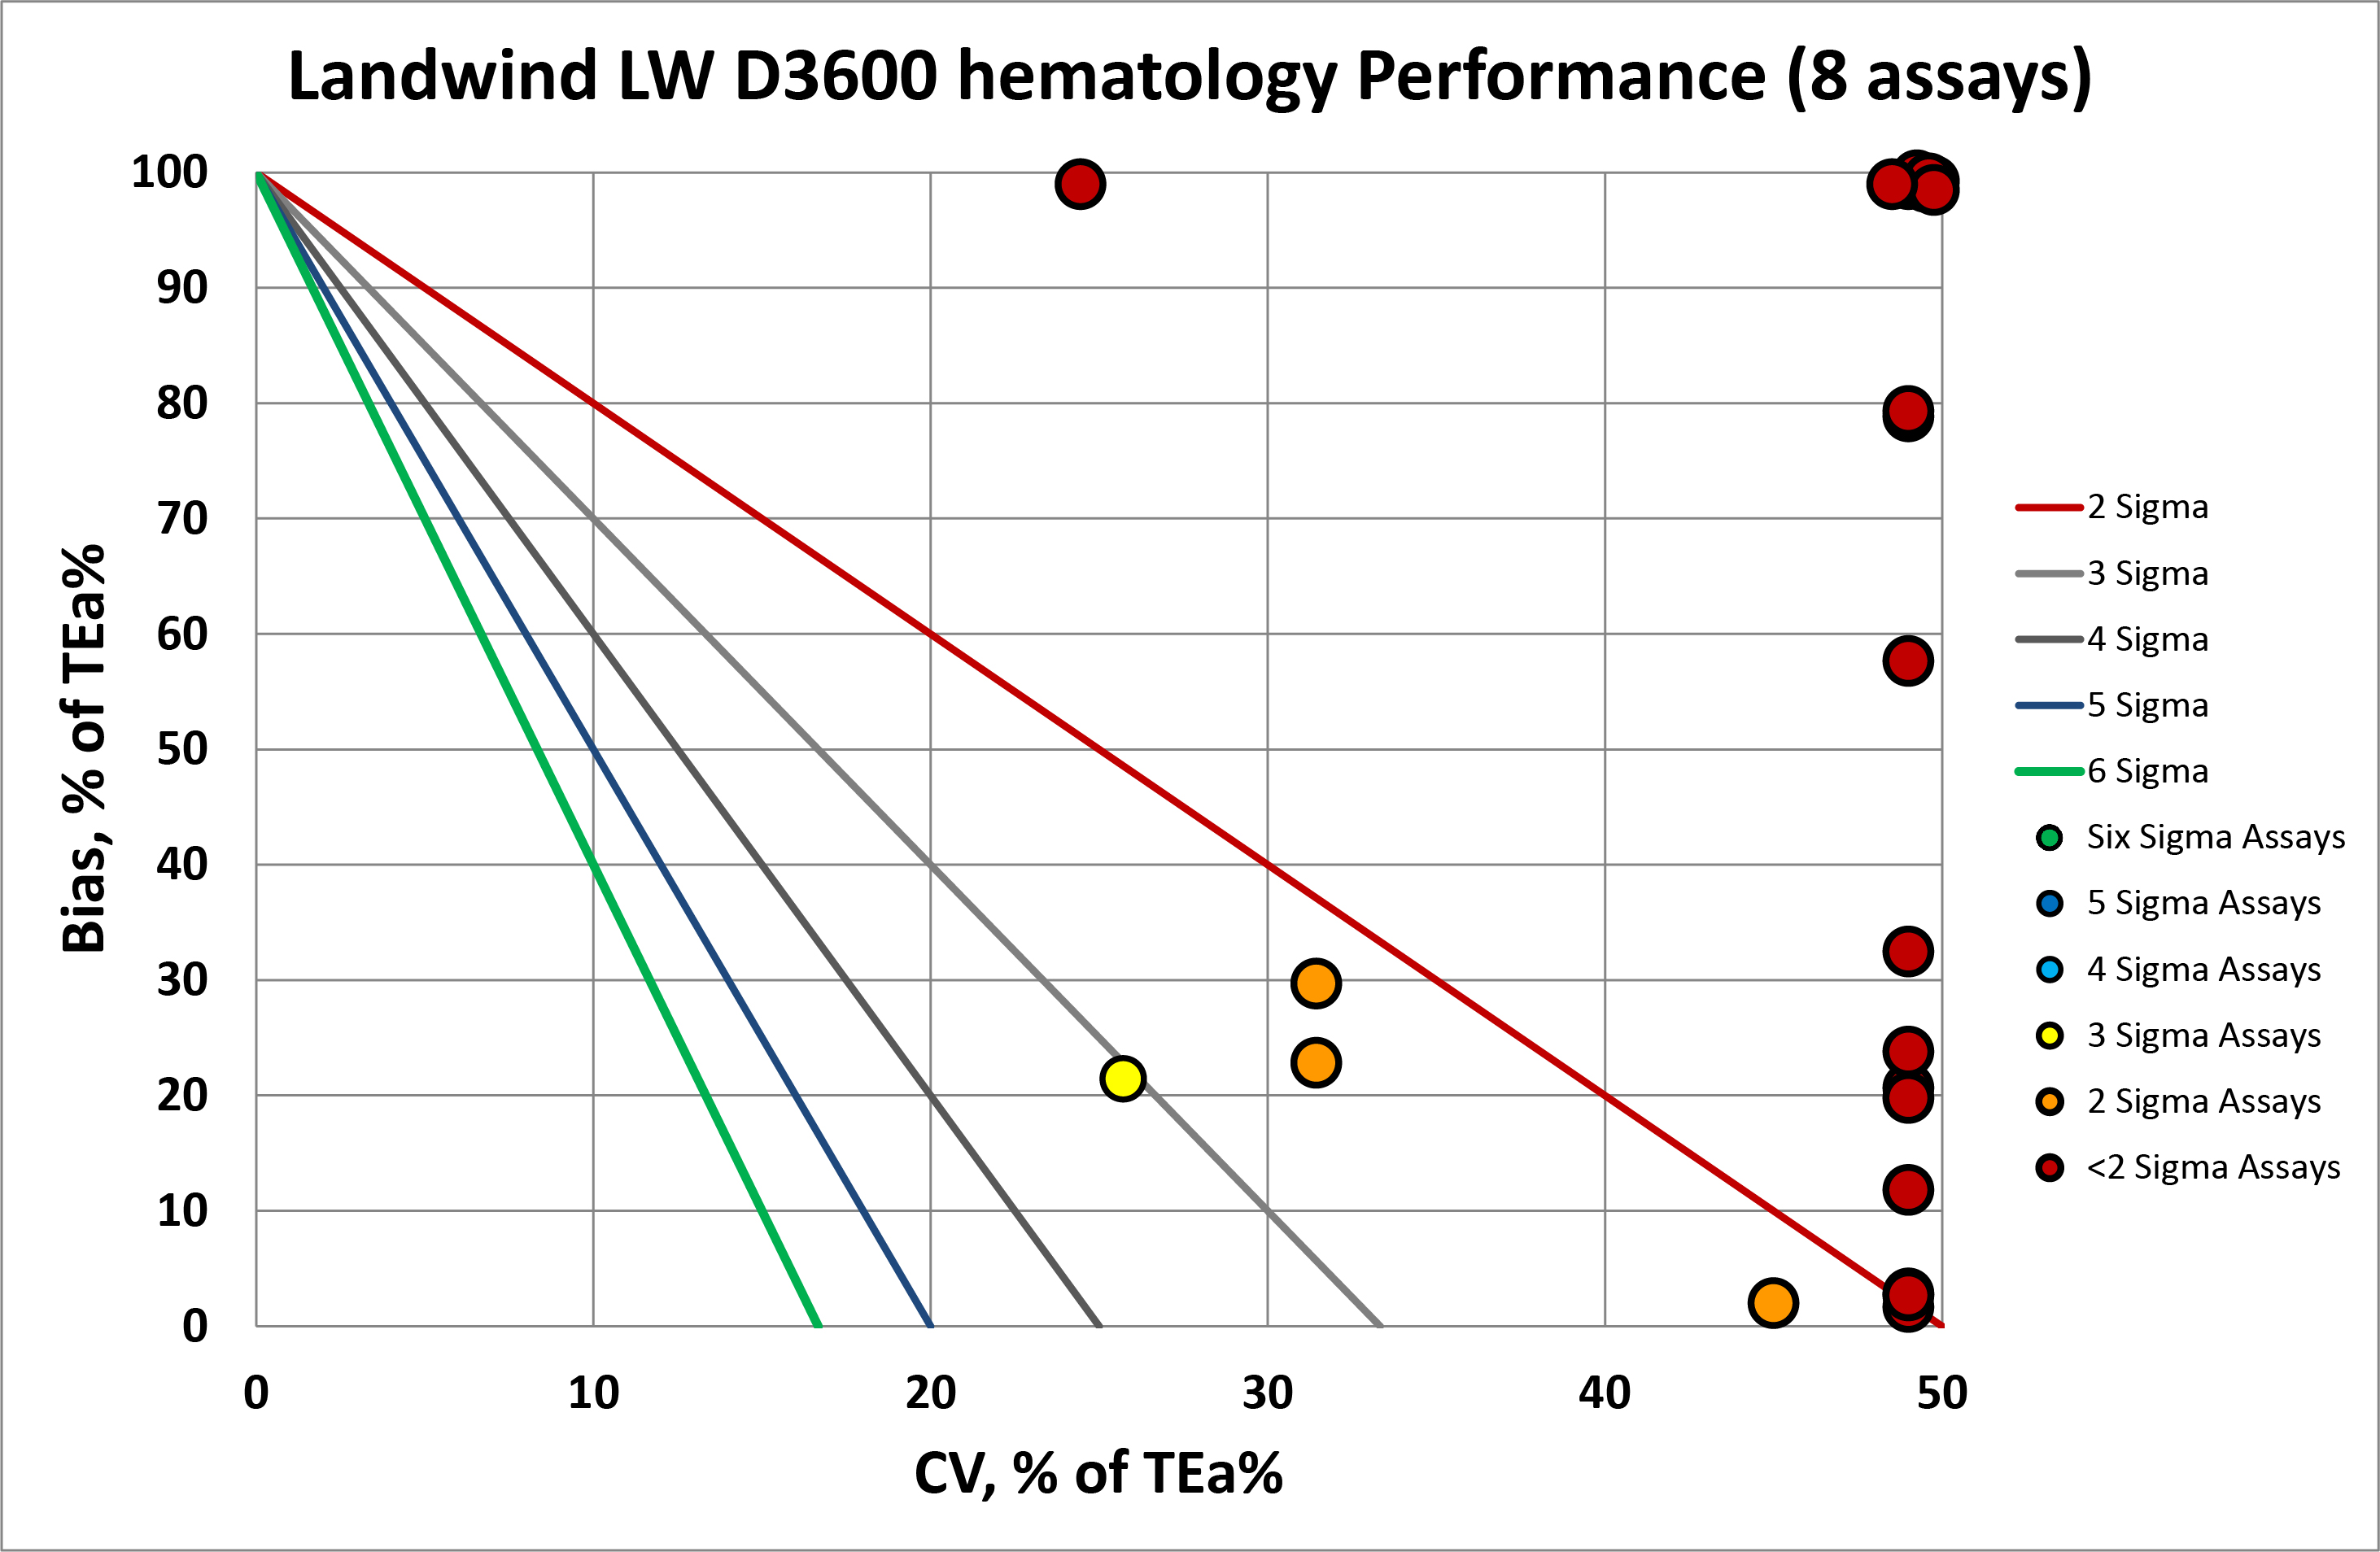
Overall, you can see that most of the x-coordinates (or imprecision) are on the right side of the graph, in fact they are really "off the chart" to the right if we plotted them where they should be, which is a very bad sign. There are also problems occurring at the bias level. Any points that you see tucked at the top edge of the graph are "off the charts" in the vertical axis, because of the significant bias which exceed the allowable total error. Many have both more than the allowable bias and more than the allowable imprecision.
Summary of QC Design by Normalized OPSpecs chart - using CLIA and Ricos Goals
The benefit of the Sigma-metric approach is that labs can do more than assess their quality, they can act on it. Using OPSpecs charts, they can actually optimize their QC procedures for each test. In this case, they can use the data to try and mitigate the risk of poor performance.
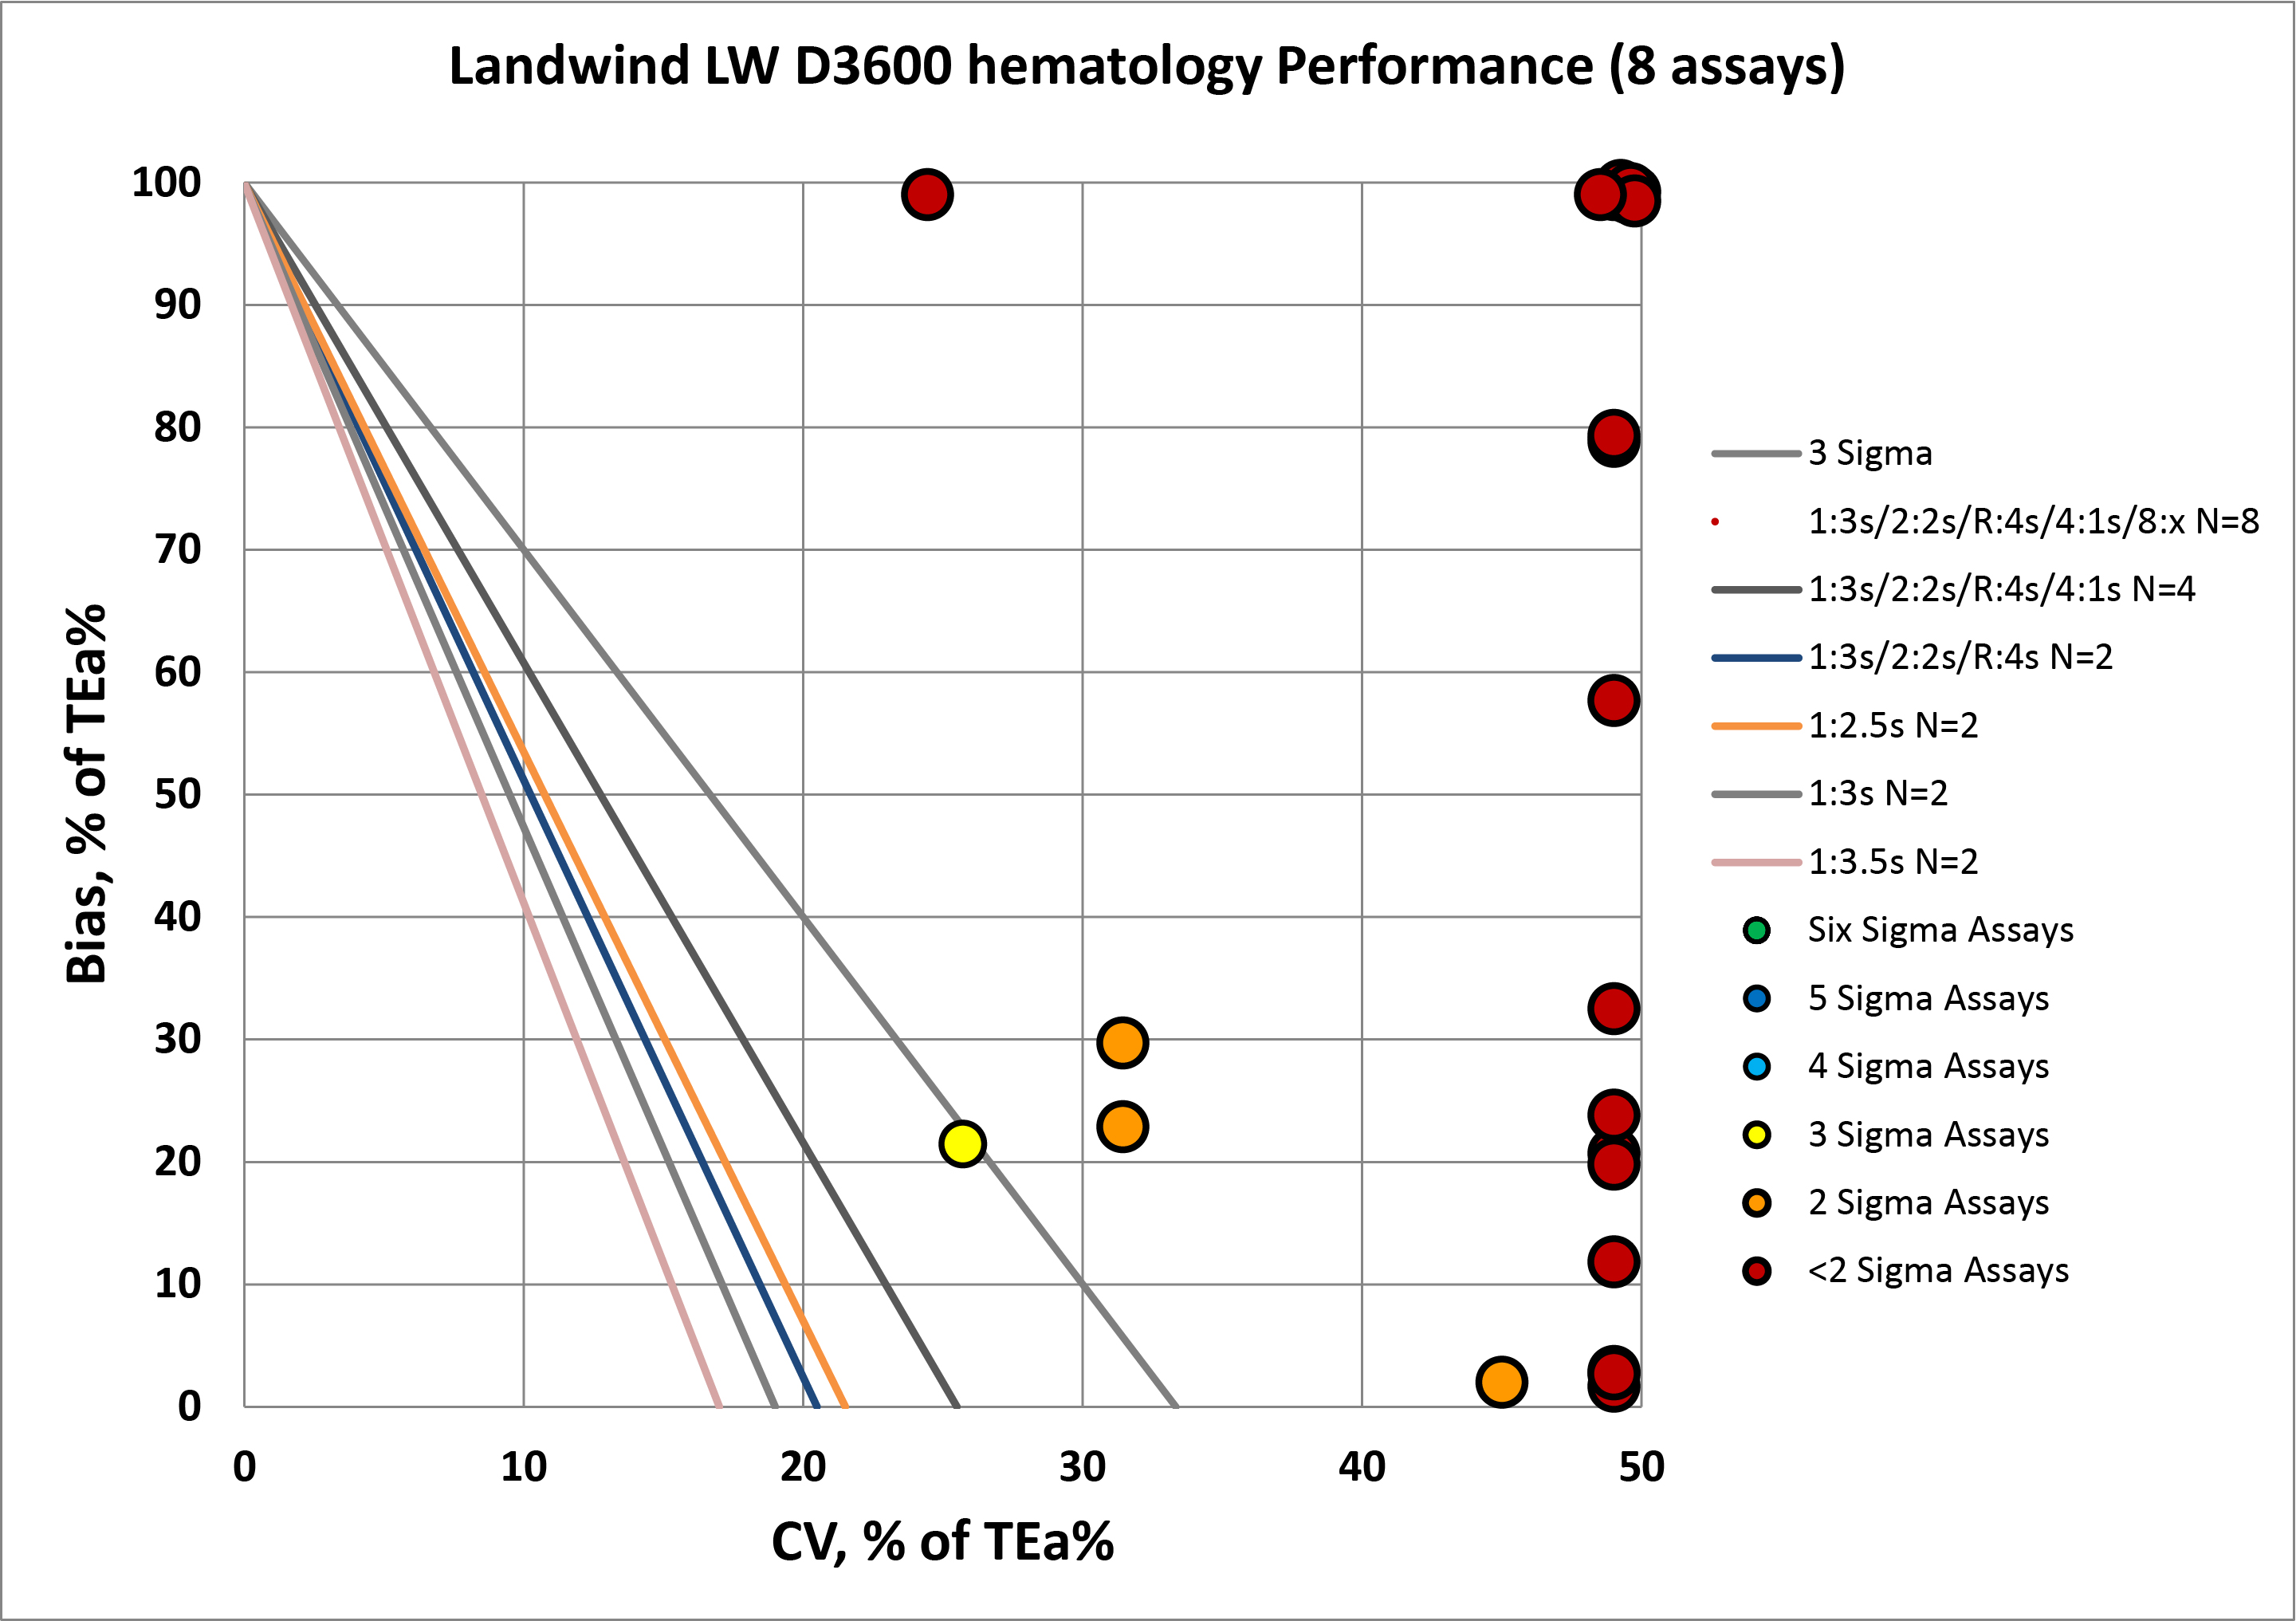
For virtually every assay, there is no statistical quality control procedure that can help. There aren't enough "Westgard rules" to keep these methods in control.
Conclusion
The authors stated "The quality evaluation under the [systematic error] analysis showed a heterogeneous performance of eight hematological parameters and between the intra-parameter control levels in the Landwind LW D3600 analyzer. We also determined > 90 infractions of the Westgard rules and mismatches in the determination of means (calculated and automatic) in 1368 trials in Lima, Peru.
"Although the controls were outside the limits of one or more parameters, patient samples were analyzed, threatening health security and generating uncertain results. These could have medically important errors that affect the patient's health."
For once, we don't have anything to add to the authors' conclusions. The performance of this instrument demonstrates the practical challenges of managing instruments with less than world class quality. And refutes the oft-held assumption that whenever a new instrument is introduced, it's automatically an improvement on the existing instruments in the market.