Sigma Metric Analysis
Sigma metric analysis of a Suzuka chemistry analyzer
A recent study assessed the performance of a Randox Suzuka autoanalyzer in India.
Sigma-metric Analysis of a Suzuka Autoanalyzer in India
Sten Westgard, MS
January 2018
- The Precision, Comparison and Sigma-metric data
- Summary of Performance according to CLIA and Ricos Goals by Sigma-metrics Normalized Method Decision charts
- QC Implications of Suzuka Performance by Normalized OPSpecs chart
- Conclusion
[Note: This QC application is an extension of the lesson From Method Validation to Six Sigma: Translating Method Performance Claims into Sigma Metrics. This article assumes that you have read that lesson first, and that you are also familiar with the concepts of QC Design, Method Validation, and Six Sigma metrics. If you aren't, follow the link provided.]
Assessment of quality control system by sigma metrics and quality goal index ratio: A roadmap towards preparation for NABL, Monica Verma, Kiran Dahiya, Veena Singh Ghalaut, Vasudha Dhupper, World J Methodol 2018 November 29; 8(3): 44-50.
The Imprecision, Bias and Sigma-metric Data
"As per laboratory policy, two levels of controls (level 2: normal and level 3: pathological, Randox Laboratories Limited) were run twice daily along with monthly EQAS lyophilized sample obtained from Christian Medical College, Vellore throughout the study period....Mean, SD and coefficient of variance (CV) were calculated for each month for both levels. The laboratory receives EQAS sample in three batches of four samples every year. The sample was reconstituted and analyzed the same day. All the EQAS samples were handled as routine patient samples and were analyzed by the senior lab technician on duty...."
Two levels of average control performance were recorded in Table 1 and Table 2 of the paper, and average Bias over a 1 year period was recorded in Table 3 of the paper. We condense that data here:
| 2018 India Randox Suzuka Data | ||||
| TEST | TEa Source | TEa | % Bias | CV |
| Albumin | CLIA | 10 | 8.3 | 2.1 |
| Albumin | 10% | 10 | 8.3 | 2.0 |
| Alk Phos | CLIA | 30 | 2.6 | 3.3 |
| Alk Phos | 30% | 30 | 2.6 | 2.8 |
| ALT | EFLM 17 | 14.4 | 12.7 | 4.8 |
| ALT | 14% | 14.4 | 12.7 | 3.2 |
| Amylase | CLIA | 30.00 | 9.7 | 4.2 |
| Amylase | 30% | 30.00 | 9.7 | 3.3 |
| AST | EFLM 17 | 13.4 | 13.2 | 4.8 |
| AST | 13% | 13.4 | 13.2 | 3.1 |
| Bilirubin, Total | CLIA 20% or | 20.00 | 1.4 | 3.7 |
| Bilirubin, Total | 0.4 mg/dL -20 here | 20.00 | 1.4 | 2.8 |
| Calcium | CLIA | 12 | 3.2 | 2.5 |
| Calcium | 1 mg/dL | 12 | 3.2 | 2.4 |
| Cholesterol | CLIA | 10 | 5.1 | 2.9 |
| Cholesterol | 10% | 10 | 5.1 | 2.7 |
| Creatinine | CLIA 15% or | 15.00 | 8.0 | 5.4 |
| Creatinine | 0.3 mg/dL -15 here | 15.00 | 8.0 | 3.2 |
| Glucose | CLIA 10% or | 10.00 | 3.7 | 2.7 |
| Glucose | 6 mg/dL -10 here | 10.00 | 3.7 | 2.0 |
| HDL | CLIA | 30.00 | 17.4 | 3.7 |
| HDL | 30% | 30.00 | 17.4 | 3.6 |
| Phosphorous | CAP 10.7% or | 10.70 | 14.0 | 4.9 |
| Phosphorous | 0.3 mg/dL | 10.70 | 14.0 | 3.3 |
| Protein, Total | CAP | 10.00 | 6.7 | 3.0 |
| Protein, Total | 10% | 10.00 | 6.7 | 3.1 |
| Triglycerides | CLIA | 25.00 | 7.4 | 4.7 |
| Triglycerides | 25% | 25.00 | 7.4 | 3.0 |
| Urea Nitrogen | CLIA 9% or | 9.00 | 2.9 | 4.2 |
| Urea Nitrogen | 2.0 mg/dL - fixed 9 | 9.00 | 2.9 | 3.4 |
| Uric Acid | CLIA | 17.00 | 12.2 | 3.2 |
| Uric Acid | 17% | 17.00 | 12.2 | 2.6 |
Yes, that is a whole lot of numbers!
Nevertheless, what do all these numbers mean? In the absence of context, it's hard to know.
So let's calculate the Sigma-metrics.
Sigma-metric calculations for the Suzuka
Remember the equation for Sigma metric is (TEa - bias) / CV:
For a 10% quality requirement, for Albumin on the normal level of Suzuka, the equation is (10 - 8.3) / 2.1 = 0.8
For a 30% quality requirement, for Alkaline Phosphatase on the normal level of Suzuka, the equation is (30 - 2.6) / 3.3 = 8.4, greater than 6 Sigma
The metrics are displayed along the right column.
| 2018 India Randox Suzuka Data | |||||
| TEST | TEa Source | TEa | % Bias | CV | Sigma |
| Albumin | CLIA | 10 | 8.3 | 2.1 | 0.8 |
| Albumin | 10% | 10 | 8.3 | 2.0 | 0.8 |
| Alk Phos | CLIA | 30 | 2.6 | 3.3 | 8.4 |
| Alk Phos | 30% | 30 | 2.6 | 2.8 | 10.0 |
| ALT | EFLM 17 | 14.4 | 12.7 | 4.8 | 0.4 |
| ALT | 14% | 14.4 | 12.7 | 3.2 | 0.5 |
| Amylase | CLIA | 30.00 | 9.7 | 4.2 | 4.9 |
| Amylase | 30% | 30.00 | 9.7 | 3.3 | 6.1 |
| AST | EFLM 17 | 13.4 | 13.2 | 4.8 | 0.0 |
| AST | 13% | 13.4 | 13.2 | 3.1 | 0.1 |
| Bilirubin, Total | CLIA 20% or | 20.00 | 1.4 | 3.7 | 5.1 |
| Bilirubin, Total | 0.4 mg/dL -20 here | 20.00 | 1.4 | 2.8 | 6.7 |
| Calcium | CLIA | 12 | 3.2 | 2.5 | 3.5 |
| Calcium | 1 mg/dL | 12 | 3.2 | 2.4 | 3.7 |
| Cholesterol | CLIA | 10 | 5.1 | 2.9 | 1.7 |
| Cholesterol | 10% | 10 | 5.1 | 2.7 | 1.8 |
| Creatinine | CLIA 15% or | 15.00 | 8.0 | 5.4 | 1.3 |
| Creatinine | 0.3 mg/dL -15 here | 15.00 | 8.0 | 3.2 | 2.2 |
| Glucose | CLIA 10% or | 10.00 | 3.7 | 2.7 | 2.31 |
| Glucose | 6 mg/dL -10 here | 10.00 | 3.7 | 2.0 | 3.11 |
| HDL | CLIA | 30.00 | 17.4 | 3.7 | 3.4 |
| HDL | 30% | 30.00 | 17.4 | 3.6 | 3.5 |
| Phosphorous | CAP 10.7% or | 10.70 | 14.0 | 4.9 | negative |
| Phosphorous | 0.3 mg/dL | 10.70 | 14.0 | 3.3 | negative |
| Protein, Total | CAP | 10.00 | 6.7 | 3.0 | 1.1 |
| Protein, Total | 10% | 10.00 | 6.7 | 3.1 | 1.1 |
| Triglycerides | CLIA | 25.00 | 7.4 | 4.7 | 3.7 |
| Triglycerides | 25% | 25.00 | 7.4 | 3.0 | 5.8 |
| Urea Nitrogen | CLIA 9% or | 9.00 | 2.9 | 4.2 | 1.4 |
| Urea Nitrogen | 2.0 mg/dL - fixed 9 | 9.00 | 2.9 | 3.4 | 1.8 |
| Uric Acid | CLIA | 17.00 | 12.2 | 3.2 | 1.5 |
| Uric Acid | 17% | 17.00 | 12.2 | 2.6 | 1.8 |
Yes, there are a lot of lower Sigma-metrics. Both imprecision and inaccuracy are too blame. CVs are high and biases are high. In one test, the bias actually is larger than the allowable total error, hence a negative Sigma-metric. There are a few high Sigma-metrics, but the majority of the numbers are below 3 Sigma, which is typically considered the minimum acceptable performance. (Note that for AST and ALT, we used a tougher criteria than CLIA.)
Summary of Performance by Sigma-metrics Method Decision Chart using CLIA and Ricos Goals
We can make visual assessments of this performance using a Normalized Sigma-metric Method Decision Chart:
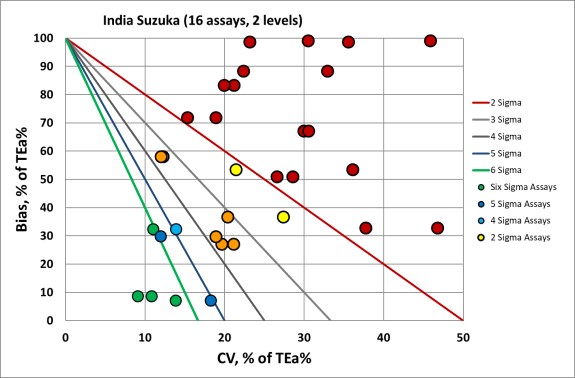
Overall, you can see that many of the x-coordinates (or imprecision) are on the right side of the graph, and there is a lot of bias as well. This is a not a great sign. So the problem for all the analytes here is both imprecision and inaccuracy.
Summary of QC Design by Normalized OPSpecs chart - using CLIA and Ricos Goals
The benefit of the Sigma-metric approach is that labs can do more than assess their quality, they can act on it. Using OPSpecs charts, they can actually optimize their QC procedures for each test. In this case, they can use the data to try and mitigate the risk of poor performance.
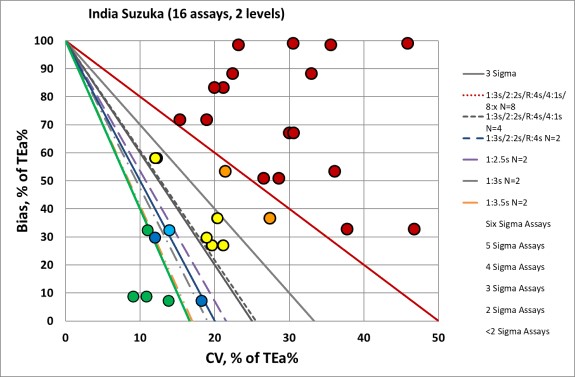
For most of these assays, all the "Westgard Rules" are necessary, and more than 2 controls are needed - more like 4 or 8 control measurements per run. This would be too expensive for most labs anywhere in the world. For those analytes which are "off the charts", there aren't enough "Westgard Rules" to keep these methods in control.
Conclusion
The authors stated "On the basis of Sigma metrics and QGI [Quality Goal Index], it may be concluded that the Clinical Biochemistry Laboratory. PGIMS, Rohtak was able to achieve satisfactory results with world class performance for many analytes one year preceding the NABL accreditation as per ISO standard 15189:2012."
Given the evidence of Sigma-metric analysis, there is little reason to call this performance satisfactory. With both Imprecision and Inaccuracy problematic, the next steps that are needed are to determine if this is a laboratory-specific problem or an instrument-specific problem. While this performance may be good enough to pass ISO 15189:2012 and NABL standards, that's still not good enough for patients.