Sigma Metric Analysis
Erba EM 360 autoanalyser Sigma-metric analysis
A recent 2018 study assessed the performance of an Erba EM 360 chemistry analyzer in India.
Sigma-metric Analysis of an Erba EM 360 in India
Sten Westgard, MS
January 2019
- The Precision, Comparison and Sigma-metric data
- Summary of Performance according to CLIA and Ricos Goals by Sigma-metrics Normalized Method Decision charts
- QC Implications of EM 360 Performance by Normalized OPSpecs chart
- Conclusion
[Note: This QC application is an extension of the lesson From Method Validation to Six Sigma: Translating Method Performance Claims into Sigma Metrics. This article assumes that you have read that lesson first, and that you are also familiar with the concepts of QC Design, Method Validation, and Six Sigma metrics. If you aren't, follow the link provided.]
Implementation of sigma metrics for evaluation of analytical quality in clinical biochemistry laboratory of a tertiary care hospital. Choudhury JR, Banerjee S, Chakraborty I. J. Evolution Med. Dent. Sci. 2018;7(21):2539-2542, DOI: 10.14260/jemds/2018/571.
The Imprecision, Bias and Sigma-metric Data
"Study material used were internal quality control material, External quality control material, QC data from EM360 autoanalyser software. Various parameters that were scrutinised are sugar, urea creatinine, Triglyceride, cholesterol, HDL, Bilirubin, SGOT, SGPT, ALP, total protein, albumin and uric acid.
Results of both levels of internal quality control (Normal L1 and High L2) were recorded.
Bias % is calculated from External Quality Assurance Scheme (EQAS) with the formula: Bias%= [(Our lab result - Peer group mean) / (Peer group mean)]*100.
CV% is calculated from Internal Quality Control (IQC) data with the formula CV%= (SD/Mean) x 100...."
CV and Bias were recorded in Table 1. We condense that data here:
| 2018 India EM 360 Data | ||||
| TEST | TEa Source | TEa | % Bias | CV |
| Albumin | CLIA | 10 | 0.7 | 2.8 |
| Albumin | 10% | 10 | 0.7 | 2.8 |
| Alk Phos | CLIA | 30 | 0.5 | 4.1 |
| Alk Phos | 30% | 30 | 0.5 | 3.5 |
| ALT | EFLM 17 | 14.4 | 0.6 | 9.2 |
| ALT | 14% | 14.4 | 0.6 | 5.1 |
| AST | EFLM 17 | 13.4 | 0.4 | 7.2 |
| AST | 13% | 13.4 | 0.4 | 4.8 |
| Bilirubin, Total | CLIA 20% or | 20.00 | 0.4 | 5.6 |
| Bilirubin, Total | 0.4 mg/dL -20 here | 20.00 | 0.4 | 3.9 |
| Cholesterol | CLIA | 10 | 0.5 | 3.0 |
| Cholesterol | 10% | 10 | 0.5 | 3.2 |
| Creatinine | CLIA 15% or | 15.00 | 0.6 | 4.9 |
| Creatinine | 0.3 mg/dL -15 here | 15.00 | 0.6 | 3.5 |
| Glucose | CLIA 10% or | 10.00 | 0.2 | 3.2 |
| Glucose | 6 mg/dL -10 here | 10.00 | 0.2 | 3.2 |
| HDL | CLIA | 30.00 | 0.4 | 3.3 |
| HDL | 30% | 30.00 | 0.4 | 4.2 |
| Protein, Total | CAP | 10.00 | 0.4 | 2.8 |
| Protein, Total | 10% | 10.00 | 0.4 | 3.1 |
| Triglycerides | CLIA | 25.00 | 0.3 | 4.5 |
| Triglycerides | 25% | 25.00 | 0.3 | 3.1 |
| Urea Nitrogen | CLIA 9% or | 9.00 | 0.2 | 3.0 |
| Urea Nitrogen | 2.0 mg/dL - fixed 9 | 9.00 | 0.2 | 2.8 |
| Uric Acid | CLIA | 17.00 | 0.4 | 3.5 |
| Uric Acid | 17% | 17.00 | 0.4 | 2.9 |
Yes, that is a whole lot of numbers!
Nevertheless, what do all these numbers mean? In the absence of context, it's hard to know.
So let's calculate the Sigma-metrics.
Sigma-metric calculations for the Erba EM 360
Remember the equation for Sigma metric is (TEa - bias) / CV:
For a 10% quality requirement, for Albumin on the normal level of EM 360, the equation is (10 - 0.7) / 2.8 = 3.3
For a 30% quality requirement, for Alkaline Phosphatase on the normal level of EM 360, the equation is (30 - 0.5) / 4.1 = 7.2, greater than 6 Sigma
The Sigma-metrics are displayed along the right column:
| 2018 India EM 360 Data | |||||
| TEST | TEa Source | TEa | % Bias | CV | Sigma |
| Albumin | CLIA | 10 | 0.7 | 2.8 | 3.3 |
| Albumin | 10% | 10 | 0.7 | 2.8 | 3.3 |
| Alk Phos | CLIA | 30 | 0.5 | 4.1 | 7.2 |
| Alk Phos | 30% | 30 | 0.5 | 3.5 | 8.4 |
| ALT | EFLM 17 | 14.4 | 0.6 | 9.2 | 1.5 |
| ALT | 14% | 14.4 | 0.6 | 5.1 | 2.7 |
| AST | EFLM 17 | 13.4 | 0.4 | 7.2 | 1.8 |
| AST | 13% | 13.4 | 0.4 | 4.8 | 2.7 |
| Bilirubin, Total | CLIA 20% or | 20.00 | 0.4 | 5.6 | 3.5 |
| Bilirubin, Total | 0.4 mg/dL -20 here | 20.00 | 0.4 | 3.9 | 5.1 |
| Cholesterol | CLIA | 10 | 0.5 | 3.0 | 3.2 |
| Cholesterol | 10% | 10 | 0.5 | 3.2 | 3.0 |
| Creatinine | CLIA 15% or | 15.00 | 0.6 | 4.9 | 2.9 |
| Creatinine | 0.3 mg/dL -15 here | 15.00 | 0.6 | 3.5 | 4.1 |
| Glucose | CLIA 10% or | 10.00 | 0.2 | 3.2 | 3.05 |
| Glucose | 6 mg/dL -10 here | 10.00 | 0.2 | 3.2 | 3.05 |
| HDL | CLIA | 30.00 | 0.4 | 3.3 | 9.0 |
| HDL | 30% | 30.00 | 0.4 | 4.2 | 7.0 |
| Protein, Total | CAP | 10.00 | 0.4 | 2.8 | 3.4 |
| Protein, Total | 10% | 10.00 | 0.4 | 3.1 | 3.1 |
| Triglycerides | CLIA | 25.00 | 0.3 | 4.5 | 5.5 |
| Triglycerides | 25% | 25.00 | 0.3 | 3.1 | 8.1 |
| Urea Nitrogen | CLIA 9% or | 9.00 | 0.2 | 3.0 | 2.9 |
| Urea Nitrogen | 2.0 mg/dL - fixed 9 | 9.00 | 0.2 | 2.8 | 3.1 |
| Uric Acid | CLIA | 17.00 | 0.4 | 3.5 | 4.7 |
| Uric Acid | 17% | 17.00 | 0.4 | 2.9 | 5.7 |
Summary of Performance by Sigma-metrics Method Decision Chart using CLIA and Ricos Goals
We can make visual assessments of this performance using a Normalized Sigma-metric Method Decision Chart:
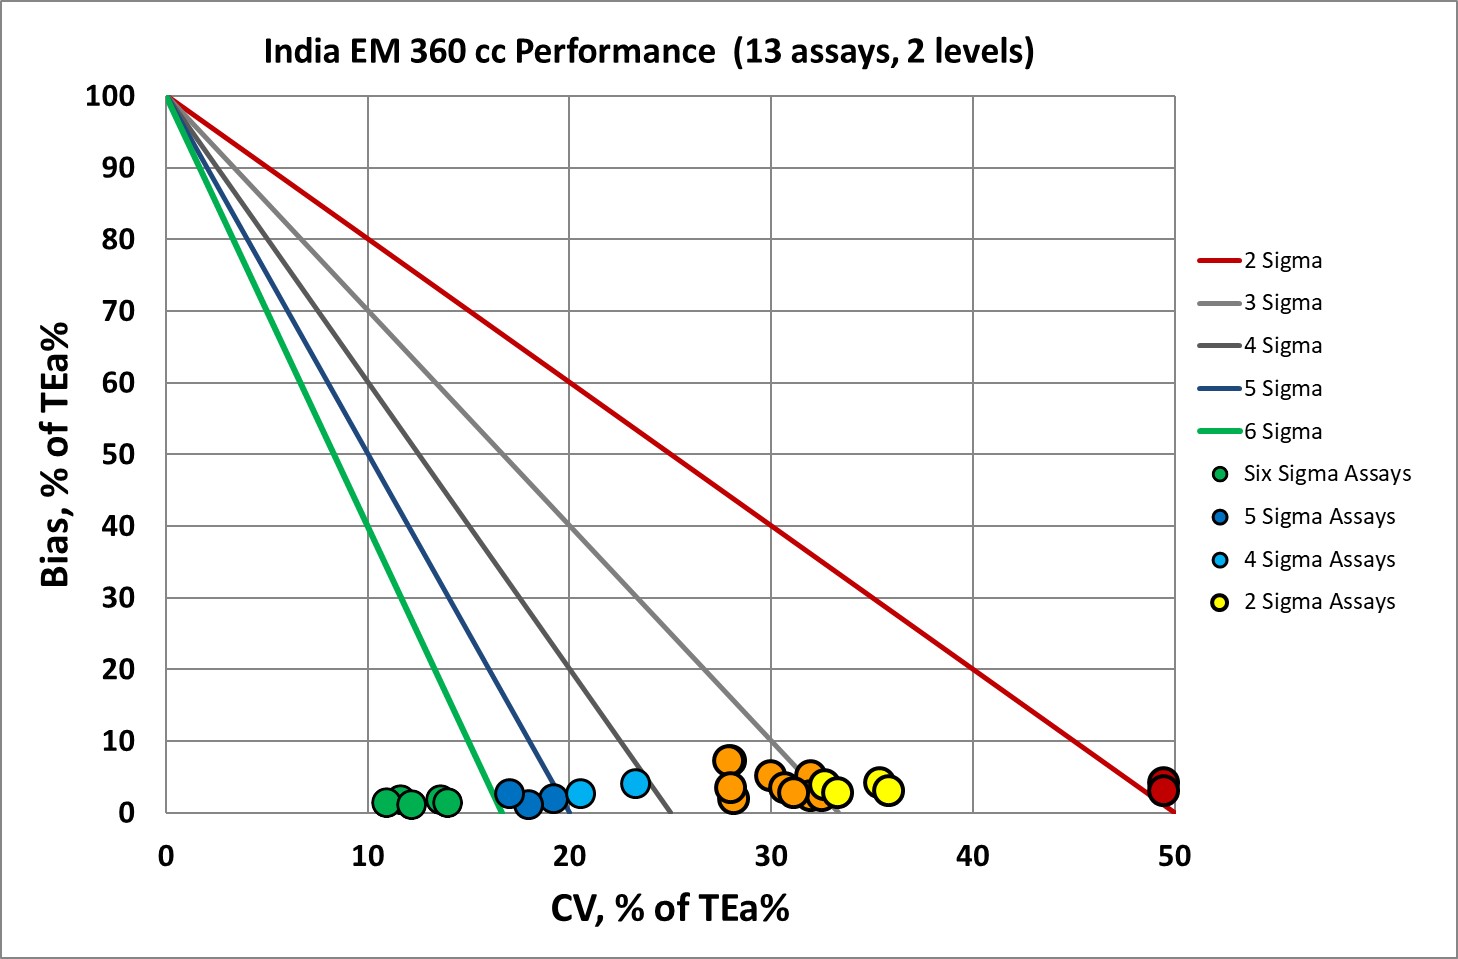
Overall, you can see that several of the x-coordinates (or imprecision) are on the right side of the graph, in fact a few of them are "off the chart" to the right, if we plotted them where they should be, which is a not a great sign. The bias is very low, as we noted before. So the problem for all the analytes here is the imprecision.
Summary of QC Design by Normalized OPSpecs chart - using CLIA and Ricos Goals
The benefit of the Sigma-metric approach is that labs can do more than assess their quality, they can act on it. Using OPSpecs charts, they can actually optimize their QC procedures for each test. In this case, they can use the data to try and mitigate the risk of poor performance.
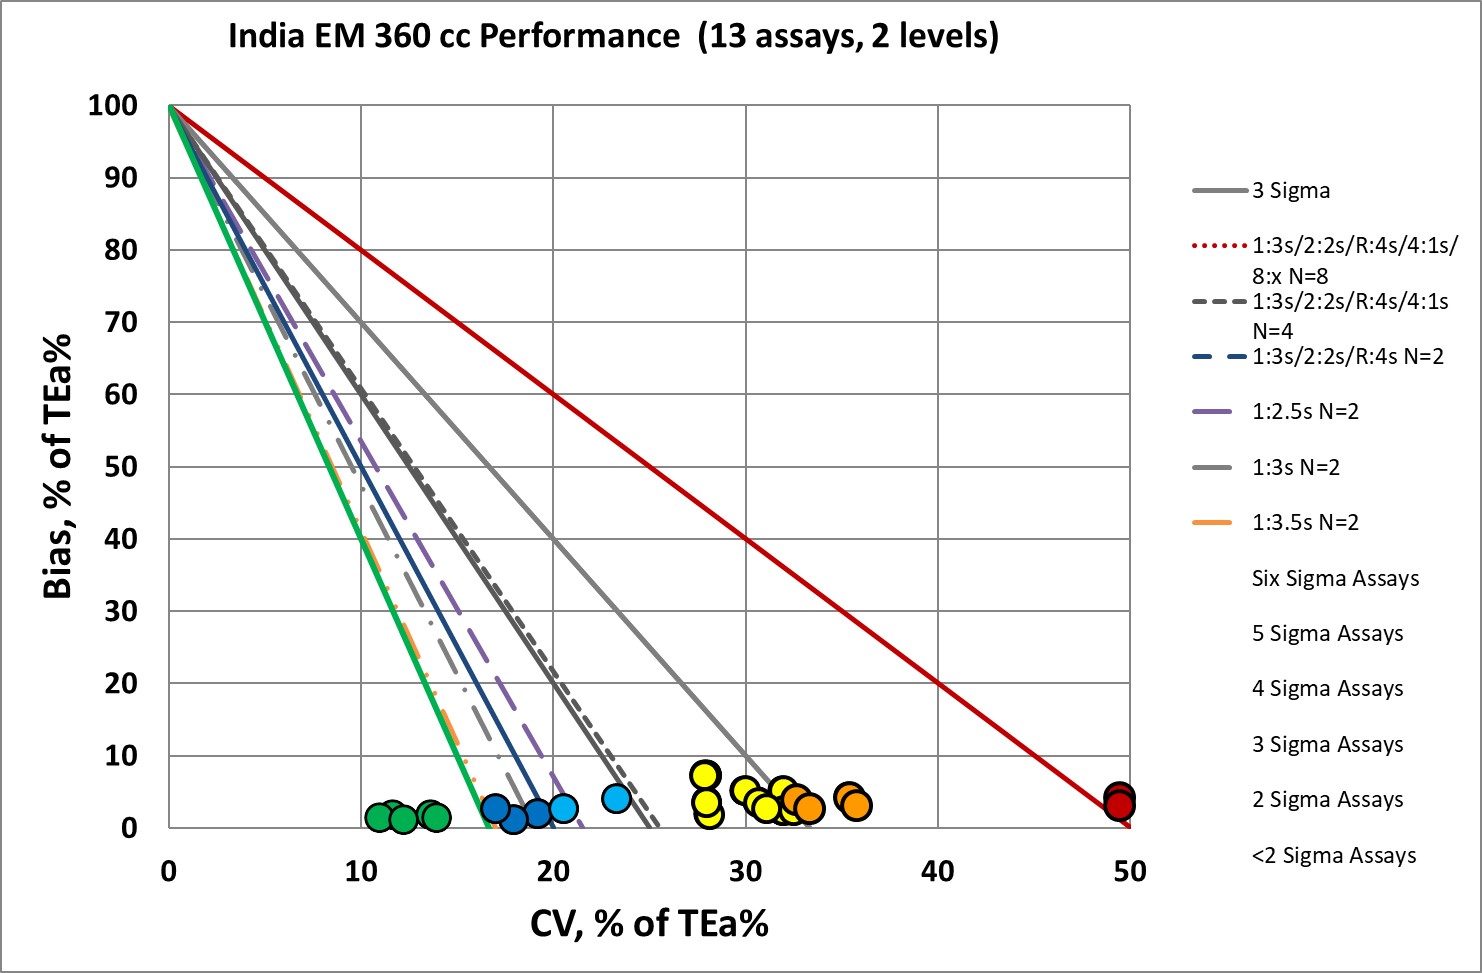
For many of these assays, all the "Westgard Rules" are necessary, and more than 2 controls are needed - more like 4 or 8 control measurements per run. This would be too expensive for most labs anywhere in the world. For those analytes which are "off the charts", there aren't enough "Westgard Rules" to keep these methods in control.
Conclusion
The authors stated "Sigma metrics will facilitate the initiation of ideal analytical methodologies in order to augment laboratory performance. Most of the laboratories demonstrated that < 3 sigma values for parameters such as creatinine (L1) and ALT (L1) ought to be re-evaluated in search for an ideal analytical methodology, so that all the laboratories across the country could achieve identical and improved quality performance.
"Most of the parameters that demonstrated sigma 3 to 6 sigma fall within acceptable sigma range with a chance for improvisation which may include improved CV%, Total error < TEa, better method, better instrument, no. of quality control run and reduced bias %.
"Triglyceride being the best performer in sigma scale (6 sigma) in most of the laboratories as well as in our laboratory leads to a satisfactory quality achievement. It also brings us to the conclusion that ideal quality strategy was used for triglyceride."
For once, the authors conclusion is similar to our own. They are not trying to gloss over problems of performance - they recognize this instrument has some good tests, some okay tests, and some poor tests. Every instrument has its challenges - the next question is whether there is a better alternative that's practical for this laboratory.