Sigma Metric Analysis
BS-200 Sigma-metrics by Package Insert
Today's emerging EFLM standards for desirable imprecision and bias are demanding. Can today's analyzers meet these desires? We check using the package inserts of the Mindray BS-200 analyzer.
Sigma-metric Analysis of Mindray BS-200
Sten Westgard, MS
February 2019
- The Precision, Comparison and Sigma-metric data
- Summary of Performance according to CLIA and Ricos Goals by Sigma-metrics Normalized Method Decision charts
- QC Implications of Mindray BS200 Performance by Normalized OPSpecs chart
- Conclusion
[Note: This QC application is an extension of the lesson From Method Validation to Six Sigma: Translating Method Performance Claims into Sigma Metrics. This article assumes that you have read that lesson first, and that you are also familiar with the concepts of QC Design, Method Validation, and Six Sigma metrics. If you aren't, follow the link provided.]
The EuBIVAS papers that have been published in the last few years, representing an update to the "Ricos Goals" of 2014, paint a picture of tightening analytical performance specifications. As these studies are converted into data determining desirable specifications for analytical imprecision, inaccuracy, and allowable total error.
The Imprecision, Bias and Sigma-metric Data
Package inserts for the reagents for the Pointe Scientific Pointe c2000 and Mindray BS-200 analyzers were accessed online.
"Precision studies were performed using the Pointe c2000 / Mindray BS-200 analyzer following a modification of the guidelines which are contained in NCCLS [now known as CLSI] document EP5-T2 ..."
Each package insert has a slightly different comparison detail, but the most of them are similar to the following "A study was performed between the Pointe c2000 / Mindray BS-200 and a similar analyzer using this method, resulting in a correlation coefficient of .... with a regression equation of ..." The correlation coefficient, slope, y-intercept, and number of patient samples monitored.
For most of the analytes two levels of control were run, while for CK, three levels of control were run. Based on these package inserts, CV and Bias is listed below:
| BS-200 CLIA/Ricos | Instrument Performance | |||||||
| TEST | TEa Source | TEa | Group or PeerMean |
Slope | y-intercept | Bias Units | % Bias | CV |
| Albumin | CLIA | 10 | 35.50 | 1.076 | -0.30 | 2.40 | 6.8 | 1.9 |
| Albumin | 10% | 10 | 42.56 | 1.076 | -0.30 | 2.93 | 6.9 | 2.3 |
| Alk Phos | CLIA | 30 | 81.00 | 1.077 | -8.90 | -2.66 | -3.3 | 3.3 |
| Alk Phos | 30% | 30 | 204.00 | 1.077 | -8.90 | 6.81 | 3.3 | 2.0 |
| ALT | CLIA | 20 | 41.80 | 0.94 | 5.80 | 3.29 | 7.9 | 3.6 |
| ALT | 20% | 20 | 111.90 | 0.94 | 5.80 | -0.91 | -0.8 | 2.3 |
| Amylase | CLIA | 30 | 64.60 | 0.96 | 1.70 | -0.69 | -1.1 | 4.7 |
| Amylase | 30% | 30 | 425.60 | 0.96 | 1.70 | -14.05 | -3.3 | 2.8 |
| AST | CLIA | 20 | 50.30 | 1.07 | 0.60 | 4.07 | 8.1 | 2.8 |
| AST | 20% | 20 | 194.50 | 1.07 | 0.60 | 14.02 | 7.2 | 3.8 |
| Bilirubin, Direct | Ricos | 44.50 | 0.39 | 0.99 | -0.12 | -0.13 | -32.3 | 12.8 |
| Bilirubin, Direct | 44.50% | 44.50 | 1.91 | 0.99 | -0.12 | -0.15 | -7.8 | 5.8 |
| Bilirubin, Total | CLIA 20% or | 59.70 | 0.67 | 0.90 | 0.02 | -0.05 | -6.8 | 6.0 |
| Bilirubin, Total | 0.4 mg/dL | 20.00 | 5.98 | 0.90 | 0.02 | -0.57 | -9.5 | 4.2 |
| Cholesterol | CLIA | 10.00 | 123.10 | 1.07 | -2.50 | 6.12 | 5.0 | 2.4 |
| Cholesterol | 10 | 10.00 | 251.40 | 1.07 | -2.50 | 15.10 | 6.0 | 2.7 |
| Creatinine Kinase (CK) | CLIA | 30 | 50.00 | 1.03 | -0.65 | 0.70 | 1.4 | 2.1 |
| Creatinine Kinase (CK) | 30 | 30 | 157.00 | 1.03 | -0.65 | 3.59 | 2.3 | 1.0 |
| Creatinine Kinase (CK) | 30% | 30 | 228.00 | 1.03 | -0.65 | 5.51 | 2.4 | 1.0 |
| GGT | Ricos | 22.11 | 28.90 | 1.02 | 4.80 | 5.38 | 18.6 | 3.8 |
| GGT | 22% | 22.11 | 76.80 | 1.02 | 4.80 | 6.34 | 8.3 | 3.1 |
| Glucose | CLIA 10% or | 33.81 | 89.00 | 0.98 | 2.30 | 0.96 | 1.1 | 1.3 |
| Glucose | 0.333 mmol/L | 33.81 | 257.00 | 0.98 | 2.30 | -1.58 | -0.6 | 1.2 |
| LDH | CAP | 20.00 | 114.40 | 1.01 | 4.10 | 5.59 | 4.9 | 2.0 |
| LDH | 20% | 20.00 | 331.30 | 1.01 | 4.10 | 8.41 | 2.5 | 2.1 |
| Phosphorous | CAP PT | 10.70 | 3.54 | 0.90 | 0.07 | -0.28 | -7.8 | 2.0 |
| Phosphorous | 10.7% | 10.70 | 7.99 | 0.90 | 0.07 | -0.71 | -8.9 | 2.5 |
| Lipase | Ricos 2014 | 21.90 | 45.10 | 0.96 | 5.10 | 3.39 | 7.5 | 5.7 |
| Lipase | 29% | 29.10 | 100.00 | 0.96 | 5.10 | 1.30 | 1.3 | 0.8 |
| LDL | CAP | 20.00 | 26.00 | 1.02 | 1.70 | 2.14 | 8.2 | 3.3 |
| LDL | 20% | 20.00 | 147.00 | 1.02 | 1.70 | 4.20 | 2.9 | 2.0 |
| Creatinine | CLIA | 15.00 | 1.24 | 1.02 | 0.03 | 0.05 | 4.2 | 3.2 |
| Creatinine | 15% | 15.00 | 7.11 | 1.02 | 0.03 | 0.16 | 2.2 | 5.8 |
| Calcium | CLIA | 11.16071 | 8.96 | 0.99 | 0.18 | 0.09 | 1.0 | 2.1 |
| Calcium | 1 mg/dL | 8.976661 | 11.14 | 0.99 | 0.18 | 0.07 | 0.6 | 2.3 |
| Total Iron | CLIA | 20 | 78.60 | 1.07 | -3.10 | 2.56 | 3.3 | 2.7 |
| Total Iron | 20 | 20 | 280.70 | 1.07 | -3.10 | 17.11 | 6.1 | 2.0 |
| Total Protein | CLIA | 10 | 4.78 | 0.92 | 0.36 | -0.03 | -0.6 | 1.5 |
| Total Protein | 10% | 10 | 7.63 | 0.92 | 0.36 | -0.26 | -3.4 | 1.8 |
| Triglycerides | CLIA | 25 | 72.30 | 1.03 | -1.50 | 0.74 | 1.0 | 2.4 |
| Triglycerides | 25% | 25 | 133.40 | 1.03 | -1.50 | 2.64 | 2.0 | 2.8 |
| BUN | CLIA | 14.28571 | 14.10 | 0.95 | 0.60 | -0.11 | -0.7 | 5.7 |
| BUN | 9% | 9 | 51.10 | 0.95 | 0.60 | -1.96 | -3.8 | 3.5 |
| Uric acid | CLIA | 17.00 | 7.11 | 1.02 | 0.02 | 0.13 | 1.8 | 2.0 |
| Uric acid | 18% | 17 | 10.13 | 1.02 | 0.02 | 0.17 | 1.7 | 2.0 |
Yes, that is a whole lot of numbers!
Nevertheless, what do all these numbers mean? In the absence of context, it's hard to know.
So let's calculate the Sigma-metrics.
Sigma-metric calculations for the BS-200
Remember the equation for Sigma metric is (TEa - bias) / CV:
For a 10% quality requirement, for Albumin on the low level of BS200, the equation is (10 - 6.8) / 1.9 = 1.68
For a 10% quality requirement, for Albumin on the high level of BS200, the equation is (10 - 6.9) / 2.3 = 1.3
The metrics are displayed along the right column.
| BS-200 CLIA/Ricos | Instrument Performance | ||||||||
| TEST | TEa Source | TEa | Group or PeerMean |
Slope | y-intercept | Bias Units | % Bias | CV | Sigma |
| Albumin | CLIA | 10 | 35.50 | 1.076 | -0.30 | 2.40 | 6.8 | 1.9 | 1.7 |
| Albumin | 10% | 10 | 42.56 | 1.076 | -0.30 | 2.93 | 6.9 | 2.3 | 1.3 |
| Alk Phos | CLIA | 30 | 81.00 | 1.077 | -8.90 | -2.66 | -3.3 | 3.3 | 10.1 |
| Alk Phos | 30% | 30 | 204.00 | 1.077 | -8.90 | 6.81 | 3.3 | 2.0 | 13.3 |
| ALT | CLIA | 20 | 41.80 | 0.94 | 5.80 | 3.29 | 7.9 | 3.6 | 3.4 |
| ALT | 20% | 20 | 111.90 | 0.94 | 5.80 | -0.91 | -0.8 | 2.3 | 9.1 |
| Amylase | CLIA | 30 | 64.60 | 0.96 | 1.70 | -0.69 | -1.1 | 4.7 | 6.6 |
| Amylase | 30% | 30 | 425.60 | 0.96 | 1.70 | -14.05 | -3.3 | 2.8 | 11.9 |
| AST | CLIA | 20 | 50.30 | 1.07 | 0.60 | 4.07 | 8.1 | 2.8 | 4.3 |
| AST | 20% | 20 | 194.50 | 1.07 | 0.60 | 14.02 | 7.2 | 3.8 | 3.4 |
| Bilirubin, Direct | Ricos | 44.50 | 0.39 | 0.99 | -0.12 | -0.13 | -32.3 | 12.8 | 1.0 |
| Bilirubin, Direct | 44.50% | 44.50 | 1.91 | 0.99 | -0.12 | -0.15 | -7.8 | 5.8 | 6.3 |
| Bilirubin, Total | CLIA 20% or | 59.70 | 0.67 | 0.90 | 0.02 | -0.05 | -6.8 | 6.0 | 8.8 |
| Bilirubin, Total | 0.4 mg/dL | 20.00 | 5.98 | 0.90 | 0.02 | -0.57 | -9.5 | 4.2 | 2.5 |
| Cholesterol | CLIA | 10.00 | 123.10 | 1.07 | -2.50 | 6.12 | 5.0 | 2.4 | 2.1 |
| Cholesterol | 10 | 10.00 | 251.40 | 1.07 | -2.50 | 15.10 | 6.0 | 2.7 | 1.5 |
| Creatinine Kinase (CK) | CLIA | 30 | 50.00 | 1.03 | -0.65 | 0.70 | 1.4 | 2.1 | 13.6 |
| Creatinine Kinase (CK) | 30 | 30 | 157.00 | 1.03 | -0.65 | 3.59 | 2.3 | 1.0 | 27.7 |
| Creatinine Kinase (CK) | 30% | 30 | 228.00 | 1.03 | -0.65 | 5.51 | 2.4 | 1.0 | 27.6 |
| GGT | Ricos | 22.11 | 28.90 | 1.02 | 4.80 | 5.38 | 18.6 | 3.8 | 0.9 |
| GGT | 22% | 22.11 | 76.80 | 1.02 | 4.80 | 6.34 | 8.3 | 3.1 | 4.5 |
| Glucose | CLIA 10% or | 33.81 | 89.00 | 0.98 | 2.30 | 0.96 | 1.1 | 1.3 | 25.2 |
| Glucose | 0.333 mmol/L | 33.81 | 257.00 | 0.98 | 2.30 | -1.58 | -0.6 | 1.2 | 28.7 |
| LDH | CAP | 20.00 | 114.40 | 1.01 | 4.10 | 5.59 | 4.9 | 2.0 | 7.6 |
| LDH | 20% | 20.00 | 331.30 | 1.01 | 4.10 | 8.41 | 2.5 | 2.1 | 8.3 |
| Phosphorous | CAP PT | 10.70 | 3.54 | 0.90 | 0.07 | -0.28 | -7.8 | 2.0 | 1.5 |
| Phosphorous | 10.7% | 10.70 | 7.99 | 0.90 | 0.07 | -0.71 | -8.9 | 2.5 | 0.7 |
| Lipase | Ricos 2014 | 21.90 | 45.10 | 0.96 | 5.10 | 3.39 | 7.5 | 5.7 | 2.5 |
| Lipase | 29% | 29.10 | 100.00 | 0.96 | 5.10 | 1.30 | 1.3 | 0.8 | 34.8 |
| LDL | CAP | 20.00 | 26.00 | 1.02 | 1.70 | 2.14 | 8.2 | 3.3 | 3.6 |
| LDL | 20% | 20.00 | 147.00 | 1.02 | 1.70 | 4.20 | 2.9 | 2.0 | 8.6 |
| Creatinine | CLIA | 15.00 | 1.24 | 1.02 | 0.03 | 0.05 | 4.2 | 3.2 | 3.4 |
| Creatinine | 15% | 15.00 | 7.11 | 1.02 | 0.03 | 0.16 | 2.2 | 5.8 | 2.2 |
| Calcium | CLIA | 11.16071 | 8.96 | 0.99 | 0.18 | 0.09 | 1.0 | 2.1 | 4.8 |
| Calcium | 1 mg/dL | 8.976661 | 11.14 | 0.99 | 0.18 | 0.07 | 0.6 | 2.3 | 3.6 |
| Total Iron | CLIA | 20 | 78.60 | 1.07 | -3.10 | 2.56 | 3.3 | 2.7 | 6.2 |
| Total Iron | 20 | 20 | 280.70 | 1.07 | -3.10 | 17.11 | 6.1 | 2.0 | 7.0 |
| Total Protein | CLIA | 10 | 4.78 | 0.92 | 0.36 | -0.03 | -0.6 | 1.5 | 6.3 |
| Total Protein | 10% | 10 | 7.63 | 0.92 | 0.36 | -0.26 | -3.4 | 1.8 | 3.7 |
| Triglycerides | CLIA | 25 | 72.30 | 1.03 | -1.50 | 0.74 | 1.0 | 2.4 | 10.0 |
| Triglycerides | 25% | 25 | 133.40 | 1.03 | -1.50 | 2.64 | 2.0 | 2.8 | 8.2 |
| BUN | CLIA | 14.28571 | 14.10 | 0.95 | 0.60 | -0.11 | -0.7 | 5.7 | 2.4 |
| BUN | 9% | 9 | 51.10 | 0.95 | 0.60 | -1.96 | -3.8 | 3.5 | 1.5 |
| Uric acid | CLIA | 17.00 | 7.11 | 1.02 | 0.02 | 0.13 | 1.8 | 2.0 | 7.6 |
| Uric acid | 18% | 17 | 10.13 | 1.02 | 0.02 | 0.17 | 1.7 | 2.0 | 7.7 |
Yes, there are a lot of low Sigma-metrics. Negative Sigma is unusual, reflecting a situation when the bias completely exceeds the allowable total error. There are a few high Sigma-metrics, but the majority of the numbers are below 3 Sigma, typically considered the minimum acceptable performance.
Even if we don't use Sigma-metrics and total analytical total allowable errors to judge these methods, we can use the Ricos 2014 desirable specifications for imprecision and bias, as well as the updated EuBIVAS studies (which started in 2017 through 2018) desirable specifications for imprecision and bias. We'll highlight in red the performance where the instrument failed to achieve those goals, and highlight in green the areas where the instrument did achieve those goals.
| BS-200 CLIA/Ricos | Instrument Performance | ||||||||||
| TEST | TEa Source | TEa | Group or PeerMean |
Slope | y-intercept | Bias Units | EuBIVAS des bias |
% Bias | EuBIVAS des CV |
CV | Sigma |
| Albumin | CLIA | 10 | 35.50 | 1.076 | -0.30 | 2.40 | 6.8 | 1.9 | 1.7 | ||
| Albumin | 10% | 10 | 42.56 | 1.076 | -0.30 | 2.93 | 6.9 | 2.3 | 1.3 | ||
| Alk Phos | CLIA | 30 | 81.00 | 1.077 | -8.90 | -2.66 | 6.40 | -3.3 | 2.7 | 3.3 | 10.1 |
| Alk Phos | 30% | 30 | 204.00 | 1.077 | -8.90 | 6.81 | 6.40 | 3.3 | 2.7 | 2.0 | 13.3 |
| ALT | CLIA | 20 | 41.80 | 0.94 | 5.80 | 3.29 | 6.70 | 7.9 | 4.7 | 3.6 | 3.4 |
| ALT | 20% | 20 | 111.90 | 0.94 | 5.80 | -0.91 | 6.70 | -0.8 | 4.7 | 2.3 | 9.1 |
| Amylase | CLIA | 30 | 64.60 | 0.96 | 1.70 | -0.69 | 8.40 | -1.1 | 3.4 | 4.7 | 6.6 |
| Amylase | 30% | 30 | 425.60 | 0.96 | 1.70 | -14.05 | 8.40 | -3.3 | 3.4 | 2.8 | 11.9 |
| AST | CLIA | 20 | 50.30 | 1.07 | 0.60 | 4.07 | 5.60 | 8.1 | 4.8 | 2.8 | 4.3 |
| AST | 20% | 20 | 194.50 | 1.07 | 0.60 | 14.02 | 5.60 | 7.2 | 4.8 | 3.8 | 3.4 |
| Bilirubin, Direct | Ricos | 44.50 | 0.39 | 0.99 | -0.12 | -0.13 | 11.40 | -32.3 | 10.5 | 12.8 | 1.0 |
| Bilirubin, Direct | 44.50% | 44.50 | 1.91 | 0.99 | -0.12 | -0.15 | 11.40 | -7.8 | 10.5 | 5.8 | 6.3 |
| Bilirubin, Total | CLIA 20% or | 59.70 | 0.67 | 0.90 | 0.02 | -0.05 | 11.00 | -6.8 | 10.5 | 6.0 | 8.8 |
| Bilirubin, Total | 0.4 mg/dL | 20.00 | 5.98 | 0.90 | 0.02 | -0.57 | 11.00 | -9.5 | 10.5 | 4.2 | 2.5 |
| Cholesterol | CLIA | 10.00 | 123.10 | 1.07 | -2.50 | 6.12 | 3.60 | 5.0 | 2.6 | 2.4 | 2.1 |
| Cholesterol | 10 | 10.00 | 251.40 | 1.07 | -2.50 | 15.10 | 3.60 | 6.0 | 2.6 | 2.7 | 1.5 |
| Creatinine Kinase (CK) | CLIA | 30 | 50.00 | 1.03 | -0.65 | 0.70 | 8.40 | 1.4 | 7.3 | 2.1 | 13.6 |
| Creatinine Kinase (CK) | 30 | 30 | 157.00 | 1.03 | -0.65 | 3.59 | 8.40 | 2.3 | 7.3 | 1.0 | 27.7 |
| Creatinine Kinase (CK) | 30% | 30 | 228.00 | 1.03 | -0.65 | 5.51 | 8.40 | 2.4 | 7.3 | 1.0 | 27.6 |
| GGT | Ricos | 22.11 | 28.90 | 1.02 | 4.80 | 5.38 | 8.40 | 18.6 | 4.5 | 3.8 | 0.9 |
| GGT | 22% | 22.11 | 76.80 | 1.02 | 4.80 | 6.34 | 8.40 | 8.3 | 4.5 | 3.1 | 4.5 |
| Glucose | CLIA 10% or | 33.81 | 89.00 | 0.98 | 2.30 | 0.96 | 2.10 | 1.1 | 2.4 | 1.3 | 25.2 |
| Glucose | 0.333 mmol/L | 33.81 | 257.00 | 0.98 | 2.30 | -1.58 | 2.10 | -0.6 | 2.4 | 1.2 | 28.7 |
| LDH | CAP | 20.00 | 114.40 | 1.01 | 4.10 | 5.59 | 3.40 | 4.9 | 2.6 | 2.0 | 7.6 |
| LDH | 20% | 20.00 | 331.30 | 1.01 | 4.10 | 8.41 | 3.40 | 2.5 | 2.6 | 2.1 | 8.3 |
| Phosphorous | CAP PT | 10.70 | 3.54 | 0.90 | 0.07 | -0.28 | 3.20 | -7.8 | 3.8 | 2.0 | 1.5 |
| Phosphorous | 10.7% | 10.70 | 7.99 | 0.90 | 0.07 | -0.71 | 3.20 | -8.9 | 3.8 | 2.5 | 0.7 |
| Lipase | Ricos 2014 | 21.90 | 45.10 | 0.96 | 5.10 | 3.39 | 6.30 | 7.5 | 3.9 | 5.7 | 2.5 |
| Lipase | 29% | 29.10 | 100.00 | 0.96 | 5.10 | 1.30 | 6.30 | 1.3 | 3.9 | 0.8 | 34.8 |
| LDL | CAP | 20.00 | 26.00 | 1.02 | 1.70 | 2.14 | 6.10 | 8.2 | 4.2 | 3.3 | 3.6 |
| LDL | 20% | 20.00 | 147.00 | 1.02 | 1.70 | 4.20 | 6.10 | 2.9 | 4.2 | 2.0 | 8.6 |
| Creatinine | CLIA | 15.00 | 1.24 | 1.02 | 0.03 | 0.05 | 2.80 | 4.2 | 2.2 | 3.2 | 3.4 |
| Creatinine | 15% | 15.00 | 7.11 | 1.02 | 0.03 | 0.16 | 2.80 | 2.2 | 2.2 | 5.8 | 2.2 |
| Calcium | CLIA | 11.16071 | 8.96 | 0.99 | 0.18 | 0.09 | 0.80 | 1.0 | 0.9 | 2.1 | 4.8 |
| Calcium | 1 mg/dL | 8.976661 | 11.14 | 0.99 | 0.18 | 0.07 | 0.80 | 0.6 | 0.9 | 2.3 | 3.6 |
| Total Iron | CLIA | 20 | 78.60 | 1.07 | -3.10 | 2.56 | 3.3 | 2.7 | 6.2 | ||
| Total Iron | 20 | 20 | 280.70 | 1.07 | -3.10 | 17.11 | 6.1 | 2.0 | 7.0 | ||
| Total Protein | CLIA | 10 | 4.78 | 0.92 | 0.36 | -0.03 | 1.20 | -0.6 | 1.3 | 1.5 | 6.3 |
| Total Protein | 10% | 10 | 7.63 | 0.92 | 0.36 | -0.26 | 1.20 | -3.4 | 1.3 | 1.8 | 3.7 |
| Triglycerides | CLIA | 25 | 72.30 | 1.03 | -1.50 | 0.74 | 10.70 | 1.0 | 9.5 | 2.4 | 10.0 |
| Triglycerides | 25% | 25 | 133.40 | 1.03 | -1.50 | 2.64 | 10.70 | 2.0 | 9.5 | 2.8 | 8.2 |
| BUN | CLIA | 14.28571 | 14.10 | 0.95 | 0.60 | -0.11 | 5.80 | -0.7 | 6.4 | 5.7 | 2.4 |
| BUN | 9% | 9 | 51.10 | 0.95 | 0.60 | -1.96 | 5.80 | -3.8 | 6.4 | 3.5 | 1.5 |
| Uric acid | CLIA | 17.00 | 7.11 | 1.02 | 0.02 | 0.13 | 4.20 | 1.8 | 3.9 | 2.0 | 7.6 |
| Uric acid | 18% | 17 | 10.13 | 1.02 | 0.02 | 0.17 | 4.20 | 1.7 | 3.9 | 2.0 | 7.7 |
As you can see, most of these assays meet the new desirable specifications, but 30% of the data here does NOT meet the desirable specifications set forth by EuBIVAS.
Considering this is the performance data that the company itself generated, that's a lot of failure right from the starting pistol. If performance in the real world for laboratories is worse than the manufacturer specifications, that means even more than a third of the assay points are below acceptability.
Summary of Performance by Sigma-metrics Method Decision Chart using primarily CLIA Goals
We can make visual assessments of this performance using a Normalized Sigma-metric Method Decision Chart:
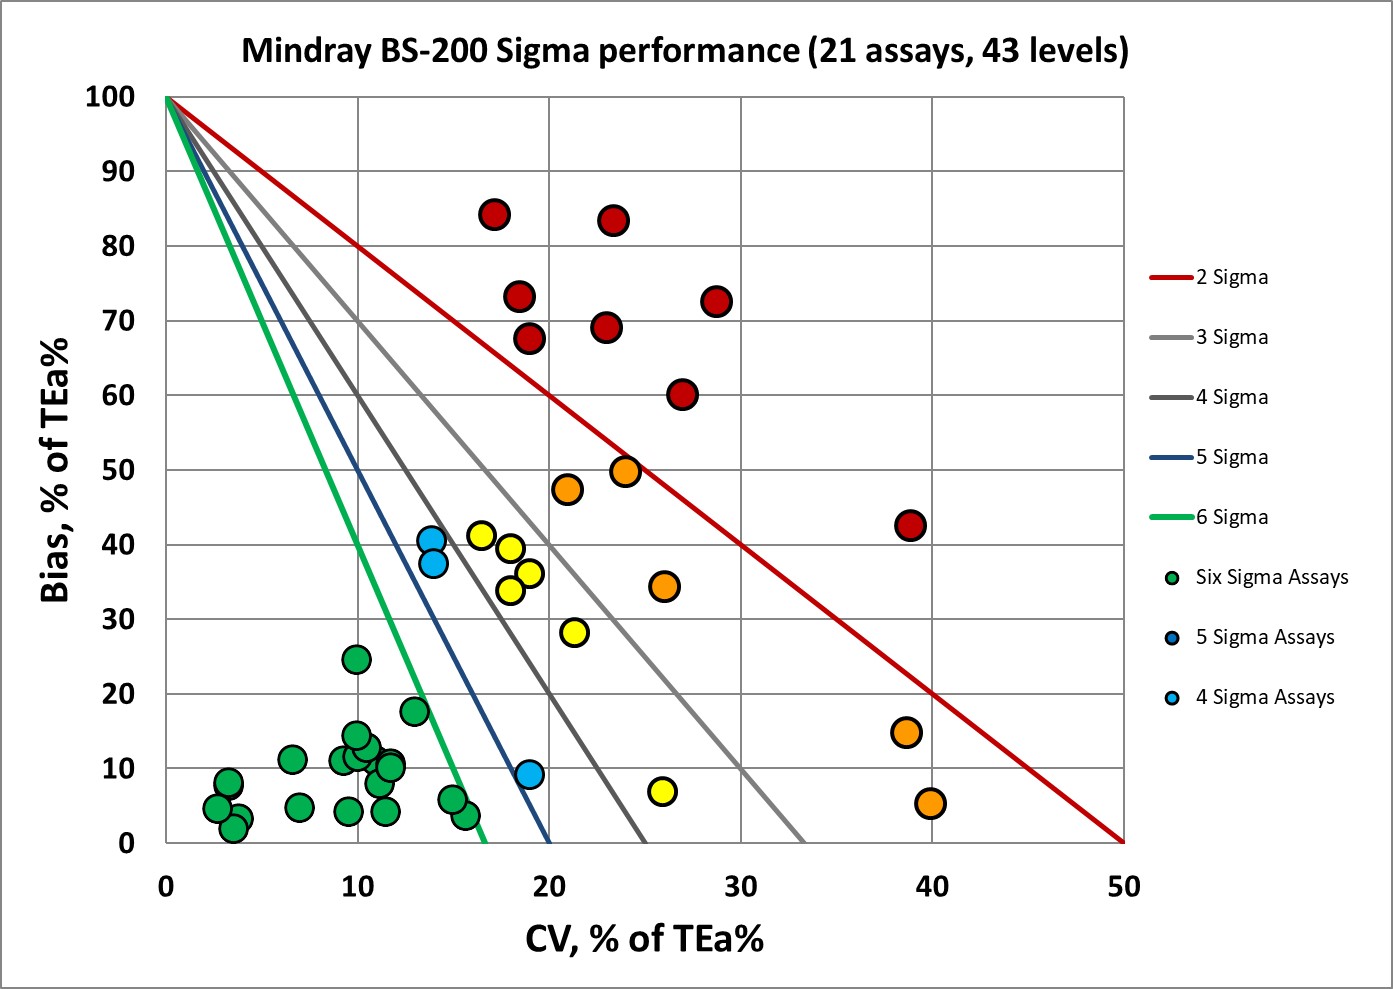
A few have both more than the allowable bias and more than the allowable imprecision.
Summary of QC Design by Normalized OPSpecs chart - using primarily CLIA Goals
The benefit of the Sigma-metric approach is that labs can do more than assess their quality, they can act on it. Using OPSpecs charts, they can actually optimize their QC procedures for each test. In this case, they can use the data to try and mitigate the risk of poor performance.
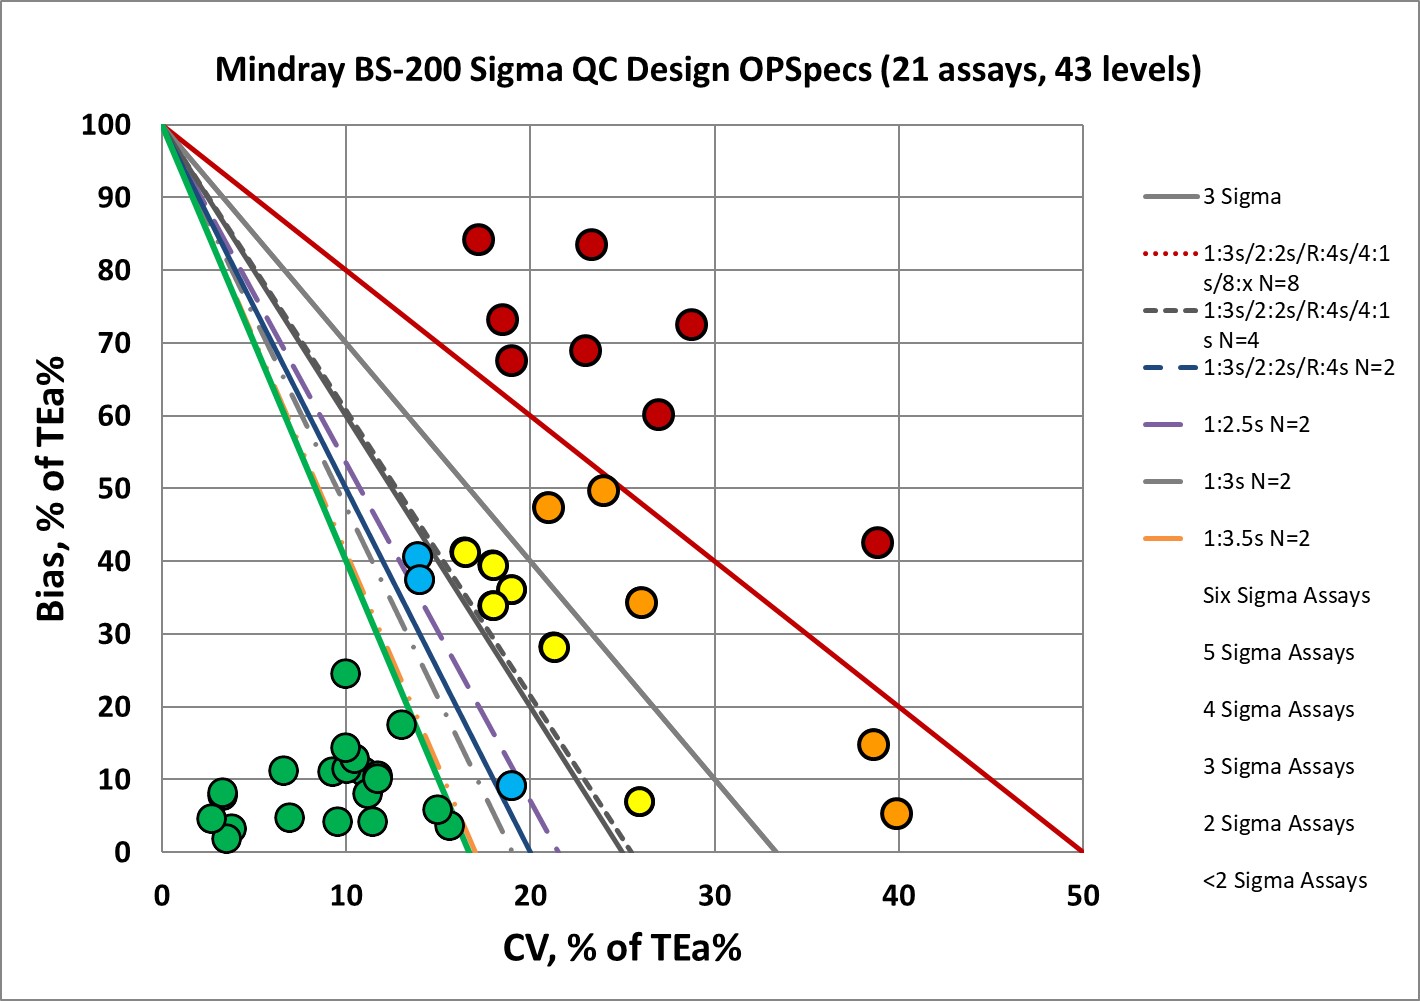
For a dozen of these points, we will need the maximum "Westgard Rules" with 8 control measurements per run. Put bluntly, there is no practical statistical quality control procedure that can help. There aren't enough "Westgard rules" to keep some of these methods in control.
Assessing Performance and QC Design by Normalized Method Decision and OPSpecs Chart - using EuBIVAS goals
Now, what if we used analytical performance specifications for allowable total error derived from these new EuBIVAS studies? These will create quality requirements much more stringent than current CLIA goals. How would we assess this instrument if we used EuBIVAS TEa goals?
First we should look at the new Sigma-metrics calculated using Desirable TEa goals from EuBIVAS studies:
| EUBIVAS-BS-200 | |||
| TEST | TEa Source | TEa | Sigma |
| Albumin | EuBivas | 1.44 | 1.6 |
| Albumin | 1% | 1.44 | 1.6 |
| Alk Phos | EuBivas | 10.7 | 2.2 |
| Alk Phos | 11% | 10.7 | 3.7 |
| ALT | EuBivas | 14.4 | 1.8 |
| ALT | 14% | 14.4 | 5.9 |
| Amylase | EuBivas | 13.4 | 2.6 |
| Amylase | 13% | 13.4 | 3.6 |
| AST | EuBivas | 13.4 | 1.9 |
| AST | 13% | 13.4 | 1.6 |
| Bilirubin, Direct | EuBivas | 33.40 | 0.1 |
| Bilirubin, Direct | 33.40% | 33.40 | 4.4 |
| Bilirubin, Total | EuBivas | 25.70 | 3.1 |
| Bilirubin, Total | 25.7 | 25.70 | 3.9 |
| Cholesterol | EuBivas | 7.90 | 1.2 |
| Cholesterol | 7.9 | 7.90 | 0.7 |
| Creatinine Kinase (CK) | EuBivas | 20.4 | 9.0 |
| Creatinine Kinase (CK) | 20.4 | 20.4 | 18.1 |
| Creatinine Kinase (CK) | 20% | 20.4 | 18.0 |
| GGT | EuBivas | 15.70 | negative |
| GGT | 16% | 15.70 | 2.4 |
| Glucose | EuBivas | 6.00 | 3.8 |
| Glucose | 6% | 6.00 | 4.5 |
| LDH | EuBivas | 7.70 | 1.4 |
| LDH | 8% | 7.70 | 2.5 |
| Phosphorous | |||
| Phosphorous | |||
| Lipase | EuBivas | 12.60 | 0.9 |
| Lipase | 13% | 12.60 | 14.1 |
| LDL | EuBivas | 13.00 | 1.4 |
| LDL | 13% | 13.00 | 5.1 |
| Creatinine | EuBivas | 6.40 | 0.7 |
| Creatinine | 6% | 6.40 | 0.7 |
| Calcium | EuBivas | 2.3 | 0.6 |
| Calcium | 2.3 | 2.3 | 0.7 |
| Total Iron | |||
| Total Iron | |||
| Total Protein | EuBivas | 3.4 | 1.9 |
| Total Protein | 3% | 3.4 | 0.0 |
| Triglycerides | EuBivas | 26.4 | 10.6 |
| Triglycerides | 26% | 26.4 | 8.7 |
| BUN | EuBivas | 16.1 | 2.7 |
| BUN | 16% | 16.1 | 3.5 |
| Uric acid | EuBivas | 10.60 | 4.4 |
| Uric acid | 11% | 10.6 | 4.5 |
You can see the metrics got a lot worse once the EuBIVAS goals are applied. If analytical allowable total erros are calculated from EuBIVAS specifications, the acceptability of this instrument is dramatically reduced. A majority of the performance here is now below Three Sigma. And about 70% of the performance is below Four Sigma. One method is ZERO Sigma, and another one is negative Sigma, which simply means the bias is larger than the allowable total error.
The Normailzed Method Decision chart makes it more obvious we have a problem if EuBIVAS goals are applied.
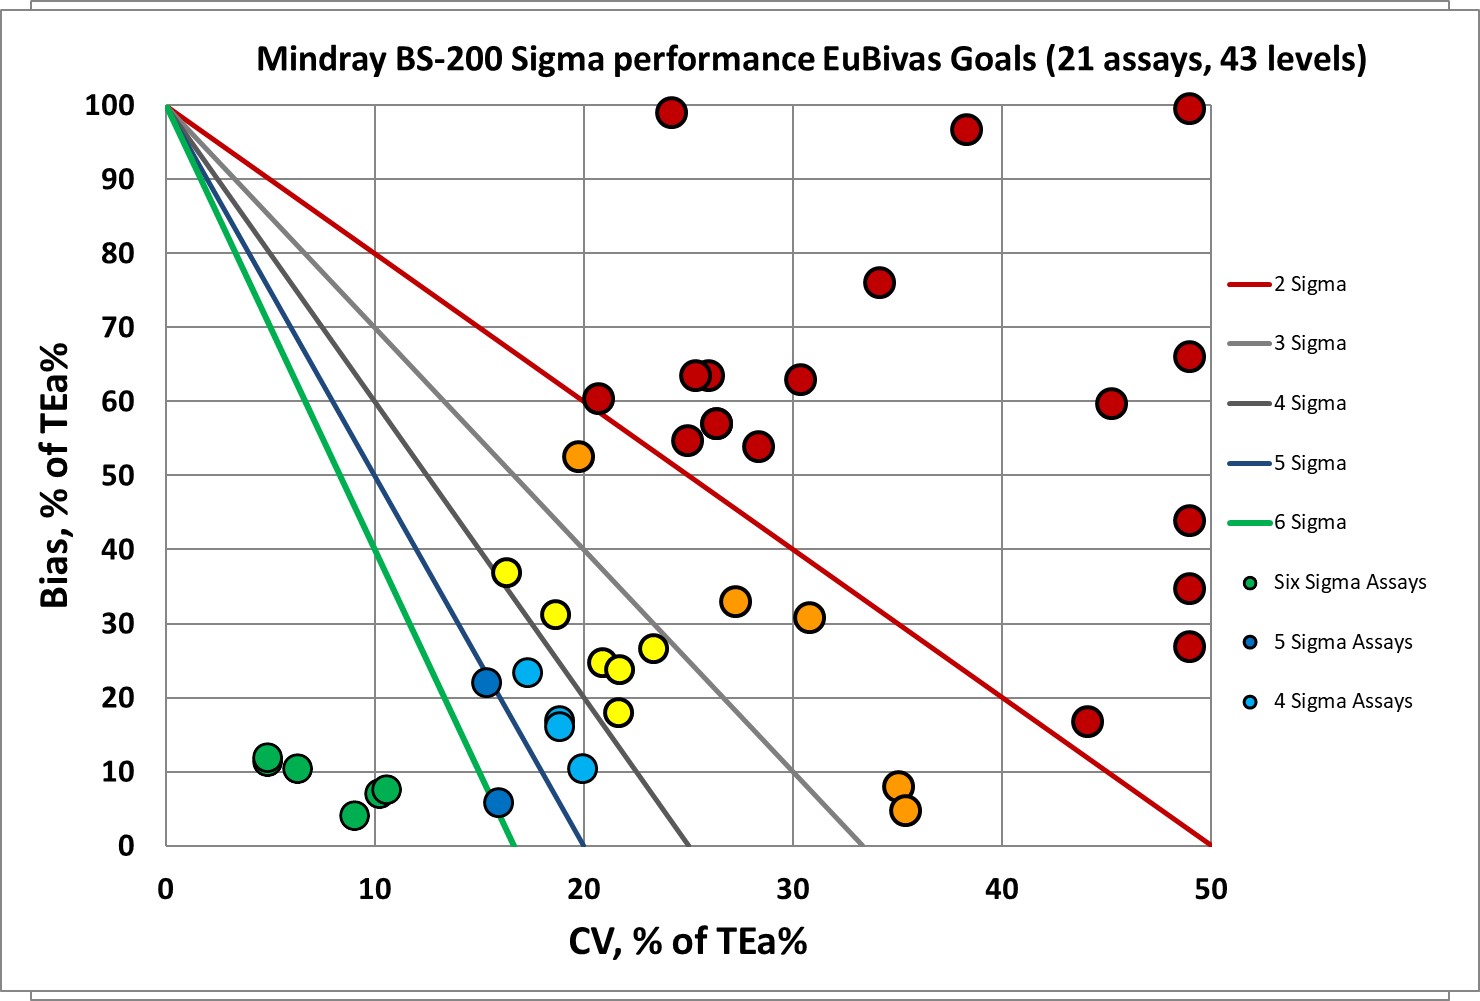
You can see the number of unacceptable data points has exploded. The number of Six Sigma assays has shrunk.
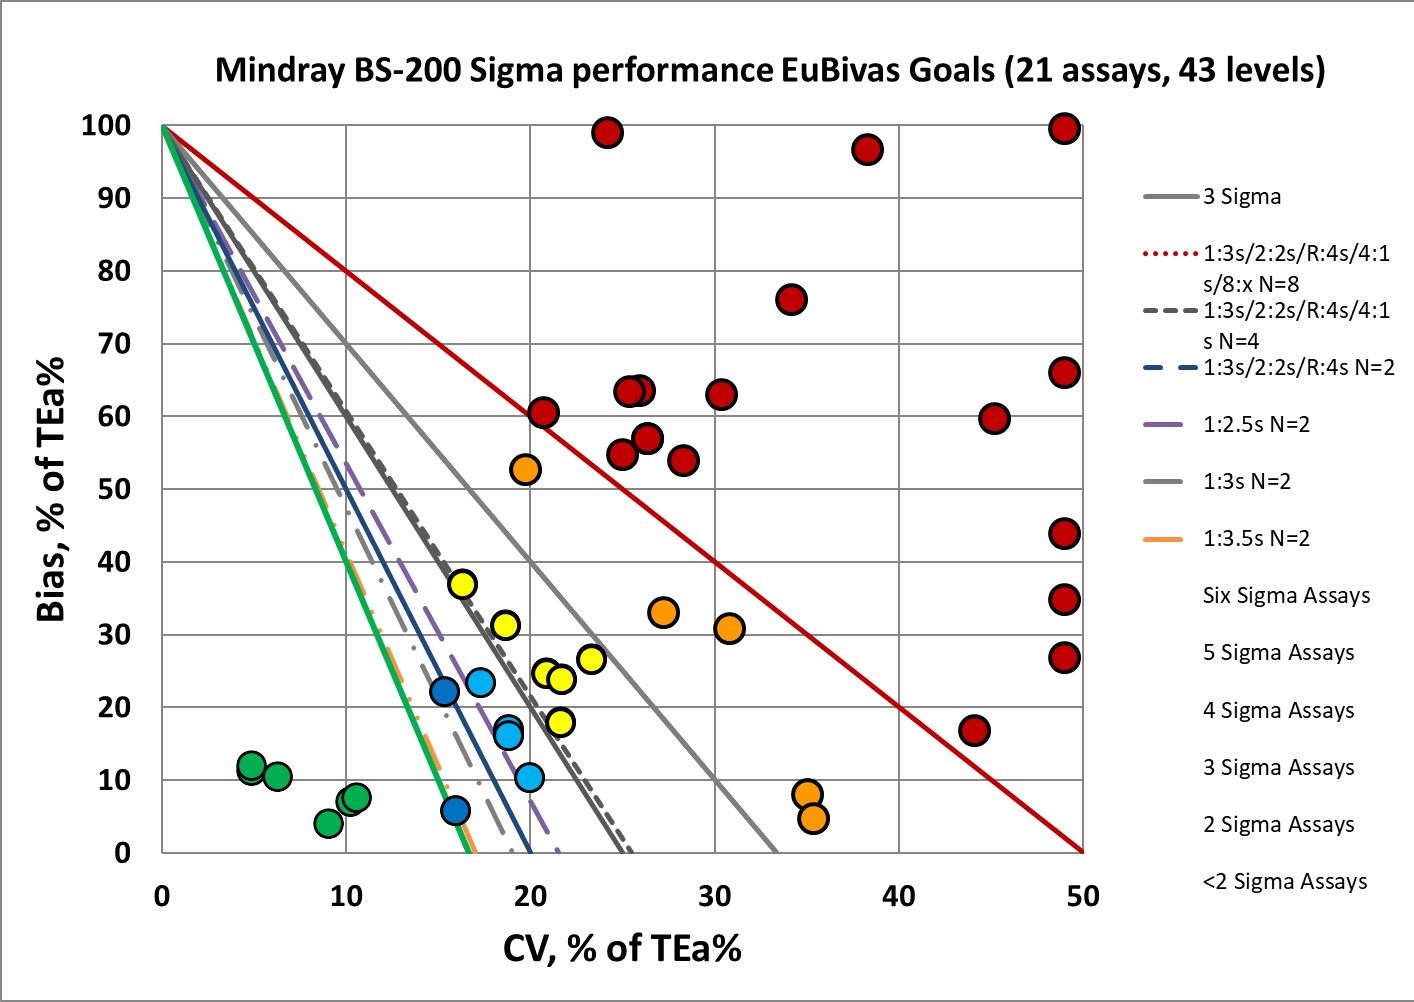
Again, a majority of these assay control levels will need maximum "Westgard Rules" and a quadrupling of control measurements. Which is really another way of saying - we can't control those methods, there are not enough rules or enough controls we can run. If we looked at how often we should be running, it would be even more impractical.
In other words, the BS200 does not meet the desirable analytical performance specifications of EuBIVAS.
Conclusion
Package inserts from manufacturers are often thought of as overly optimistic, idealized, perhaps too good to be true. Typically, real world laboratories experience more bias and more imprecision than what is shown on the insert. Yet for the BS-200, just under a third of the performance is unacceptable by CLIA goals, and more than 50% of the performance is unacceptable by new EuBIVAS standards.
What are we to conclude? Is the BS-200 unacceptable for today's laboratories? tomorrow's laboratories? Or are we holding assays to standards that no laboratory, no instrument can meet? Perhaps the goals are unacceptable, but the instrument is fine.
Of course, these possibilities are not mutually exclusive. It is entirely possible that some EuBIVAS goals are unattainable AND some instruments are unacceptable by nearly any quality standard.