Sigma Metric Analysis
ADVIA Centaur XPT Thyroid Function Testing
A recent study of the thyroid function tests on the ADVIA Centaur XPT in Hyderabad, India raises the question about the quality of the major diagnostic instruments when they are in a more challenging environment.
Sigma-metric Analysis of ADVIA Centaur XPT analyser in India
Sten Westgard, MS
May 2019
- The Precision, Comparison and Sigma-metric data
- Summary of Performance by Sigma-metrics Normalized Method Decision charts
- QC Implications of ADVIA Centaur XPT Performance by Normalized OPSpecs chart
- Conclusion
[Note: This QC application is an extension of the lesson From Method Validation to Six Sigma: Translating Method Performance Claims into Sigma Metrics. This article assumes that you have read that lesson first, and that you are also familiar with the concepts of QC Design, Method Validation, and Six Sigma metrics. If you aren't, follow the link provided.]
In February of 2019, a new study was published evaluating the performance of a ADVIA Centaur XPT analyser:
Target Score of RIQAS and Sigma Metrics for evaluating the analytical performance of thyroid function testing on ADVIA Centaur XPT Immunoassay analyser, Babu Rao Rentapalli, Suresh Babu Ganji, MD Dawood Sulemani, J. Evolution Med Dent Sci, Vol 8, Issue 7, 447-450. Febaruary 18, 2019.
The Imprecision, Bias and Sigma-metric Data
"Our objective is to present the... sigma metrics observed in our clinical chemistry laboratory in Gandhi hospital, Hyderabad, a tertiary care hospital in the Telangana state in India. The study period was from August to October 2018, i.e. for 3 months. Thyroid function testing i.e., T3 total, T4 total and Thyroid Stimulating Hormone (TSH); daily Quality Control data was taken from Siemens ADVIA CEntaur XPT immunoassay analyser for the period of 3 months. As we run only one level of Control material (Bio-Rad) we had CV data for L1 only. QC material was assayed before commencing reporting of patient samples every day."
The TEa goals used include Spanish minimum goals as well as the Ricos 2014 goal for TSH.
| Analyte | TEa source | TEa | Bias | CV |
| TT3 - august | Spanish Minimum | 24 | 2.4 | 10.1 |
| TT3 - september | Spanish Minimum | 24 | 12.8 | 10.1 |
| TT3 - october | Spanish Minimum | 24 | 21.2 | 13.8 |
| TSH - august | Ricos Desirable | 23.7 | 0.8 | 11.2 |
| TSH - september | Ricos Desirable | 23.7 | 21.6 | 11.2 |
| TSH - october | Ricos Desirable | 23.7 | 14.4 | 11.2 |
| TT4 - august | Spanish Minimum | 24 | 6.3 | 13.8 |
| TT4 - september | Spanish Minimum | 24 | 5.0 | 11.7 |
| TT4 - october | Spanish Minimum | 24 | 0.7 | 11.8 |
Yes, that is a whole lot of numbers!
Nevertheless, what do all these numbers mean? In the absence of context, it's hard to know.
So let's calculate the Sigma-metrics.
Sigma-metric calculations for the ADVIA Centaur XPT
Remember the equation for Sigma metric is (TEa - bias) / CV:
For a 24% quality requirement, for TT3 on the Centaur XPT, the equation is (24 - 2.4) / 10.1 = 2.1
The metrics are displayed along the right column.
| Analyte | TEa source | TEa | Bias | CV | Sigma |
| TT3 - august | Spanish Minimum | 24 | 2.4 | 10.1 | 2.1 |
| TT3 - september | Spanish Minimum | 24 | 12.8 | 10.1 | 1.1 |
| TT3 - october | Spanish Minimum | 24 | 21.2 | 13.8 | 0.2 |
| TSH - august | Ricos Desirable | 23.7 | 0.8 | 11.2 | 2.0 |
| TSH - september | Ricos Desirable | 23.7 | 21.6 | 11.2 | 0.2 |
| TSH - october | Ricos Desirable | 23.7 | 14.4 | 11.2 | 0.8 |
| TT4 - august | Spanish Minimum | 24 | 6.3 | 13.8 | 1.3 |
| TT4 - september | Spanish Minimum | 24 | 5.0 | 11.7 | 1.6 |
| TT4 - october | Spanish Minimum | 24 | 0.7 | 11.8 | 1.97 |
Yes, there are a lot of low Sigma-metrics. All of them are below 3 Sigma, typically considered the minimum acceptable performance.
Summary of Performance by Sigma-metrics Method Decision Chart
We can make visual assessments of this performance using a Normalized Sigma-metric Method Decision Chart:
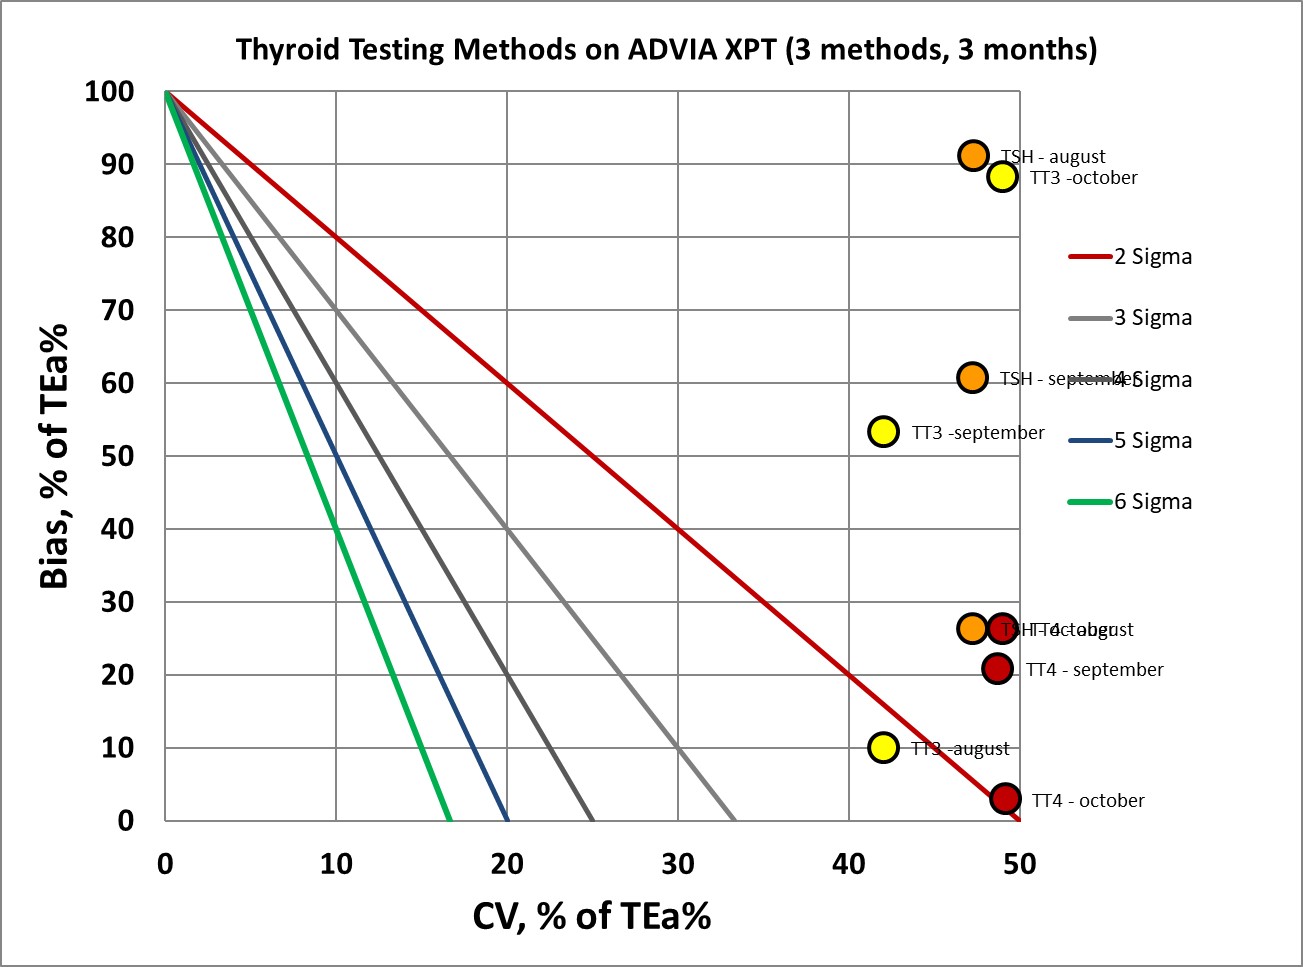
Overall, it seems like a consistently bad performance for all thyroid function tests on this XPT in this laboratory.
Summary of QC Design by Normalized OPSpecs chart
The benefit of the Sigma-metric approach is that labs can do more than assess their quality, they can act on it. Using OPSpecs charts, they can actually optimize their QC procedures for each test. In this case, they can use the data to try and mitigate the risk of poor performance.
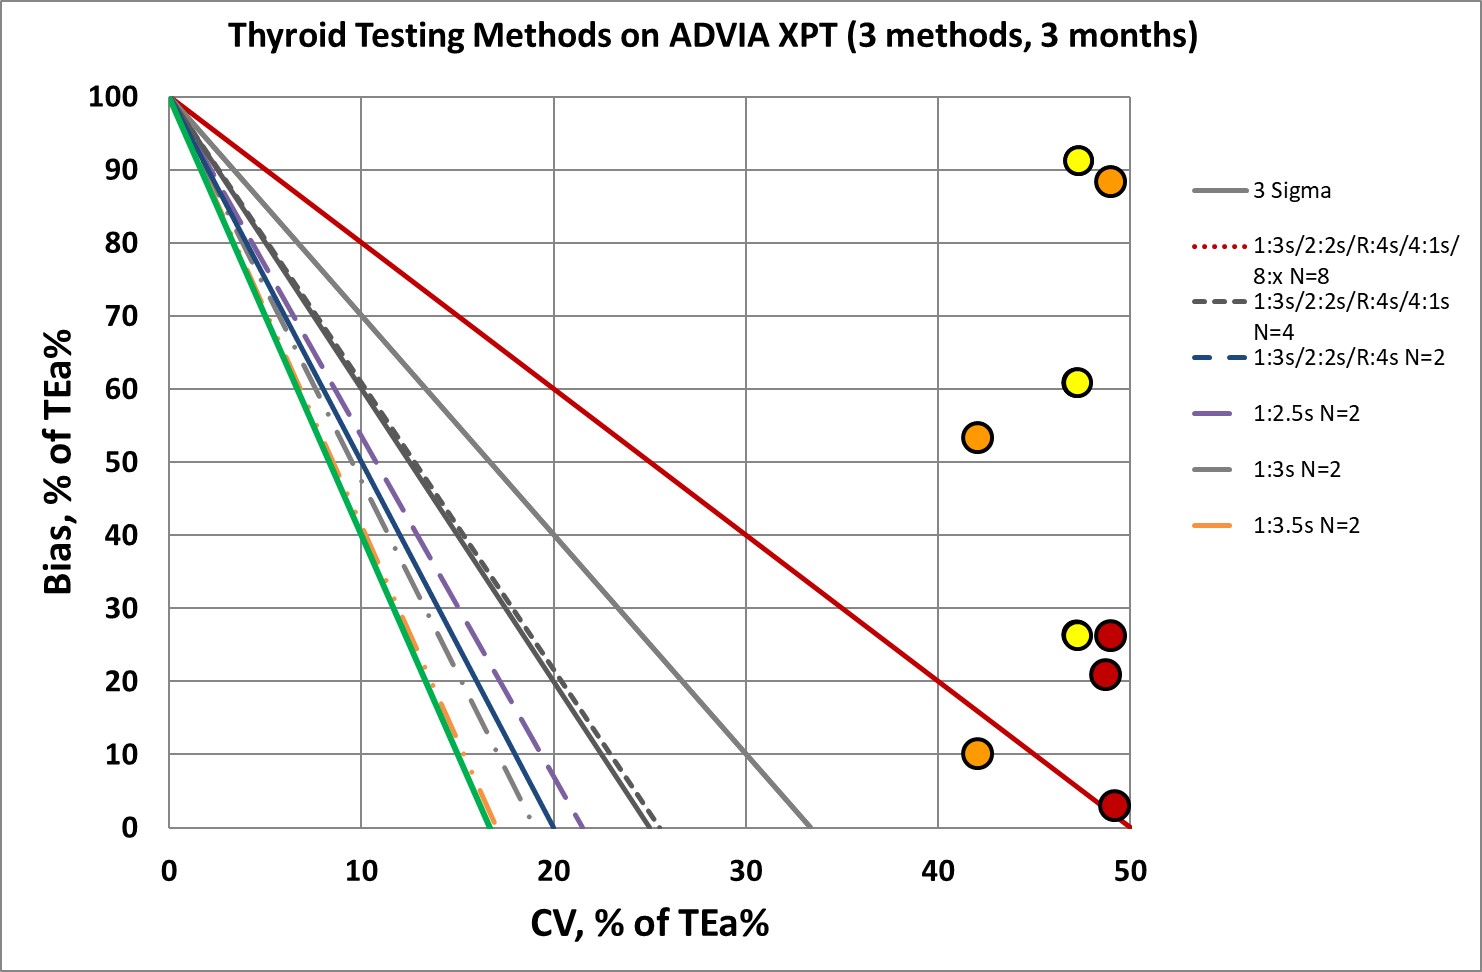
For most of these points, we will need the maximum "Westgard Rules" with 8 control measurements per run. Put bluntly, there is no practical statistical quality control procedure that can help. There aren't enough "Westgard rules" to keep some of these methods in control. If we would go further to determine QC frequency using Sigma-metrics, we would find that we can't afford to run QC often enough to properly monitor these methods.
Conclusion
Interestingly, the authors did not conclude what do think about these very low Sigma metric values. They did stress however that their EQA results were acceptable:
"Our EQAS results for the three months showed two thirds of good performances for the three thyroid function testing parameters are summarized....The consistent analytical performance of T4 was good for all three months of study. Our lab sigma metrics were below three sigmas."
This highlights a growing problem: EQAS results may appear to be fine, but when placed into the context of imprecision and the allowable total error, the method is unacceptable. We cannot rely on EQAS results alone to determine the acceptability of the method. We need to use Sigma-metrics to assess the overall performance of the method.