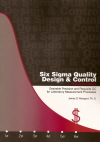
Sigma Metric Analysis
Erba XL 640 in India
A recent inquiry asked about what to do with poor Sigma performance. After further analysis of an Erba XL 640 instrument, it brought to light some unhappy reality: there may be some instruments out there that are quite bad.
Sigma metric analysis of an Erba XL 640
February 2020
Updated June 2020
Sten Westgard, MS
NOTE: At the request of the diagnostic manufacturer of the Erba XL instrument, Westgard QC is working to provide confirmatory or contrary evidence of performance. One individual case study cannot be considered definitive, for higher confidence in a judgment on perofrmance, you need several similar findings.
 |
The key reference works the provide the foundation for this analysis are Basic Method Validation, 4th Edition and Six Sigma QC Design and Control, 2nd Edition. |  |
The key reference works the provide the foundation for this analysis are Basic Method Validation, 4th Edition and Six Sigma QC Design and Control, 2nd Edition.
Recently, a laboratory in India asked for assistance. Specifically, they wondered what to do when their assays are performing below 3 Sigma. At their request, they wanted to remain anonymous. But they were willing to share their data.
We often see studies in the literature from the elite institutions, heralding exemplary, even outstanding, performance. Our conferences, our trade journals, paint an almost uniformly glowing picture of all instruments and methods that are offered on the marketplace.
There is a much different reality for many more labs in the world. There is a gap in quality every bit as glaring as the inequality gap we discuss in economies.
The raw data of imprecision and bias
"We use Transasia Erba XL640 analyzer. The bias is taken from the EQAS by CMC, [collected] on a monthly basis. I tried to understand bias but i couldnt trace the answer. Even if the Bias is 0, some sigma values are still lower. Our CV is high for all parameters. Our Analyzer is 5y old and there are budget constraints in a setup where we work."
"Now this machine is 5y old and we are about to replace this...ours is a budget constraint setup and we cannot get administration support as much as we do require. I am struggling with these basic issues. The service engineers do visit but barely they do anything to fix the bugs. Everything is money and around money in terms of business. Here, QC is not a priority....And we do lack guidance on how to improve our lab. Only guidance we get is from those vendors who push their products in to the lab. I am forced to ignore quality aspects and learning to compromise, Sir....[regarding other labs using XL640] strangely they wont reveal their performance of methods and QC data. Its common attitude in our place."
Let's stipulate that this is an older instrument, in a poorly resourced laboratory, with staff not fully or properly trained in QC. So this performance may not reflect the XL 640 in the best light. Nevertheless, this performance may be far more common in laboratories around the world than the studies we see in the journals, where new instruments are being tested in pristine environments, by staff who are among the best in their field, led by the most elite laboratory professionals who garner the lion's share of our journal pages.
XL 640 performance data
| Analyte | Method principle |
bias% | Level 1-CV | Level 2-CV |
| GLUCOSE | GOD-POD | 6.3 | 6.1 | 4.2 |
| UREA | UREASE-GLDH | 16.7 | 11.3 | 4.8 |
| CREATININE | JAFFES KINETIC | 2.5 | 6.6 | 4.6 |
| T.BILIRUBIN | JENDRASSIK GROF | 12.5 | 9.7 | 5.4 |
| T-PROTEIN | BIURET | 9.6 | 4 | 3.1 |
| ALBUMIN | BCG | 0 | 4 | 3.4 |
| CALCIUM | ARSENAZO | 0 | 22.9 | 19.6 |
| PHOSPHORUS | COLORIME | 29 | 27.7 | 11.7 |
| URIC ACID | ENZYMATIC | 59 | 7 | 2.2 |
| SODIUM | ISE | 3 | 1.3 | |
| POTASSIUM | ISE | 2.6 | 2.2 | |
| CHLORIDE | ISE | 11.2 | 3.5 | |
| ALT | UV KINETIC | 22.5 | 7.6 | 5.9 |
| ALP | PNP AMP KINETIC | 2.1 | 3.6 | 2.4 |
| AMYLASE | CNPG3 | 27 | 2.8 | 2.9 |
Now, let us apply the most forgiving performance specifications. We're not trying to use the latest EFLM performance specifications, as derived from the EuBIVAS biological variation database, nor the Ricos 2014 performance specifications; nor the proposed CLIA 2019 goals. We'll be using the current 1992 CLIA goals.
Note also that while for most of the tests we have two estimates of imprecision, we only have one of bias. So we will make Sigma metric estimates using the bias twice. For a few analytes, there is only one level of imprecision measured.
Sigma-metrics of Erba XL 640
Remember the equation for Sigma metric is (TEa - bias) / CV and bias here is taken as an absolute.
For albumin at level 1, the Sigma-metric is (10 - 0 ) / 2.5 = 2.5
For ALT at level 1, the Sigma-metric is (20 - 22.5 ) / 7.6 = negative
This is one of those cases where the bias being measured sometimes exceeds the entire allowable total error. This draws the Sigma-metric down into negative territory, and as that point the exact number is irrelevant. What the calculation has told you is the assay is not aiming at the right target.
|
Erba XL 640 CLIA Goals Sigma metrics |
||||
|
TEST |
TEa |
% Bias |
CV |
Sigma |
|
Albumin |
10 |
0.0 |
4.0 |
2.5 |
|
10 |
0.0 |
3.4 |
2.9 |
|
|
Alk Phos |
30 |
2.1 |
3.6 |
>6 |
|
30 |
2.1 |
2.4 |
>6 |
|
|
ALT |
20 |
22.5 |
7.6 |
negative |
|
20 |
22.5 |
5.9 |
negative |
|
|
Amylase |
30.00 |
27.0 |
2.8 |
1.1 |
|
30.00 |
27.0 |
2.9 |
1.0 |
|
|
Bilirubin, Total |
20.00 |
12.5 |
9.7 |
0.8 |
|
20.00 |
12.5 |
5.4 |
1.4 |
|
|
Calcium |
11 |
0.0 |
22.9 |
0.5 |
|
11.00 |
0.0 |
19.6 |
0.6 |
|
|
Chloride |
5 |
11.2 |
3.5 |
negative |
|
Creatinine |
15.00 |
2.5 |
6.6 |
1.9 |
|
15.00 |
2.5 |
4.6 |
2.7 |
|
|
Glucose |
10.00 |
6.3 |
6.1 |
0.6 |
|
5.80 |
6.3 |
4.2 |
negative |
|
|
Phosphorous |
10.70 |
29.0 |
27.7 |
negative |
|
10.70 |
29.0 |
11.7 |
negative |
|
|
Potassium |
25 |
2.6 |
2.2 |
>6 |
|
Protein, Total |
10.00 |
9.6 |
4.0 |
0.1 |
|
10.00 |
9.6 |
3.1 |
0.1 |
|
|
Sodium |
4 |
3.0 |
1.3 |
0.8 |
|
Urea Nitrogen |
9.00 |
16.7 |
11.3 |
negative |
|
9.00 |
16.7 |
4.8 |
negative |
|
|
Uric Acid |
17.00 |
59.0 |
7.0 |
negative |
|
17.00 |
59.0 |
2.2 |
negative |
|
Visual display of Sigma-metric Performance
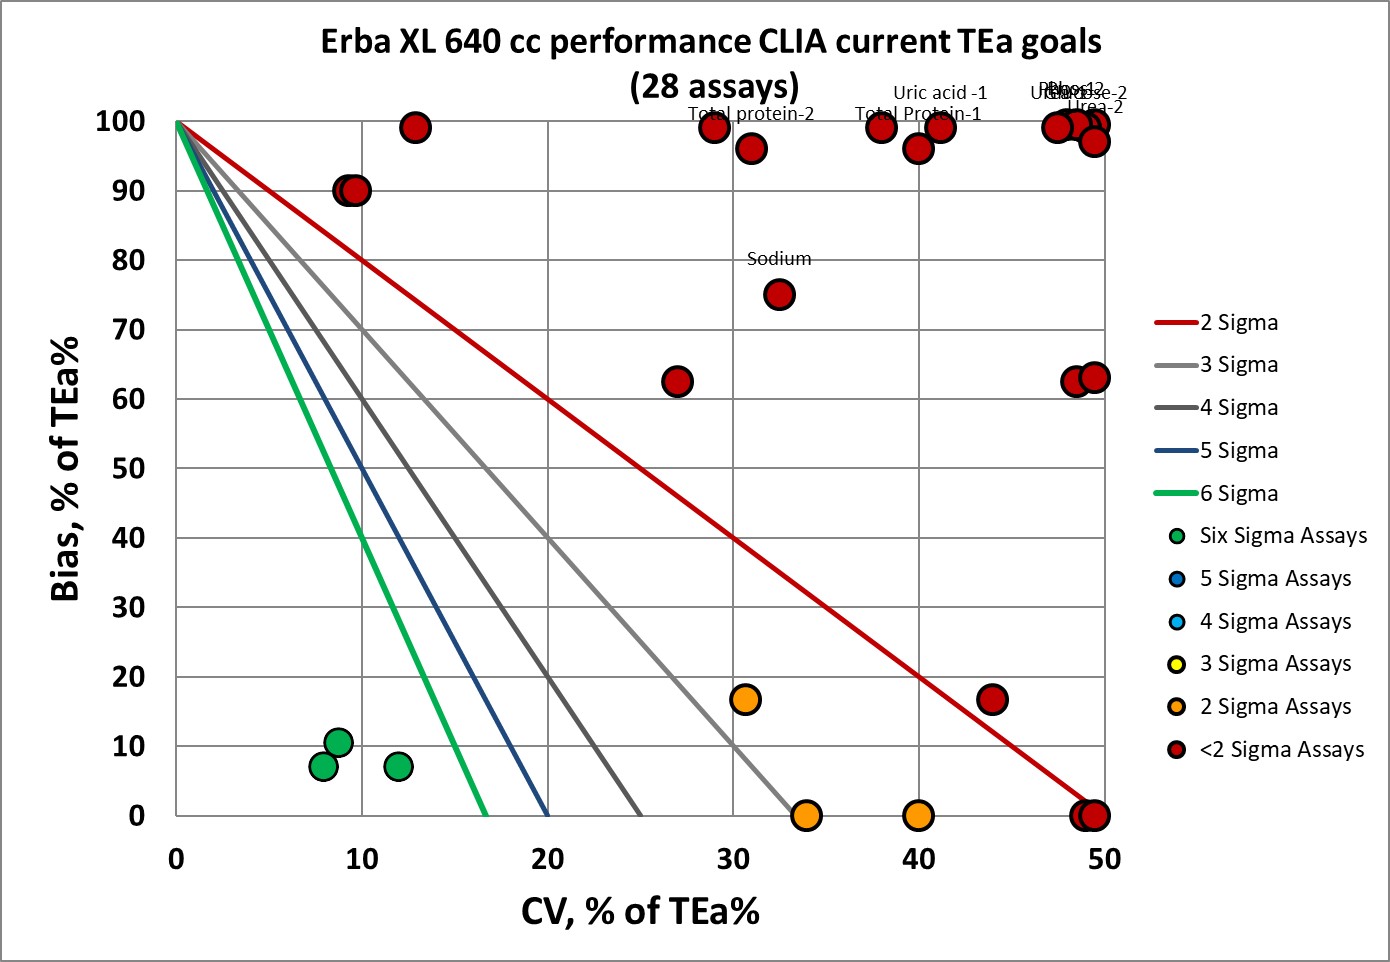
Nearly 90% of the assay performance measured here are below 3 Sigma, what we typically consider the minimally acceptable performance.
This may not be the very worst instrument performance we've seen in 25 years, but it's at the very least quite close to the worst.
Conclusion
After discussions with the laboratory, and encouragement that they should get better service from their vendors, there was a bit of happier news:
"I spoke to them and got a response. They came and replaced few cuvettes and changed some programmes. We are using erba controls for IQC on Erba machine, as we cant buy Biorad QC material. This is giving the problem with frequently changing means with frequent change of lots of these first party controls! Dear sir, My intention is to give quality reporting, not to blame anyone. If i start doing the blame game that will backfire on me, in the system we live and work. But you should use my example to point out the same,anonymously."
It's good to see that some technical improvements were started. But disappointing to think that this data is built on manufacturer (1st opinion) controls, because those are typically giving optimistic assessments. What would true 3rd party controls reveal of this performance. Finally, it's quite discouraging to think that even a customer feels they are not empowered to ask for better performance of the vendor, of the instrument, and even of their management.
Sadly, I think this example is more reflective of what many labs in the world experience for their QC and quality. In the literature, in the customer testimonials, in the conference posters and plenaries, we see the performance and experience of the 1%. The rest of the world doesn't get the same level of support and quality.
JUNE 2020 UPDATE: At the request of the Erba manufacturer, we have been requested to withhold definitive judgment. It is possible, that this is a singular incident. One bad instrument or bad situation or combination of bad factors that result in bad performance. We are awaiting additional data from other laboratories and customers to see if performance elsewhere differs from what was seen here.