Sigma Metric Analysis
Dirui CS-T240 in Ethiopia
A recent paper examined the frequency of errors occurring in the pre-analytical, analytical and post-analytical phases of testing. It raises the question: what do you do when your Sigma is zero?
Sigma metric analysis of a Dirui CS-T240 in Ethiopia
May 2021
Sten Westgard, MS
 |
The key reference works the provide the foundation for this analysis are Basic Method Validation, 4th Edition and Six Sigma QC Design and Control, 2nd Edition. |  |
What is the gap in quality between the developed and developing world? We know that there are resource challenges in developing world labs that the developed world labs don't have to face. We know there are disparities in training of laboratory staff. What we don't know, until now, is what the differences in analytical quality might be. But one recent paper did just that:
Total Clinical Chemistry Laboratory Errors and Evaluation of the Analytical Quality Control Using Sigma Metric for Routine Clinical Chemistry Tests, Mulugeta Teshome, Abebaw Worede, Daniel Asmelash, Jounral of Multidisciplinary Healthcare 2021:14 125-136.
Here is an admirable effort to catalog the errors in a laboratory - specifically, the Dessie Comprehensive Specialized Hospital Clinical Chemistry Laboratory in Dessie, Ethiopia - in all phases of the total testing process. So the paper is rich with Sigma metrics and stats on pre-analytical and post-analytical quality. The authors also performed an analytical Sigma-metric analysis of their instrument: a DIRUI CS-T240 chemistry analyzer.
The imprecision and bias data
"Analytical quality control performance for routinely tested 14 analytes... was evaluated using a sigma metric quality monitoring tool. The TEa source for each of the analytes was CLIA. The bias of all analytes except LDL was calculated using the performance of the Laboratory in the EQC and the peer groups mean. Since LDL was not properly documented in the EQC documentation chart, its bias was calculated using the observed mean from the daily IQC and the target value from the manufacturer, The CV for all analytes was calculated from the observed mean and SD of the daily IQC in the study period....The estimates of sigma metrics were optimistic because the quality control materials were not from third parties."
CS-T240 performance data
| TEST | TEa Source | TEa | % Bias | CV |
| Albumin | CLIA | 10 | 9.9 | 7.2 |
| Albumin | 10% | 10 | 9.9 | 6.2 |
| Alk Phos | CLIA | 30 | 2.7 | 7.0 |
| Alk Phos | 30% | 30 | 2.7 | 7.2 |
| ALT | CLIA | 20 | 4.2 | 9.6 |
| ALT | 20.0% | 20 | 4.2 | 7.0 |
| AST | CLIA | 20.00 | 7.4 | 10.6 |
| AST | 20.0% | 20.00 | 7.4 | 6.0 |
| Bilirubin, Total | CLIA 20% or | 20.00 | 9.9 | 7.4 |
| Bilirubin, Total | 6.84 umol/L | 20.00 | 9.9 | 6.0 |
| Cholesterol | CLIA | 10 | 4.0 | 7.6 |
| Cholesterol | 10% | 10 | 4.0 | 7.2 |
| Creatinine | CLIA 15% or | 15.00 | 5.0 | 7.2 |
| Creatinine | 26.52 umol/L | 15.00 | 5.0 | 6.6 |
| Glucose | CLIA 10% or | 10.00 | 5.4 | 7.6 |
| Glucose | 0.333 mmol/L | 10.00 | 5.4 | 5.6 |
| HDL | CLIA | 30.00 | 18.7 | 18.9 |
| HDL | 30% | 30.00 | 18.7 | 10.8 |
| LDL | CLIA | 20.00 | 19.8 | 6.0 |
| LDL | 20% | 20.00 | 2.6 | 18.4 |
| Protein, Total | CAP | 10.00 | 6.3 | 5.9 |
| Protein, Total | 10% | 10.00 | 6.3 | 4.2 |
| Triglycerides | CLIA | 25.00 | 13.7 | 11.8 |
| Triglycerides | 25% | 25.00 | 13.7 | 16.0 |
| Urea Nitrogen | CLIA 9% or | 9.00 | 7.0 | 8.6 |
| Urea Nitrogen | 0.7142 mmol/L | 9.00 | 7.0 | 6.8 |
| Uric Acid | CLIA | 17.00 | 6.3 | 8.3 |
| Uric Acid | 17% | 17.00 | 6.3 | 5.7 |
Now, let's note that the CLIA goals from 1992 are some forgiving performance specifications (not the very most permissive goals, mind you, that would require using Rilibaek or Russia's goals). But even then, look at the biases and the CVs. These are numbers that are higher than we're used to seeing - for those of us in the developed world.
Note also that while for most of the tests we have two estimates of imprecision, we only have one of bias. So we will make Sigma metric estimates using the bias twice.
Sigma-metrics of CS-T240
Remember the equation for Sigma metric is (TEa - bias) / CV and bias here is taken as an absolute.
For albumin at level 1, the Sigma-metric is (10 - 9.9 ) / 7.2 = 0.014
If we round this to one decimal place, we've got zero sigma.
Here's the rest of the metrics:
| TEST | TEa Source | TEa | % Bias | CV | Sigma |
| Albumin | CLIA | 10 | 9.9 | 7.2 | 0.0 |
| Albumin | 10% | 10 | 9.9 | 6.2 | 0.0 |
| Alk Phos | CLIA | 30 | 2.7 | 7.0 | 3.9 |
| Alk Phos | 30% | 30 | 2.7 | 7.2 | 3.8 |
| ALT | CLIA | 20 | 4.2 | 9.6 | 1.6 |
| ALT | 20.0% | 20 | 4.2 | 7.0 | 2.3 |
| AST | CLIA | 20.00 | 7.4 | 10.6 | 1.2 |
| AST | 20.0% | 20.00 | 7.4 | 6.0 | 2.1 |
| Bilirubin, Total | CLIA 20% or | 20.00 | 9.9 | 7.4 | 1.4 |
| Bilirubin, Total | 6.84 umol/L | 20.00 | 9.9 | 6.0 | 1.7 |
| Cholesterol | CLIA | 10 | 4.0 | 7.6 | 0.8 |
| Cholesterol | 10% | 10 | 4.0 | 7.2 | 0.8 |
| Creatinine | CLIA 15% or | 15.00 | 5.0 | 7.2 | 1.4 |
| Creatinine | 26.52 umol/L | 15.00 | 5.0 | 6.6 | 1.5 |
| Glucose | CLIA 10% or | 10.00 | 5.4 | 7.6 | 0.6 |
| Glucose | 0.333 mmol/L | 10.00 | 5.4 | 5.6 | 0.8 |
| HDL | CLIA | 30.00 | 18.7 | 18.9 | 0.6 |
| HDL | 30% | 30.00 | 18.7 | 10.8 | 1.0 |
| LDL | CLIA | 20.00 | 19.8 | 6.0 | 0.0 |
| LDL | 20% | 20.00 | 2.6 | 18.4 | 0.9 |
| Protein, Total | CAP | 10.00 | 6.3 | 5.9 | 0.6 |
| Protein, Total | 10% | 10.00 | 6.3 | 4.2 | 0.9 |
| Triglycerides | CLIA | 25.00 | 13.7 | 11.8 | 1.0 |
| Triglycerides | 25% | 25.00 | 13.7 | 16.0 | 0.7 |
| Urea Nitrogen | CLIA 9% or | 9.00 | 7.0 | 8.6 | 0.2 |
| Urea Nitrogen | 0.7142 mmol/L | 9.00 | 7.0 | 6.8 | 0.3 |
| Uric Acid | CLIA | 17.00 | 6.3 | 8.3 | 1.3 |
| Uric Acid | 17% | 17.00 | 6.3 | 5.7 | 1.9 |
And remember, these are the metrics coming from the optimistic manufacturer provided controls. 3rd party controls, a truly independent measurement, might find worse metrics, if that's even possible.
Visual display of Sigma-metric Performance
If the table of numbers wasn't disturbing enough, take a look at the visual:
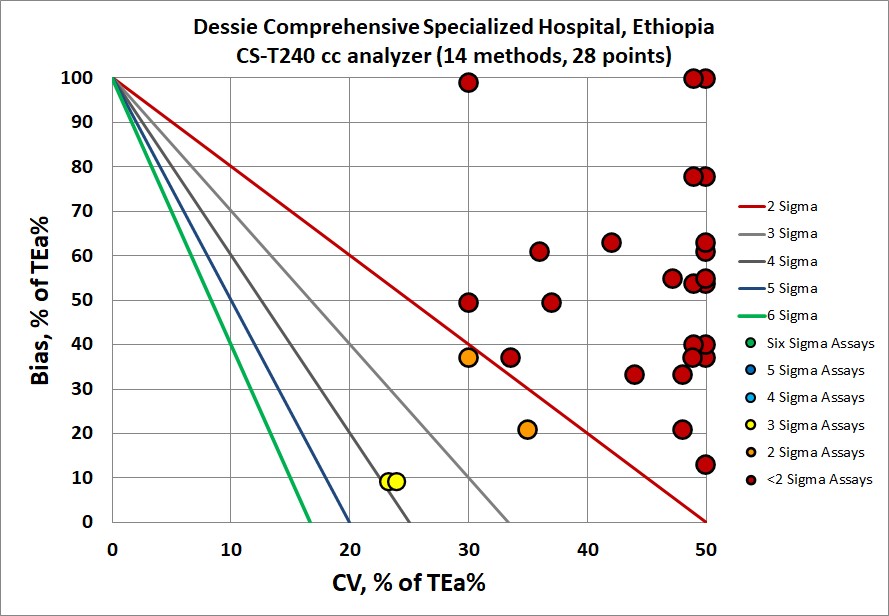
There's nothing "in the bull's eye" here. Everything seems to be missing the target.
Last year, I noted an example where I thought it might be worst instrument performance I've seen in 25 years, but this one here might be worse still.
QC Implications of CS-T240 performance
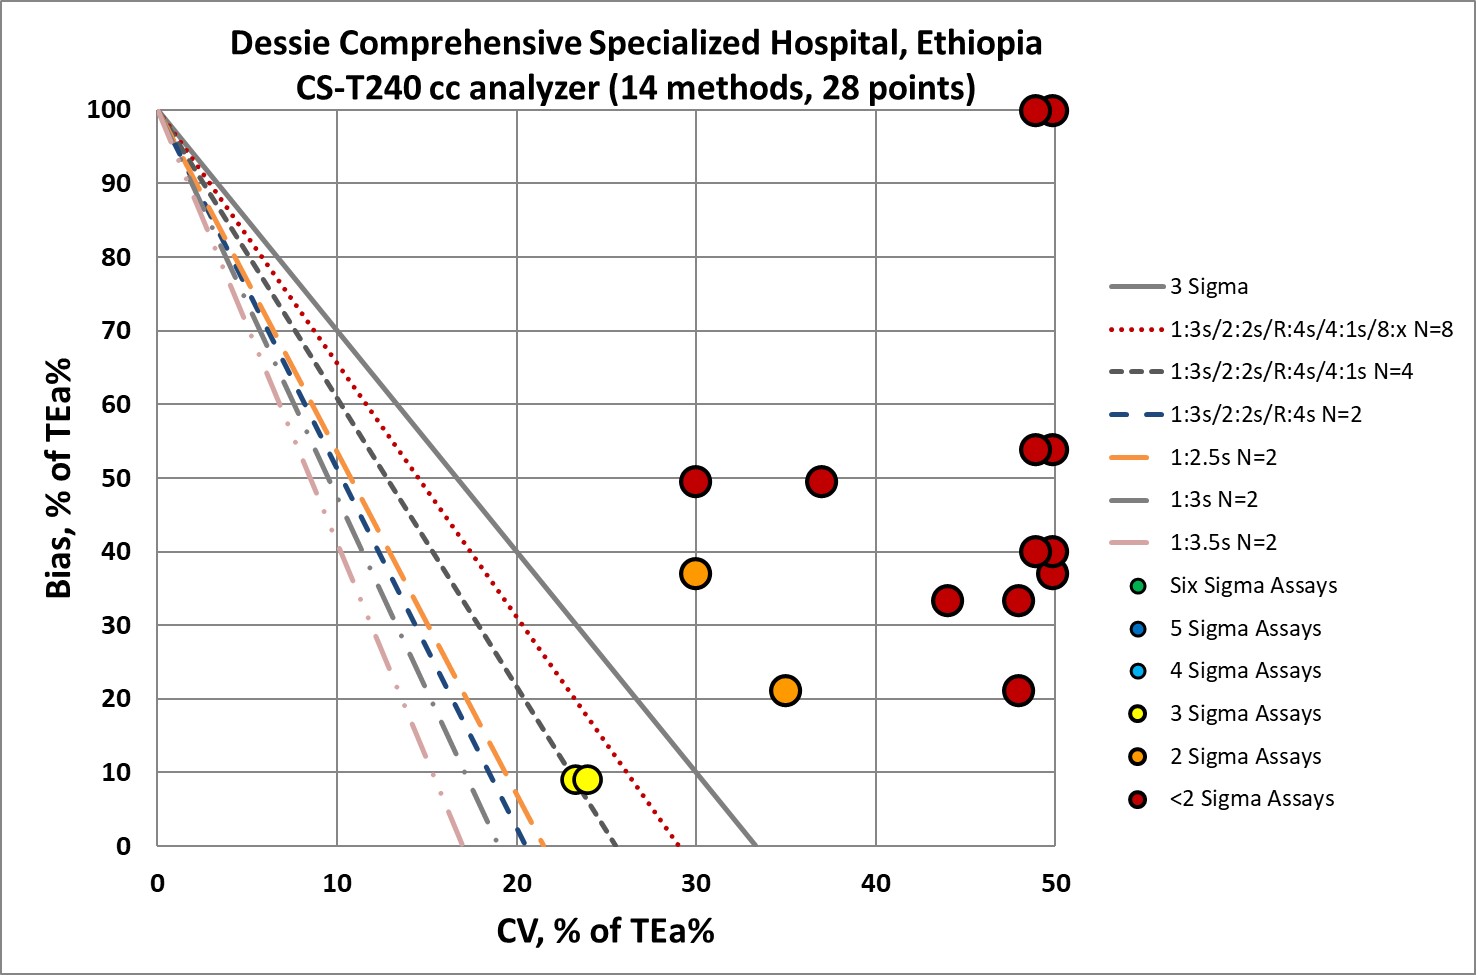
I didn't really need to see this graph - I could already tell you that with the Sigma metrics so low, the "Westgard Rules" are not going to be enough. Yes, all the "Westgard Rules" should be applied. Yes, as many control measurements as possible should be made. Yes, all efforts should be made to perform regular maintenance and try to improve all the pre-analytical steps that come before the analytical measurement. But it may be that all that work is still not enough. Is the instrument design just too poor? Or the reagents? Or some other part of the laboratory environment?
Conclusion
The study found errors everywhere in the total testing process, and even concluded that the analytical phase had the least amount of errors that they were experiencing. Horrifying to think that a laboratory with zero Sigma methods has worse problems than that.
I believe it's not worthwhile to blame the laboratory for this performance, and possibly not even the manufacturer. In circumstances where there are significant resource challenges, laboratories with the traditional instrument system may find that the performance cannot live up to manufacturer claims.
For the laboratory, in a scenario where they probably can't spend enough money to improve or replace their instrument, they should be very careful about how they release test results. Cautioning clinicians about the errors present in the results - best explained through the use of the Reference Change Value or Critical Difference - is the best lipstick they can put on this pig. It would be very worthwhile to see if this instrument is behaving as advertised (does it meet claims? do other labs with the instrument experience the same performance?), and if not, fixes should be demanded or a replacement. I find it hard to believe that a diagnostic manufacturer can intend to deliver this kind of performance - but vendors keep surprising me.
It's tragic that labs in the developing world have to face even harder problems with their analytical testing. While the "1%" of labs get to reduce their QC effort, save on expenditures, and dominate the posters, conferences, and publications, the rest of the world doesn't get the same level of support and quality.