Sigma Metric Analysis
Dimension Rxl in India
Six Sigma papers are not always perfect. And neither are instruments. A recent paper made a few mistakes in calculations. The true calculations make the conclusions even more stark about the Dimension RxL
Sigma metric analysis of a Dimension RxL in India
May 2021
Sten Westgard, MS
 |
The key reference works the provide the foundation for this analysis are Basic Method Validation, 4th Edition and Six Sigma QC Design and Control, 2nd Edition. |  |
Let me start by apologizing. The analytical Sigma-metric equation is often displayed, in a shorthand, as [TEa - Bias% ] / CV. But that misses out on the important requirement that the Bias must be absolute. If the bias is negative that does not mean that the numerator is actually enlarged by bias.
Let's show a simple example. Given a TEa of 10, a Bias of -5, and a CV of 5, here is the proper calculation:
Sigma-metric = [10 - |5|] / 5 = 5 / 5 = 1 Sigma
If you did this calculation without making the bias absolute:
Sigma-metric = [10 - (-5)] / 5 = 15 / 5 = 3 Sigma
As you can see, that arithmetic sign can make a big difference.
Why do we take the absolute? Partly because we are planning for the worst-case scenario. We don't like to assume that the bias will cancel out some of the imprecision of the method (some other approaches to Sigma metric do this). We prefer to plan for the worst, then on the rare cases where the worst doesn't occur, we're much better off.
But it's understandable if some labs don't catch that part about converting the bias to an absolute number, and accidentally add their bias to the TEa, and come up with significantly higher Sigma metrics than are correct.
All that is prelude to a recent paper where this mistake was made:
Analysis of performance of clinical biochemistry laboratory using Sigma metrics and Quality Goal Index, Parul Goel, Gagandeep Malik, Suvarna Prasad, Isha Rani, Sunita Manhas, Kapil Goel, Practical Laboratory Medicine, 23 (2021) e00195.
This study focuses on the performance of the Siemens Dimension RxL at MMIMSR (Maharashi Markandeshwar Institute of Medical SCiences and Research), Mullana, India
The imprecision and bias data of Siemens Dimension Rxl
The data collection was ideal." [Q]uality Control data was obtained from Internal Quality Control of Randox Clinical Chemistry....Bias % calculated for each parameter by using the Monthly EQAS report from CMC, Vellore."
Siemens Dimension Rxl performance data
| TEST | TEa Source | TEa | % Bias | CV | Sigma |
| Albumin | CLIA 10% | 10 | 5.8 | 4.3 | 1.0 |
| Albumin | 10 | 5.8 | 4.4 | 1.0 | |
| Alk Phos | CLIA 30% | 30 | 0.6 | 4.3 | 6.8 |
| Alk Phos | 30 | 0.6 | 4.6 | 6.4 | |
| ALT | CLIA 20% | 20 | 10.7 | 6.6 | 1.4 |
| ALT | 20 | 10.7 | 5.1 | 1.8 | |
| AST | CLIA 20% | 20 | 2.3 | 6.4 | 2.8 |
| AST | 20 | 2.3 | 3.1 | 5.8 | |
| Bilirubin, Total | CLIA 20% | 20 | 0.1 | 4.2 | 4.7 |
| Bilirubin, Total | 20 | 0.1 | 6.5 | 3.1 | |
| Calcium | CLIA 1 mg/dL | 11.40 | 6.2 | 4.3 | 1.2 |
| Calcium | 8.10 | 6.2 | 2.9 | 0.6 | |
| Cholesterol | CLIA 10% | 10 | 15.6 | 3.3 | -1.7 |
| Cholesterol | 10 | 15.6 | 2.6 | -2.2 | |
| Creatinine | CLIA 15% | 15.00 | 2.9 | 6.0 | 2.0 |
| Creatinine | 15.00 | 2.9 | 3.5 | 3.5 | |
| Glucose | CLIA 10% | 10.00 | 1.1 | 3.7 | 2.4 |
| Glucose | 10.00 | 1.1 | 3.0 | 3.0 | |
| HDL | CLIA 30% | 30.00 | 7.8 | 2.9 | 7.5 |
| HDL | 30.00 | 7.8 | 4.5 | 4.9 | |
| Protein, Total | CLIA 10% | 10.00 | 0.9 | 3.5 | 2.7 |
| Protein, Total | 10.00 | 0.9 | 2.5 | 3.7 | |
| Triglycerides | CLIA 25% | 25.00 | 7.6 | 4.2 | 4.1 |
| Triglycerides | 25.00 | 7.6 | 3.4 | 5.0 | |
| Urea Nitrogen | CLIA 9% | 9.00 | 0.8 | 6.02 | 1.4 |
| Urea Nitrogen | 9.00 | 0.8 | 4.99 | 1.6 | |
| Uric Acid | CLIA 17% | 17.00 | 3.4 | 4.7 | 2.9 |
| Uric Acid | 17.00 | 3.4 | 5.0 | 2.7 |
The CLIA goals are the original 1992 goals, typically thought of as permissive.
Note also that while for most of the tests we have two estimates of imprecision, we only have one of bias. So we will make Sigma metric estimates using the bias twice.
Sigma-metrics of of Siemens Dimension Rxl
| TEST | TEa Source | TEa | % Bias | CV |
| Albumin | CLIA 10% | 10 | 5.8 | 4.3 |
| Albumin | 10 | 5.8 | 4.4 | |
| Alk Phos | CLIA 30% | 30 | 0.6 | 4.3 |
| Alk Phos | 30 | 0.6 | 4.6 | |
| ALT | CLIA 20% | 20 | 10.7 | 6.6 |
| ALT | 20 | 10.7 | 5.1 | |
| AST | CLIA 20% | 20 | 2.3 | 6.4 |
| AST | 20 | 2.3 | 3.1 | |
| Bilirubin, Total | CLIA 20% | 20 | 0.1 | 4.2 |
| Bilirubin, Total | 20 | 0.1 | 6.5 | |
| Calcium | CLIA 1 mg/dL | 11.40 | 6.2 | 4.3 |
| Calcium | 8.10 | 6.2 | 2.9 | |
| Cholesterol | CLIA 10% | 10 | 15.6 | 3.3 |
| Cholesterol | 10 | 15.6 | 2.6 | |
| Creatinine | CLIA 15% | 15.00 | 2.9 | 6.0 |
| Creatinine | 15.00 | 2.9 | 3.5 | |
| Glucose | CLIA 10% | 10.00 | 1.1 | 3.7 |
| Glucose | 10.00 | 1.1 | 3.0 | |
| HDL | CLIA 30% | 30.00 | 7.8 | 2.9 |
| HDL | 30.00 | 7.8 | 4.5 | |
| Protein, Total | CLIA 10% | 10.00 | 0.9 | 3.5 |
| Protein, Total | 10.00 | 0.9 | 2.5 | |
| Triglycerides | CLIA 25% | 25.00 | 7.6 | 4.2 |
| Triglycerides | 25.00 | 7.6 | 3.4 | |
| Urea Nitrogen | CLIA 9% | 9.00 | 0.8 | 6.02 |
| Urea Nitrogen | 9.00 | 0.8 | 4.99 | |
| Uric Acid | CLIA 17% | 17.00 | 3.4 | 4.7 |
| Uric Acid | 17.00 | 3.4 | 5.0 |
Remember the equation for Sigma metric is (TEa - bias) / CV and bias should be taken as an absolute.
For albumin at level 1, the Sigma-metric is (10 - 5.8 ) / 4.3 = 0.98
If we round this to one decimal place, we've got 1 sigma.
Here are the rest of the metrics:
| TEST | TEa Source | TEa | % Bias | CV | Sigma |
| Albumin | CLIA 10% | 10 | 5.8 | 4.3 | 1.0 |
| Albumin | 10 | 5.8 | 4.4 | 1.0 | |
| Alk Phos | CLIA 30% | 30 | 0.6 | 4.3 | >6 |
| Alk Phos | 30 | 0.6 | 4.6 | >6 | |
| ALT | CLIA 20% | 20 | 10.7 | 6.6 | 1.4 |
| ALT | 20 | 10.7 | 5.1 | 1.8 | |
| AST | CLIA 20% | 20.00 | 2.3 | 6.4 | 2.8 |
| AST | 20.00 | 2.3 | 3.1 | 5.8 | |
| Bilirubin, Total | CLIA 20% | 20.00 | 0.1 | 4.2 | 4.7 |
| Bilirubin, Total | 20.00 | 0.1 | 6.5 | 3.1 | |
| Calcium | CLIA 1 mg/dL | 11.40 | 6.2 | 4.3 | 1.2 |
| Calcium | 8.10 | 6.2 | 2.9 | 0.6 | |
| Cholesterol | CLIA 10% | 10 | 15.6 | 3.3 | negative |
| Cholesterol | 10 | 15.6 | 2.6 | negative | |
| Creatinine | CLIA 15% | 15.00 | 2.9 | 6.0 | 2.0 |
| Creatinine | 15.00 | 2.9 | 3.5 | 3.5 | |
| Glucose | CLIA 10% | 10.00 | 1.1 | 3.7 | 2.4 |
| Glucose | 10.00 | 1.1 | 3.0 | 3.0 | |
| HDL | CLIA 30% | 30.00 | 7.8 | 2.9 | 7.5 |
| HDL | 30.00 | 7.8 | 4.5 | 4.9 | |
| Protein, Total | CLIA 10% | 10.00 | 0.9 | 3.5 | 2.7 |
| Protein, Total | 10.00 | 0.9 | 2.5 | 3.7 | |
| Triglycerides | CLIA 25% | 25.00 | 7.6 | 4.2 | 4.1 |
| Triglycerides | 25.00 | 7.6 | 3.4 | 5.0 | |
| Urea Nitrogen | CLIA 9% | 9.00 | 0.8 | 6.02 | 1.4 |
| Urea Nitrogen | 9.00 | 0.8 | 4.99 | 1.6 | |
| Uric Acid | CLIA 17% | 17.00 | 3.4 | 4.7 | 2.9 |
| Uric Acid | 17.00 | 3.4 | 5.0 | 2.7 |
There are a lot of metrics below 3 here. Remember 3 Sigma is usually considered the minimum acceptable performance. 60% of the performance here is below 3 Sigma. 3 Sigma and below accounts for 70% of the performance. These are not numbers normally associated with a major diagnostic platform.
Visual display of Sigma-metric Performance of Siemens Dimension Rxl
If the table of numbers wasn't disturbing enough, take a look at the visual:
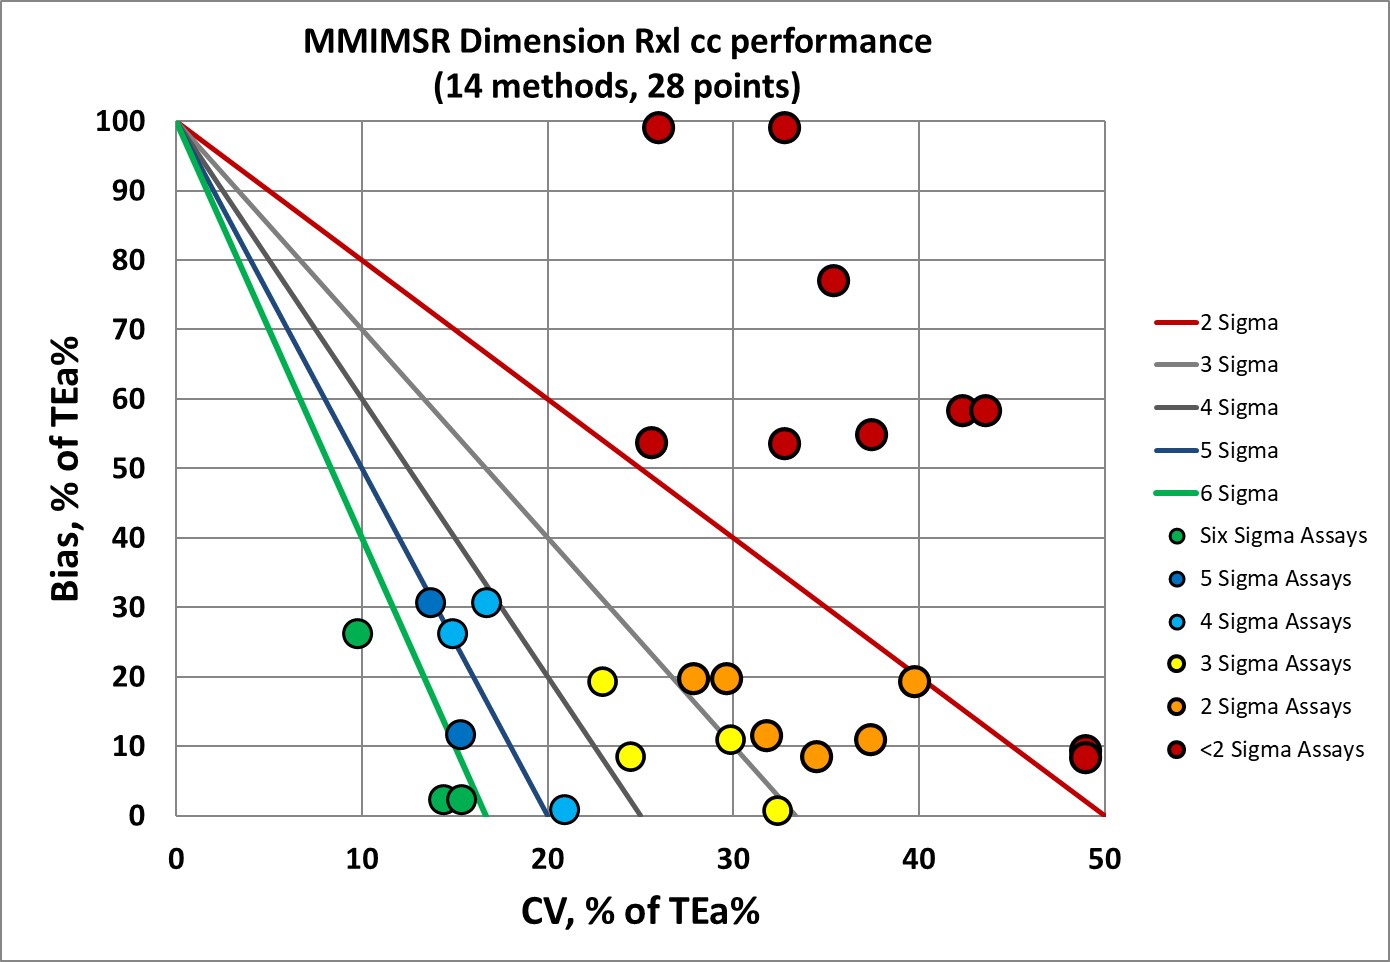
There are a handful of points in the "bull's eye" but a lot more is missing the target (about 2 points below 3 Sigma for every poin at 4 Sigma or higher.
QC Implications of CS-T240 performance
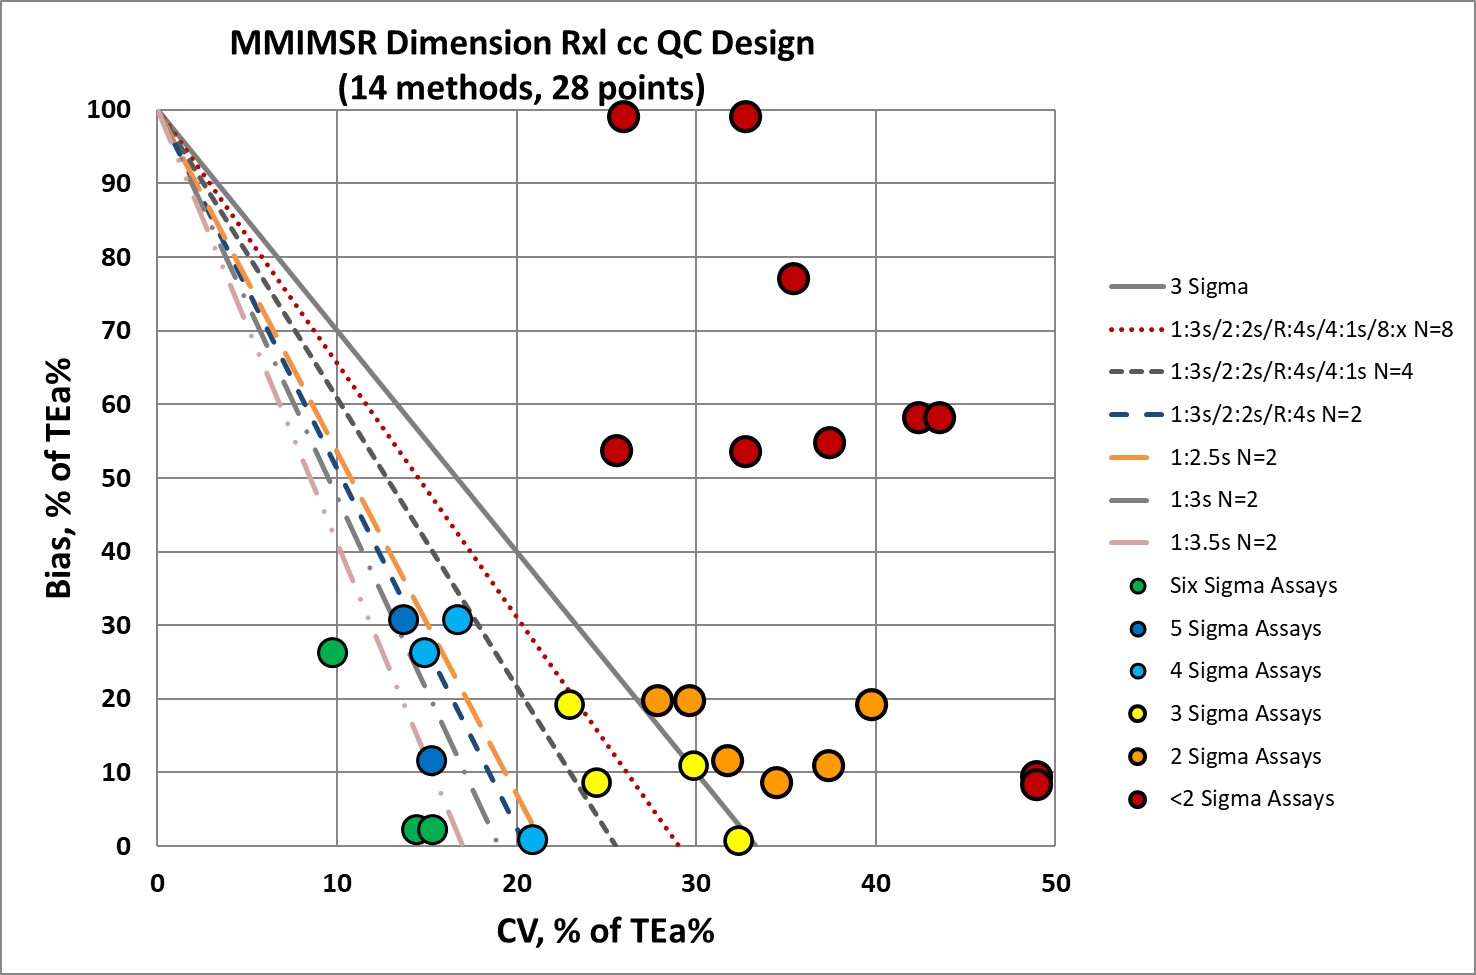
So the good news: a few analytes are going to be able to reduce the number of "Westgard Rules" that are implemented.
There's a lot more bad news: all the "Westgard Rules" should be applied for 70% of the performance. And as many control measurements should be made on those tests. Because the Westgard Rules really aren't enough to keep the methods in control. It would be better to try and improve the technical operation - or even replace the method.
At this point, I think of Dimension Rxl as an older model instrument. So this might already be slated for replacement. ?
Conclusion
For the errors in the paper calculations, I offer myself to blame. There are often times when the full discussion of the Sigma-metric equation is glossed over. We use shorthand, we give a simple overview, and the details are left for another day.
For the actual performance, that's an issue that the laboratory has to determine. Is the instrument old? Is it near the end of life? Are there reagent problems? Are there environmental, logistical, or labor shortcomings? If the manufacturer says this instrument is operating as intended, then a new instrument should definitely be sought.