Resources
QC Frequency Calculator (Run Size)
A new online tool to help you determine your QC Frequency (Run Size)
Online Calculator for QC Frequency or Run Size
James O. Westgard, Hassan Bayat, Paul Schilling, and Sten A. Westgard
July 2021
The CLSI C24-Ed4 document [1] describes a “roadmap” for planning a risk-based SQC strategy, which is defined as the “number of QC materials to measure, the number of QC results and the QC rule to use at each QC event, and the frequency of QC events.” A QC event is defined as “the occurrence of one or more QC measurements and a QC rule evaluation of the results.” For continuous production analyzers that are the workhorses of high-volume laboratories, the practical definition of QC frequency is the number of patient samples between QC events, i.e., run size.
Parvin has described a patient risk model that can be used for calculating run size [2]. The calculations, however, are not trivial, leading Yago and Alcover [3] to develop a graphical tool for single-rule SQC procedures and Bayat [4] to provide a similar tool for multi-rule procedures. We discussed the difficulties of implementing the C24-Ed4 roadmap earlier and recommended the use of graphical tools to overcome the difficulties in calculating patient risk [5]. We demonstrated the use of a Sigma Run Size Nomogram and an even simpler graphical tool, Westgard Sigma Rules with Run size, in another paper [6].
Such graphical tools are practical, but laborious. For that reason, we have developed an Internet QC Frequency Calculator to further simplify and speed up the calculations.
A beta version of that tool is now available at http://tools.westgard.com/frequency_calculator.shtml.
The user must enter information about the analyzer, test, and units, then describe the critical decision level or concentration (Xc), the quality required at Xc in the form of an allowable Total Error (TEa), and the bias and precision observed for the method. The units for these 3 terms – TEa, bias, precision - may be percent or concentration, but it is critical that all three are in the same units to calculate the Sigma-Metric for the testing process. Sigma is calculated as (TEa - |bias|)/precision, where precision can be expressed as SD or %CV, depending on the units being used.
Sigma is the key driver for determining run size, however, when the calculated sigma is greater than 6.0, a value of 6.0 is used for the “Patient Risk Sigma.” Setting Sigma to a maximum of 6.0 and setting Maximum Run Size to 1000 means that the calculator will provide the same results as the Sigma Run Size Nomogram.
Finally, the “Patient Risk Factor” is set to a default value of 1.0, which corresponds to Parvin’s MaxE(Nuf) value of 1.0 (meaning the number of erroneous patient results in the run will be a maximum of 1 if an error condition goes undetected). To consider greater risks in different applications, the risk factor can be increased up to 5. Once the necessary information has been entered, click “Calculate Results” and the run sizes will be calculated for 10 different SQC procedures, including both single-rule and multi-rules with Ns from 1 to 4.
To illustrate the use of the QC Frequency Calculator, we consider the two example applications that were provided in the C24-Ed4 document.
CLSI C24-Ed4 Calcium Example
Information for calcium is provided in Table 3 of the C24-Ed4 document [2, pp 43-45]. A goal for TEa is defined as 6%. For a concentration of 10.20 mg/dL, TEa is 0.612 mg/dL. Bias is assumed to be zero and the SD is observed to be 0.143 mg/dL. For a decision level of 12.96 mg/dL, TEa is 0.776 mg/dL and the SD is 0.1 93 mg/dL. To use the online calculator, select the “Number of Levels” as 2 (note that the online calculator can accommodate as many as 4 levels of controls), then enter the above information for the two control levels, as shown below:
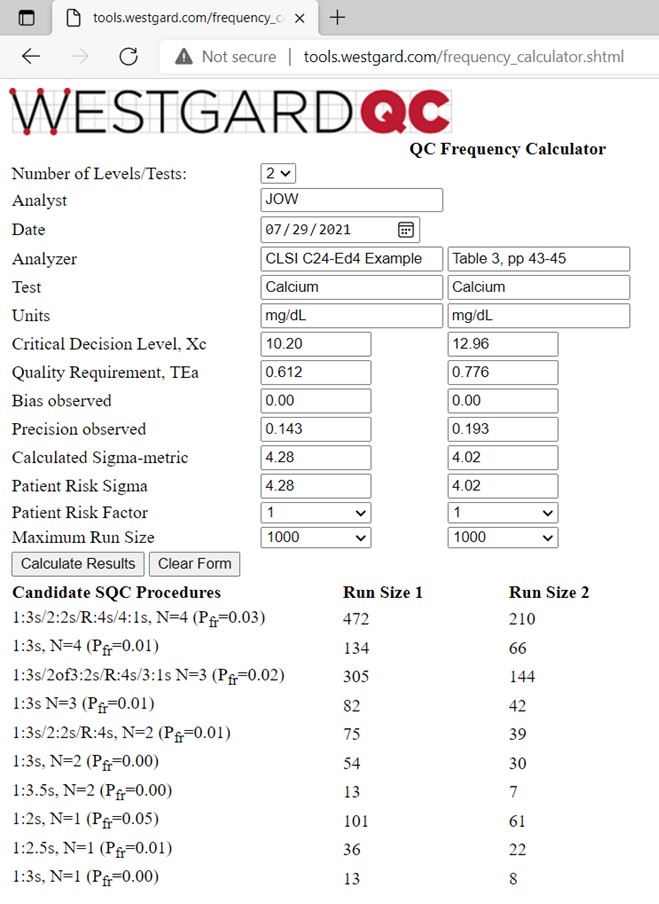
The calculated sigma-metrics are 4.28 and 4.02, resp. Our rule of thumb is that 4-sigma method requires 4 control measurements and a 1:3s/2:2s/R:4s/4:1s multirule procedure, so we were surprised to see that the SQC strategy recommended in C24-Ed4 is a 1:3s/2:2s/R:4s multi-rule with N=2 and a run size of 125 patient samples (500 specimen workload every 24 hours, 6 hour runs, 125 patients per 6 hour run). Actually the calculated run sizes are only 74 and 39 for the 1:3s/2:2s/R:4s multirule with N=2, thus more controls are needed to minimize the risk of erroneous results in a run size of 125 patient samples. It would be better to include a 3rd control at a lower calcium concentration, perhaps in the range 7-9 mg/dL and then use an N=3 multirule procedure, which would provide a longer run sizes, such as 305 and 144 patient samples for controls 1 and 2, resp. Otherwise, a multirule with N=4 (2 measurements on each of 2 controls) would provide run sizes of 472 and 210. See reference 6 for more discussion.
CLSI C24-Ed4 TSH Example
Information is again provided in Table 3 of the C24-Ed4 document [2, pp 43-45]. Three controls are analyzed at levels of 0.12, 0.85, and 5.20 mIU/L. The TEa goal of 23.7% converts to values of 0.028, 0.20, and 1.23 mIU/L. Bias is again assumed to be zero and the observed SDs are 0.0053, 0.022, and 0.131 mIU/L, resp. The calculator results are shown below:
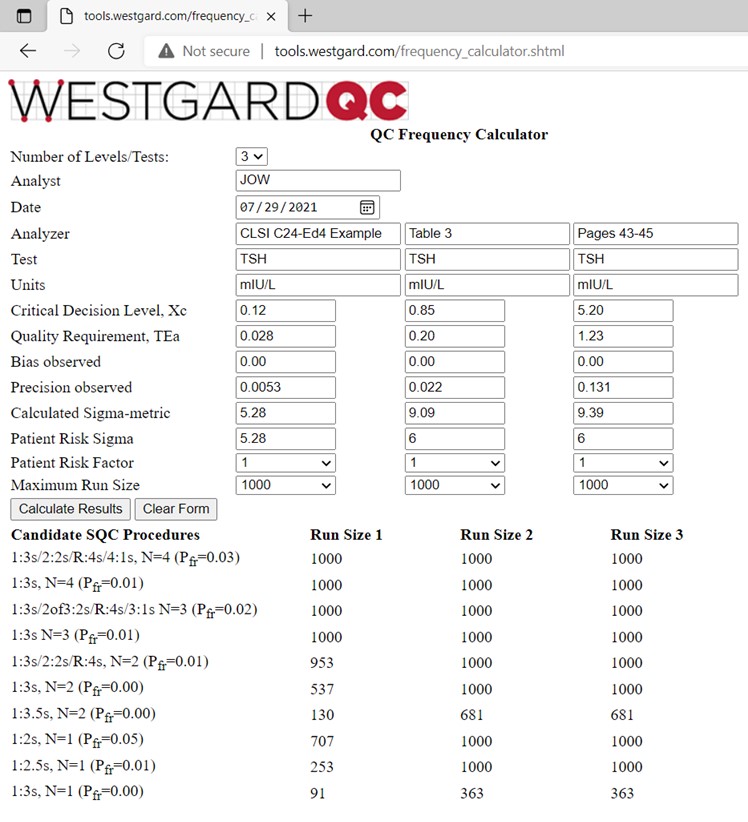
The calculated sigmas are 5.28, 9.09, and 9.39, resp. For planning purposes, the “Patient Risk Sigmas” used for the calculation of run sizes are 5.28, 6.00, and 6.00, resp. Note that the run sizes for many of the candidate SQC procedures are 1000 patient samples, which is set as the maximum run size for these calculations. The laboratory workload is stated as 200 patient samples in an 8 hour shift, thus use of a 1:3s N=2 procedure should provide high quality and limit the maximum possible erroneous results to 1 or less per run. Our recommendation for the SQC strategy is therefore the same as that provided in the C24-Ed4 document.
References
- CLSI C24-Ed4. Statistical Quality Control for Quantitative Measurement Procedures: Principles and Definitions. Clinical and Laboratory Standards Institute, 950 West Valley Road, Suite 2500, Wayne PA, 2016.
- Parvin CA. Assessing the impact of the frequency of quality control testing on the quality of reported patient results. Clin Chem 2008;54:2049-2054.
- Yago M, Alcover S. Selecting statistical procedures for quality control planning based on risk management. Clin Chem 2016;62:959-965.
- Bayat H. Selecting multi-rule quality control procedures based on patient risk. Clin Chem Lab Med 2017;55:1702-1708.
- Bayat H, Westgard SQ, Westgard JO. Planning risk-based SQC strategies: Practical tools to support the new CLSI C24-Ed4 guidance. J Appl Lab Med 2017;2:211-221.
- Westgard JO, Westgard SA. Establishing evidence-based Statistical Quality Control Practices. Am J Clin Pathol 2019;151:364-370.