Sigma Metric Analysis
POC automated CBC analyzer
A 2008 evaluation study of a new point of care analyzer instrument for rapid complete blood counts. Two key parameters, WBC and Hemoglobin, are analayzed. What does it mean when the study claims the precision and accuracy of the instrument are "within acceptable limits"?
- The Precision and Comparison data
- Calculate bias at the critical decision level
- Determine quality requirements at the critical decision level
- Calculate Sigma metrics
- Summary of Performance by Normalized Sigma-metrics chart and Normalized OPSpecs Chart
- Conclusions
September 2008
 |
[Note: This QC application is an extension of the lesson From Method Validation to Six Sigma: Translating Method Performance Claims into Sigma Metrics. This article assumes that you have read that lesson first, and that you are also familiar with the concepts of QC Design, Method Validation, and Six Sigma. If you aren't, follow the link provided.] |  |
We came across an evaluation study in a recent (2008) journal. This study covered a new point of care analyzer that could do rapid complete blood counts. Two key paramaters, WBC and Hemoglobin, will be the subject of our analysis. Whenever we find a study that claims the precision and accuracy of the instrument are "within acceptable limits," it raises our suspicions. After further analysis, the results call into question what level of performance can be considered acceptable.
The Precision and Comparison data
The study was conducted on two different analyzers. Within-day precision was determined by testing 10 consecutive measurements of 2 levels of control solution, between-day precision was determined by testing the control solutions for 10 consecutive days.
The instrument was then compared against the Beckman Coulter LH750, using 60 in-patient venous blood specimens. Linear regression techniques were used.
Imprecision Estimates:
Both within-day and between-day precision estimates are provided. Since we have only a few parameters, we'll look at both estimates - and look at them on both analyzers. Usually, we use the between-day %CV estimate since that is more representative of performance over time. It would be even better if the study had calculated a Total Precision estimate, but the study did not do that.
Even more problematic, the study didn't provide specifics on the two control levels. It stated there was Level 1 and Level 2 without giving that actual value. For our purposes, we're going to pick two critical decision levels for the parameters and assign them to the controls. We note that this choice of those levels has a real impact on the bias calculations. Assigning a level to the values isn't the best practice, but in the absence of real data, we've got to be a little creative in our analysis.
|
Within-Day Imprecision
|
|||
| Assay | Analyzer |
Level
|
CV% |
| WBC, k/uL |
1
|
3.0
|
6.3%
|
|
1
|
12.0
|
7.1%
|
|
|
2
|
3.0
|
3.6%
|
|
|
2
|
12.0
|
3.3%
|
|
| Hemoglobin, g/dL |
1
|
4.5
|
3.8%
|
|
1
|
10.5
|
2.3%
|
|
|
2
|
4.5
|
2.9%
|
|
|
2
|
10.5
|
1.7%
|
|
|
Between-Day Imprecision
|
|||
| Assay | Analyzer |
Level
|
CV% |
| WBC, k/uL |
1
|
3.0
|
1.8%
|
|
1
|
12.0
|
6.0%
|
|
|
2
|
3.0
|
3.3%
|
|
|
2
|
12.0
|
3.5%
|
|
| Hemoglobin, g/dL |
1
|
4.5
|
1.9%
|
|
1
|
10.5
|
4.7%
|
|
|
2
|
4.5
|
1.8%
|
|
|
2
|
10.5
|
2.5%
|
|
We can immediately see that the within-day imprecision study yields some volatile numbers. That Analyzer #1 has significantly higher values for imprecision than Analyzer #2. That's what can happen when the duration of the precision study is narrow. Within-run imprecision estimates can be either too low or too high. When we look at the between-day study, the differences between the two analyzers are smaller, although Analyzer #1 still seems to have more precision issues than its counterpart.
| Comparison of Methods (Bias) | |||
| Assay |
Slope
|
Y-Int
|
r
|
| WBC, k/uL |
1.09
|
-0.22
|
0.99
|
| Hemoglobin, g/dL |
1.13
|
-1.92
|
0.98
|
At this point, remember the following: the correlation coefficient is not the key statistic here. The values of the correlation coefficient merely tell us that linear regression is sufficient for these analytes (for those r values below 0.975, other forms of regression like Deming or Passing-Bablock are preferable).
Calculate bias at the critical decision level
Now we take the comparison of methods data and set those equations at one of the levels covered by (or in this case, assigned to) the imprecision studies. Solving those equations will give us bias estimates.
Using hemoglobin as an example, let's see how to calculate bias:
((slope*level) + YIntercept) - level) / level = % bias
((1.13 * 4.5 + (-1.92)) - 4.5) / 4.5 = ((5.085 -1.92) - 4.5 ) / 4.5
(3.165-4.5) / 4.5 = -1.335 / 4.5 = 0.2966 * 100 = 29.66%
| Assay | Analyzer |
Slope
|
Y-Int
|
level
|
Bias % |
| WBC, k/uL |
1
|
1.09
|
-0.22
|
3.0
|
1.67%
|
|
1
|
1.09
|
-0.22
|
12.0
|
7.17%
|
|
|
2
|
1.09
|
-0.22
|
3.0
|
1.67%
|
|
|
2
|
1.09
|
-0.22
|
12.0
|
7.17%
|
|
| Hemoglobin, g/dL |
1
|
1.13
|
-1.92
|
4.5
|
29.7%
|
|
1
|
1.13
|
-1.92
|
10.5
|
5.3%
|
|
|
2
|
1.13
|
-1.92
|
4.5
|
29.7%
|
|
|
2
|
1.13
|
-1.92
|
10.5
|
5.3%
|
First, you'll note that the bias is the same regardless of analyzer. Since we've got one comparison of methods study, without attribution to either Analyzer #1 or #2, we'll use the data for both analyzers. So the two analyzers will use the same bias estimates at the same levels.
Second, you'll note that there are some high bias numbers reported here. Particularly for the level one for Hemoglobin, where bias is nearly 30%.
Determine the quality requirements at the critical decision level
Now that we have both bias and CV estimates, we are almost ready to calculate the Sigma metrics for these analytes. The last thing we need is the quality requirement for each method. CLIA provides the quality requirements we need and we don't even have to calculate the requirement at any particular level.
|
CLIA Quality Requirements
|
|
| Assay | CLIA PT criterion |
| WBC, k/uL |
Target ± 15%
|
| Hemoglobin, g/dL |
Target ± 7%
|
Calculate Sigma metrics
Now we have all the pieces in place.
Remember the equation for Sigma metric is (TEa - bias) / CV:
For Hemoglobin, (3.29 - 1.23) / 0.8 = 2.58
|
Sigma-metrics based on Between-Day Imprecision
|
|||||
| Assay |
Analyzer
|
CV%
|
Bias % | TEa% | Sigma metric |
| WBC, k/uL |
1
|
1.8%
|
1.7%
|
15.0%
|
7.41
|
|
1
|
6.0%
|
7.2%
|
15.0%
|
1.31
|
|
|
2
|
3.3%
|
1.7%
|
15.0%
|
4.04
|
|
|
2
|
3.5%
|
7.2%
|
15.0%
|
2.24
|
|
| Hemoglobin, g/dL |
1
|
1.9%
|
29.7%
|
7.0%
|
negative
|
|
1
|
4.7%
|
5.3%
|
7.0%
|
0.36
|
|
|
2
|
1.8%
|
29.7%
|
7.0%
|
negative
|
|
|
2
|
2.5%
|
5.3%
|
7.0%
|
0.69
|
|
Not a lot of good news here. While there is one case where WBC performance is above Six Sigma, that appears to be an outlier. The average performance seems to be below 3 Sigma. For Hemoglobin, the news is worse. Half the values are actually negative - that is, the bias is so large it devours the entire error budget. The other half of the values are just barely about zero and are far below 3 Sigma, which is therefore below what is considered the minimum performance in other business or industry processes.
At best, this is an instrument teetering on the edge of minimum acceptable performance.
Summary of Performance by Normalized Sigma-metrics chart and Normalized OPSpecs chart
Here's a graphic depiction of these analytes, using the between-day imprecision estimates:
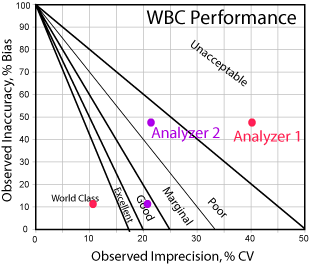
Even if we weren't using the bias calculations, that is, if you set bias at zero and drop all the points to the x-axis, you can still see problems. Analyzer #1 spans the performance spectrum from world class to poor. Analyzer #2 is more consistent, with points in the "good" region. But if you take in all the points, you've probably got an average or marginal to good perfomance.
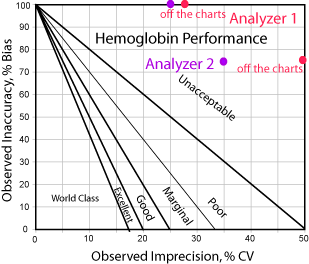
Hemoglobin, on the other hand, has no good news at all. Analyzer #1 has performance that is off the charts in a bad way in both directions. Even if you eliminate bias, Analyzer #1 is at best marginal. So, too, with Analyzer #2; it's marginal or poor method at best.
But what is the practical meaning of the method performance data? What actual controls rules would you use to QC this method?
Here's another view of the data, this time using an OPSpecs chart generated by EZ Rules 3. In this chart, the diagonal lines don't represent Sigma performance, they represent actual control rule procedures that could be used to monitor the method.
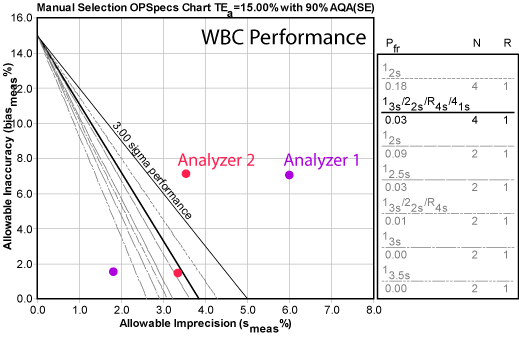
Two of the points can't be controlled at all. One point from Analyzer#1 could be controlled with 3.5s limits. But if you went with an average performance - take that middle red dot with lower bias and use that for the whole system - that would require you use 4 controls per run and almost all of the "Westgard Rules." For most laboratories, that would be neither acceptable nor practical. But doing less QC would not adequately control the method.
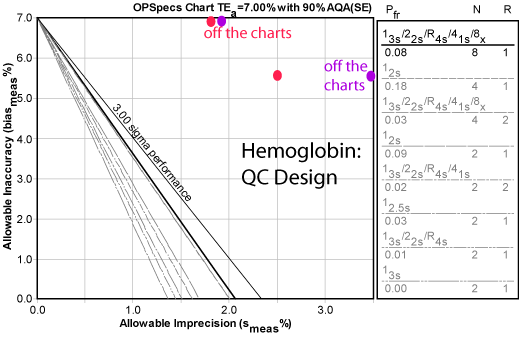
As we noted before, Hemoglobin has worse news. No amount of QC can control this method, on either analyzer. Note we've even added a full "Westgard Rules" combination with eight controls per run. Even that can't provide adequate error detection. And even if the bias was completely eliminated, you would have to run eight controls or you could run "just" four controls per run with 2s control limits. The further complication is that both of those QC procedures have unacceptably high false rejection rates. If you used 4 controls and 2s limits, you should expect nearly 1 out of 5 runs to be rejected. If you used 8 controls and "Westgard Rules", you should expect nearly 1 out of 10 runs to be rejected. That's too much false rejection.
Conclusions
While the study that evaluated this instrument concluded that correlation was good and performance was "within acceptable limits," we reject that analysis. There is no scenario where this instrument, particularly with its poor hemoglobin performance, should be considered acceptable for a laboratory of healhtcare setting.
