Sigma Metric Analysis
Sysmex XT 1800i hematology
A poster at the IFCC conference applied Sigma-metric analysis to a number of hematology methods, including differential parameters, on the Sysmex xt 1800i. Interestingly, they chose Biologic-based quality requirements, not the usual CLIA goals. We review the data and generate some graphic analysis.
- The Precision and Comparison data
- Determine quality requirements at the critical decision level
- Calculate Sigma metrics
- Summary of Performance by Sigma-metrics chart and OPSpecs Chart
- Conclusion
March 2009
Sten Westgard, MS
 |
[Note: This QC application is an extension of the lesson From Method Validation to Six Sigma: Translating Method Performance Claims into Sigma Metrics. This article assumes that you have read that lesson first, and that you are also familiar with the concepts of QC Design, Method Validation, and Six Sigma. If you aren't, follow the link provided.] |  |
This application looks at a poster presented at last year's IFCC meeting in Fortoleza, Brazil, "Implementation of the process Six Sigma in Haematology's Laboratory" by Recondo C. Grassi C, Blanco M, and Domecq P., Clin Chem Lab Med 2008; 46, Special Suppl, pp S1 – S859, August 2008.
This study is particularly interesting because the laboratory selected quality requirements based on biologic goals - that is, using the Ricos et al Desirable Specifications based on biologic variation. For some of the analytes covered, the Ricos guidelines are the only ones out there (CLIA doesn't provide any PT criteria for monocytes, eosinophiles, and basophiles, for example). But where CLIA does provide criteria, this laboratory chose to use the more demanding biologic-based quality requirements because they were closer to their clinical needs.
For this particular application, we're going to present a comparison of the CLIA vs biologic quality requirements, calculating Sigma-metrics using both goals. We'll also use EZ Rules software to analyze the differences in more detail, and determine the impact of quality requirement on the optimal QC procedure.
Note: we'll follow the convention of the authors in their spelling of the parameters. US readers might be accustomed to different spellings.
The Precision and Comparison data
The precision data was averaged from three levels of controlstudies, using the routine operational data of the laboratory. As such, this represents a better estimate of imprecision, since it comes from a longer, larger source of data than a limited method validation study, such as EP5. Bias was estimated based on the differences reported from the CAP external quality control program.
| Analyte | CV% | Bias% |
| RBC | 0.82 | 0.81 |
| HGB | 0.87 | 0.94 |
| HCT | 1.06 | 1.08 |
| PLT | 3.08 | 3.94 |
| WBC | 1.88 | 2.11 |
| %Neutrophil | 2.22 | 2.11 |
| %Lymphocyte | 3.44 | 7.63 |
| %Monocyte | 7.92 | 9.94 |
| %Eosinophile | 6.85 | 7.45 |
| %Basophile | 1.46 | 1.57 |
Calculate Sigma metrics
Now we have all the pieces in place.
Remember the equation for Sigma metric is (TEa - bias) / CV:
For a 4.4% biologic quality requirement, with the RBC method, (4.4-0.81) / 0.82 = 4.38
The metrics are displayed along the right columns.
| Analyte | CV% | Bias% | TEbv | Sigma-metric (bv goal) | TEa | Sigma-metric (analytic goal) |
| RBC | 0.82 | 0.81 | 4.4 | 4.38 | 6.0 | 6.33 |
| HGB | 0.87 | 0.94 | 4.1 | 3.64 | 7.0 | 6.96 |
| HCT | 1.06 | 1.08 | 4.1 | 2.87 | 6.0 | 4.64 |
| PLT | 3.08 | 3.94 | 13.4 | 3.07 | 25.0 | 6.84 |
| WBC | 1.88 | 2.11 | 14.6 | 6.64 | 15.0 | 6.86 |
| %Neutrophil | 2.22 | 2.12 | 22.4 | 9.14 | --- | --- |
| %Lymphocyte | 3.44 | 7.63 | 16.0 | 2.43 | --- | --- |
| %Monocyte | 7.92 | 9.94 | 27.9 | 2.26 | --- | --- |
| %Eosinophile | 6.85 | 7.45 | 37.1 | 4.34 | --- | --- |
| %Basophile | 1.46 | 1.57 | 38.5 | 25.59 | --- | --- |
A pretty wide range of performance here, and not just because of differences between CLIA and biologic-based quality requirements. Among the traditional categories of hematology, there is a range between 2.87 and 6.64 (biologic-based requirements) or a range of 4.64 to 6.96 (CLIA requirements). For the differential parameters, there are no CLIA quality requirements, so we can only use the biologic-based requirements, and those Sigma estimates range from 2.43 to greater than 25.
Summary of Performance by Sigma-metrics chart
Here's a Method Decision chart, using Six Sigma metrics lines to delineate the performance of the methods. In this case, we'll first display the performance of the core Hematology analytes (RBC, HGB, HCT, PLT, WBC) using the Biologic-based quality requirements. Because each of these analytes has a different quality requirement, we'll normalized the performance and display the results on a Normalized Method Decision chart.
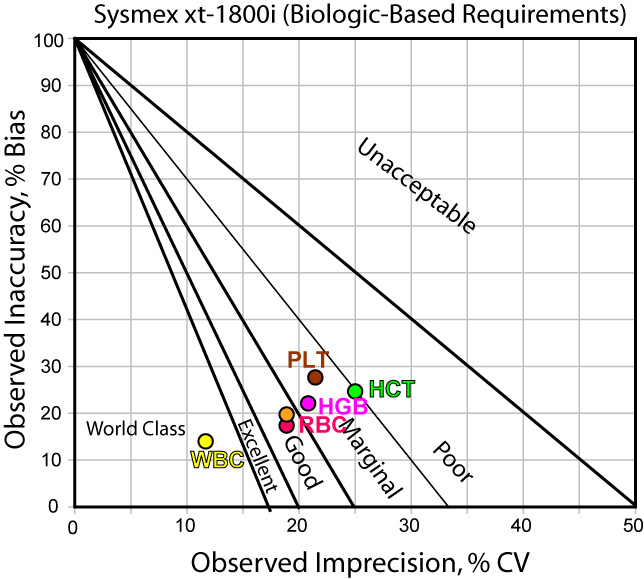
Those familiar with a Method Decision chart know that the various lines indicate Sigma threshholds of performance. For instance, the region closest to the origin represents "world class" or Six Sigma performance. Most of the analytes here are in the good or marginal performance areas. Contrast this to the performance when using CLIA quality requirements:
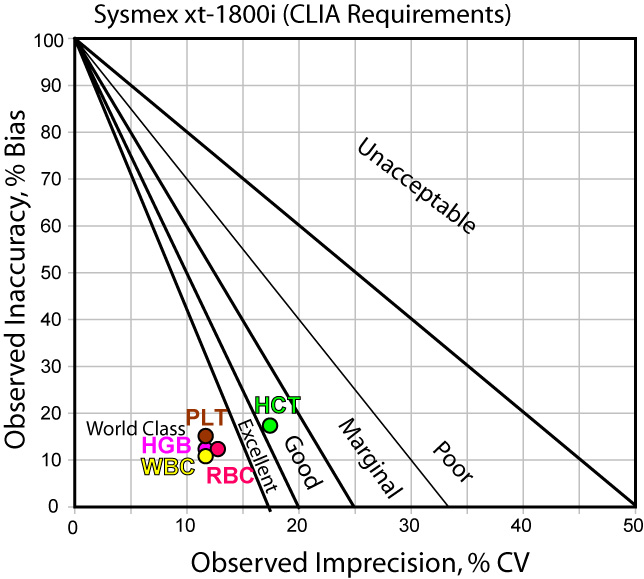
When judged by CLIA goals, nearly all the analytes are world class. Only HCT is less than Six Sigma, with a respectable location in the "good" performance region. Clearly, your Sigma-metric depends a lot upon the goals you choose.
Since the differential parameters have no CLIA requirements, we will simply use the biologic-based requirements. Again, the performance is normalized and the results displayed on a Normalized Method Decision chart:
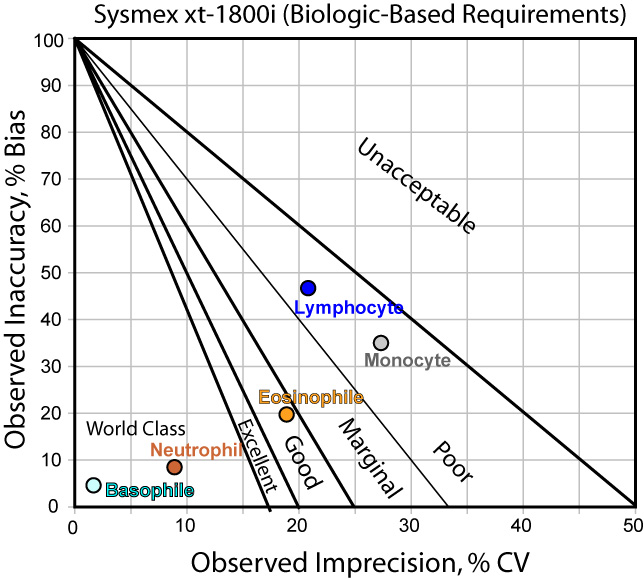
Here we see a wide range of performance. Some methods are world class, some are poor. This type of testing hasn't been around as long as the usual hematology parameters, so the quality is still evolving.
QC Design using OPSpecs chart
Not only can we use tools to graphically depict the performance of the method - we can also use those tools to help determine the best QC procedure to use with that method. Using EZ Rules 3, we can express the method performance on an OPSpecs (Operating Specifications) chart :
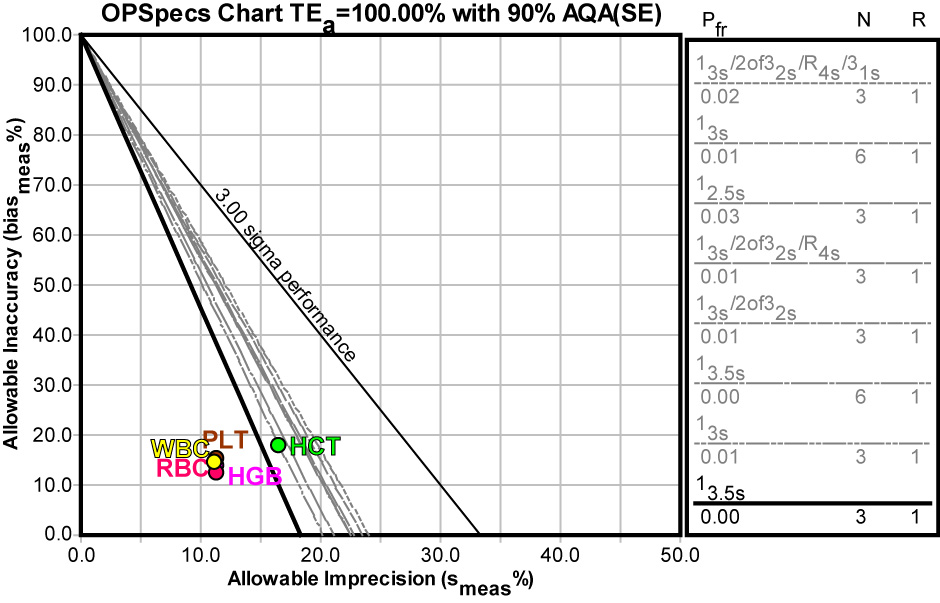
The news here is pretty good. Virtually all the methods can be adequately controlled with a 13.5s control rule with 3 control measurements.
Judging these methods by the Biologic-based requirements, however, is a different story:
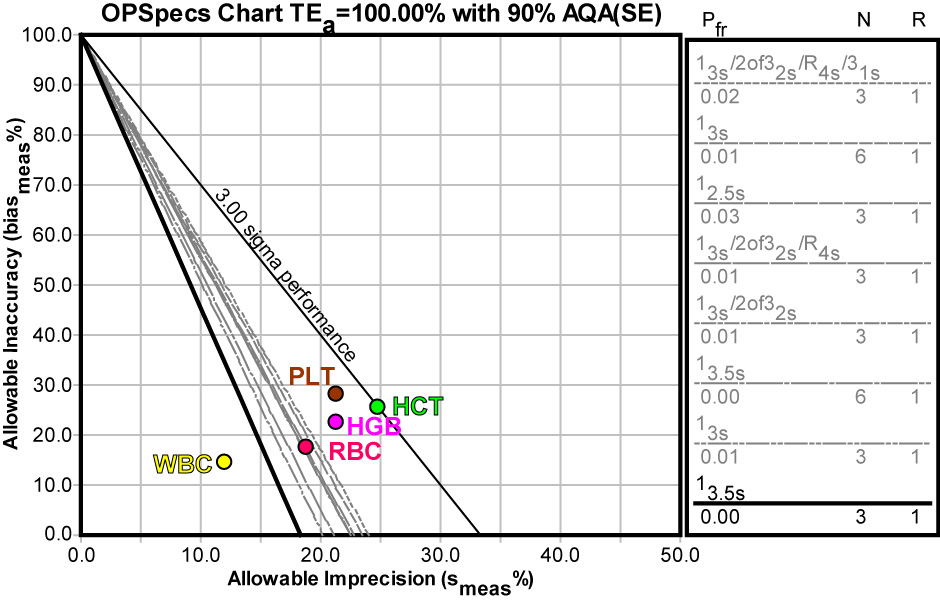
With the Biologic-based requirements, the options for QC are limited. Even with a full set of "Westgard Rules" and 3 controls, it doesn't look like adequate analytical quality assurance can be achieved (this is an OPSpecs chart for 90% AQA). While any control procedure could be used with WBC, there is no procedure that will work for PLT, HGB, or HCT.
Finally, let's look at the choices available for QC of the differential parameters:
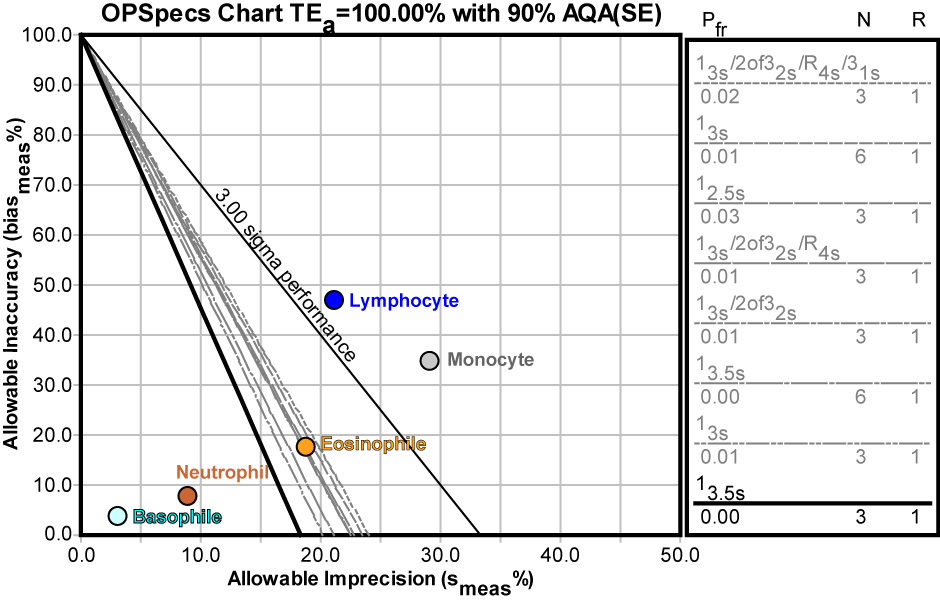
The wide range of performance means a wide range of control options. For Basophil and Neutrophil, very wide limits can be used - as wide as 3.5s with 3 controls. However, Eosinophile would probably require a set of "Westgard Rules" with 3 controls. Lymphocyte and Monocyte cannot be adequately controlled to 90% AQA.
Conclusions
This study answers one question about the Sigma-metric performance of hematology parameters in the laboratory. However, it raises several other questions: what is the best quality requirement to use? In this case, the laboratory chose to use tighter, biologic-based quality requirements. However, laboratories in the US might prefer to use the CLIA requirements instead. But once that question is answered, the next question arises: how to select a QC procedure on a multitest instrument when the analytes have widely divergent peformance?
In a second discussion of this study, we'll make greater use of EZ Rules 3 to explore in depth the different options for quality requirements and QC procedures for these analytes.
