Online Lessons
Secrets of Screening QC
Screening assays are common throughout the world, but the QC performed on them is anything but common. For years, QC for Screening tests has been something of a mystery. At last, Dr. Paulo Pereira reveals the secret.
Secrets of Screening Assay IQC
September 2020
Paulo Pereira, Ph.D., Contributing Editor
Purpose
The purpose of the lesson is to answer questions from several laboratorians related to screening immunoassays' internal quality control (IQC). In fact, these questions were the main reason to write for Chapter 7 "Internal quality control and external quality assessment" in the book Quality control of qualitative tests for medical laboratories (7 of [1]). Please, refer to this book for a more in-depth discussion and spreadsheets.
Screening immunoassays' IQC is questioned continually since I started to work in the middle '90s as a medical laboratory technician. The IQC must be fit the purpose of the reported results. The "purpose" is generally the clinical decision and is related to the patients' safety. For example, post-transfusion safety in blood components.
See even more stories about COVID-19 Laboratory Challenges...
Qualitative tests IQC robustness also involves some variables not discussed in this lesson. These variables are well-known and discussed in several papers (9 of [2]). For example, stability, vial to vial variability, pretreatment steps, and matrix.
We will focus on a well-recognized IQC scheme using Levey-Jennings charts, single rule, or multirules, mostly known as "the Westgard rules," and Sigma metrics. Other approaches have been published [3-4].
Although the text focuses on screening tests, the methodologies can be applied to any other qualitative tests.
1. Which types of binary classification are applied to the screening immunoassays?
The binary (positive/negative) or trinary results (positive/indeterminate/negative) classification is mostly related to the analytical method. For example, immunoassays or polymerase chain reaction (PCT) tests reporting binary resulçts. If the qualitative results are classified in an ordinal scale according to a decision point (cutoff), e.g., positive if ≥ 1 S/CO (signal-to-cutoff ratio), and negative if < 1 S/CO, the IQC approach for "qualitative results classified on an ordinal scale" is required. The methodology involver numerical results, such as absorbances, photos, and the signal-to-cutoff ratio. Otherwise, if the result is "purely" a nominal quantity value (4.6 of [5]) not based on an ordinal quantity (1.26 of [5]) scale and a classification value (cutoff), i.e., positive/negative, the IQC approach for "'pure' qualitative results not quantifiable" is required.
2. What is happening with screening tests IQC?
2.1 "Qualitative results classified on an ordinal scale."
The IQC strategy is similar to tests expressing quantitative results, recognized as "quantitative tests." The "Westgard Rules" are commonly used and sometimes replicating the approach published by Westgard et al. (1981) [6], i.e., multi-rules, 1:3s, 2:2s, R:4s, 4:1s, 10:x as rejection rules and 1:2s and warning rules, two control materials. A type of variables chart is standard practice: Levey-Jennings chart. Note that the early multi-rules scheme was for clinical chemistry and "low" performance (3-sigma) tests when compared to state-of-art technology (> 4-sigma). Screening assays numerical results do not have the same intended use of a clinical chemistry result. The use of classical multi-rules problems is typically a source of false alarms. Our experience does not suggest the use of the classical Westgard rules for this type of test.
2.2 ""Pure" qualitative results not quantifiable."
The strategy habitually involves an attributes' evaluation. A single rule is applied: reject/accept. Occasionally an attributes' scheme is applied to "qualitative results classified on an ordinal scale." Note that the 1:3s and reject/accept rules are analogous. The use of the variables chart leads the lab to more statistical power control of the results. When compared to the evaluation of the attributes, it is more sensitive to the error variation. It can detect phenomena such as drifts and trends, which are not detectable when a nominal value is evaluated. Attributes' evaluation should not be misinterpreted with attributes' charts. These charts' types are not applied to the med lab data.
3. What is the importance of QC material concentration?
A rule of thumb is to control using materials with concentrations close to the cutoff. So, the "concentration problem" is weak positive - binary results have a significant risk of being misclassified if the test is not stable. Generally, weak positive material is required. Note that the weak concentration varies according to the test, even those sharing the same method. Some materials manufacturers offer concentrations for specific tests. If a high concentration is used, the "concentration problem" is not controlled. It is a significant restriction to the control since it does not fit the purpose, i.e., there is a low probability of error detection.
Our experience suggests a concentration between 1.5 and 3 S/CO and with a low limit of 99% CI higher than one but near this ratio. The evaluation could be done using manufacturer information readily available in the material insert.
The negative control sample results do not have the same importance (control of false positives) as weak positives (control of false negatives). However, it is required in some schemes. Whenever possible, we suggest that the results should be evaluated as an attribute (reject/accept), as required for most of the tests.
4. If some screening assays are running with QC and they have S/CO, how do they establish mean and SD?
This question is related to protocol design and requirements. Med lab papers recommend an n of 20, which is the approximate number of monthly working days. The number was initially associated with clinical chemistry evaluation studies. It is related to between-day reproducibility conditions. Repeatability conditions require between-run and/or between-days data. So, the laboratorian should collect data for 20 days with a minimum of two daily replicates to evaluate also the repeatability conditions. So, a minimum n = 40 is needed. Occasionally, qualitative studies are performed only in repeatability conditions, i.e., over a short period. This practice can be easily criticized since reproducibility conditions influence is disregarded. A statistical rule of thumb for some requires n > 30. It means that the lab needs at least 31 results before it can reasonably expect an analysis based upon the Normal distribution to be valid. So, a n of 40 is also supported by the statistical principle.
So, the mean and SD should be computed using representative (internal) data, as suggested. Otherwise, the estimates are not realistic, such as when it is used only data in repeatability conditions. If it is not practicable to collect data over 20 days before test implementation, the mean and SD should be recalculated as soon as new data is available.
Manufacturer mean and SD can be used only until the lab representative data is collected. External statistical data is a combination of the results of several laboratories. Data heterogeneity contributes to recognized biased mean and large SD. A rule of thumb: tests' runs (batches) control requires internal data statistics. On a practical view, the use of manufacturer data decreases the power of the IQC scheme critically, i.e., low probability of error detection.
We also suggest the use of mobile mean and SD for dynamic limits instead of fixed limits. Fixed statistics are the only representative of the data collection period, and they can cause principally (but not only) of biased averages.
5. How are established QC limits? How to use Westgard rules? Can we determine Sigma metrics?
5.1 QC limits
QC limit should control the risk of false negatives. So, a weak positive sample is required. For more accessible comprehension of QC limits, review the different cases of Figure 1 below.
a)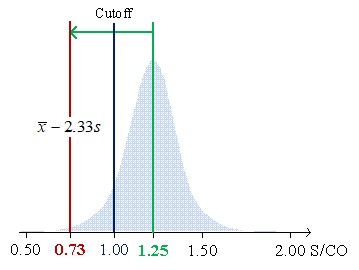
b)
c)
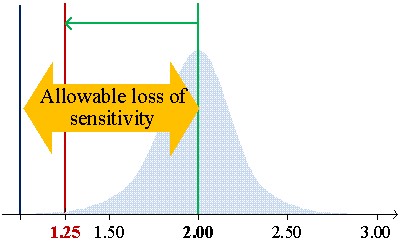
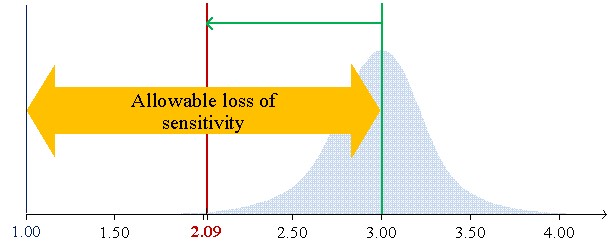
Figure 1 shows the low limits 99% confidential interval for CVs of 7.8%, 6.2%, and 5.7% of average concentrations (S/CO) of 1.25, 2.00, and 3.00, respectively.
Figure 1a illustrates the case of material mean concentration (1.25 S/CO) close to the cutoff (1 S/CO). In this example, the 1:3s rule cannot be used since the low limit of the 99% confidence interval (CI) to be lower than the cutoff. So, it does not fit the purpose of control weak positive results due to ratios below the cutoff to be negatives. Figure 2 b) introduces the allowable loss of sensitivity (ALS) (7.6.3 of [1],7), which is defined as the difference between the sample mean concentration and the cutoff. The sample mean is 3 S/CO with an ALS of 2 S/CO and a low limit of 99% CI of 2.09. Higher concentrations do not fit the purpose of the test and should be avoided. In this scenario, we are controlling strong positives. Figure 2 c) illustrates a concentration's mean of 2 S/CO and a low limit of 99% CI equal to 1.25 S/CO with a lower ALS, which assures the control of weak positives. The 1:3s rule is suitable. If a "gray zone" is used, the Sigma metrics will increase (shorter riks of misclassification due to the use of an indeterminate results zone) - the use of the 1:3s rule is further supported. In fact, a broader rule could even be used.
We do not suggest the use of limits from the peer group due to the heterogeneity of the results, which contribute to non-representative statistics. Even when the groups share the same test, the problem is still significant, expressed by biased means and large SD. In this case, the problem is similar to what happens with QC material manufacturer statistics.
5.2 Westgard Rules
What happens if we use the classic Westgard Rules on screening assays?
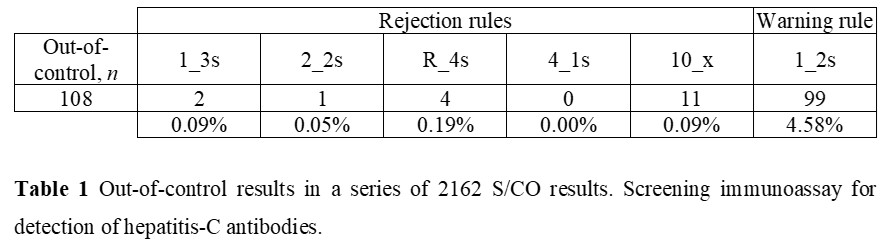
Let us consider a 563 S/CO results, a frequency of two per analytical, and the use of 1:3s, 2:2s, R:4s, 4:1s, 10:x as rejection rules and 1:2s and warning rule. The concentration material is 1.97 S/CO and a CV of 7.4%. The Figure 2 illustration is representative of a stable performance, which is similar for all the data.
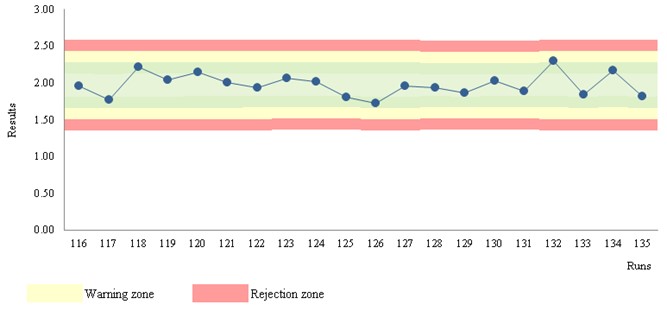
Figure 2 Levey-Jennings chart. Chemiluminescence assay for detection of hepatitis-C antibodies.
Table 1 shows out-of-control results for a chemiluminescence immunoassay. The number of events is 5% (108 of 2162). 99 warnings and 9 rejections. In practice, 108 CAPA actions are required! But are these violations due to factual errors?! No! They are mostly false alarms! Did you try to apply a CAPA methodology to a large number of false alarms?! Well, the situation will be insoluble involving waste… Is this a rare situation?! Absolutely not! The use of the multirules 2:2s, R:4s, 4:1s, 10:x as rejection rules, and 1:2s as warning rule should not be used in stable conditions (n > 30). So, only 1:3s events suggest a risk of misclassification. Note that two 1:3s violations are statistically expected for a n of 2162. A CAPA analysis could require further data (next runs results) to support the statistical probability. Furthermore, if the violated 1:3s rule is on the plus side of the chart, the risk of misclassification is not sustained.
Recommended Rules
Pereira (2019) suggests the use of the STARTUP stage with the multirules: 1:3s/2:2s/R:4s, n = 2 (7.6.10 b) of [1]). STARTUP refers to the first runs. As soon as representative data is available (n > 30), a MONITOR stage [8,9] is used with the single rule 1:3s, n = 2 or n = 1.
The STARTUP stage data statistics are not representative of the stability of the test due to a short number of results (n ≤ 30); so multirules are adequated to increase the probability of error detection (p_ed close to 0.90) with an acceptable probability of false rejection (p_fr < 0.05). Stable data are related to "fixed" values of mobile mean and mobile SD. The STARTUP stage could be omitted whenever a n > 30 is tested uniquely for data collection.
The MONITOR stage is adequate to control stable data. Since the Sigma-metrics is high, 1:3s is statistically sustained, similar to what happens in high-performance manufacturing processes in the industry.
Note that the QC material position in the runs can be randomly calculated using the Excel® (Microsoft®, Redmond, Washington, US) RANDBETWEEN function. For a deeper discussion of probabilities of error detection and false rejection, see [10].
5.3 Sigma-metrics
Probably you read somewhere that Sigma-metrics cannot be computed to qualitative tests. That's a myth! Sigma-metrics can be determined using DPMO-derived sigma metrics (covering all the analytical phases) (7.6.10 a) of [1]). Another approach considers the risk of misclassification, so the problem is biased results (7.6.10 b) of [1]). So, the critical systematic error (SE)_crit-derived sigma metrics (covering the analytical phase) is suitable. SE_crit-derived sigma metrics is the SE_crit + z. For Sigma ≥ 6 (“world-class performance”), the p:ed is 1.00, and the p:fr is 0.01 for the 1:3s/2:2s/R:4s, n = 2 (STARTUP stage); the p:ed is 0.98, and the p:fr is 0.00 for the 1:3s, n = 2 and a p:ed of 0.85 (close to 0.90), and a p:fr of 0.00 for the n of one (MONITOR stage). For SE:crit estimation, see [1,7]. Sigma is significantly higher than 6-sigma for most of the weak concentrations; so, the previous rules, probabilities, and frequency of QC testing are strongly supported. A high sigma value should be understood in a qualitative test as a low risk of misclassification of binary results at a concentration equal to or close to the control material. For a deeper discussion on DPMO-derived sigma metrics and SE:crit-derived sigma metrics, see (7.6.10 of [1]).
The suggested recommendations are consistent with that required by ISO 15189 [11].
6. Case studies
Case Study A: Screening immunoassay for SARS-Cov-2 IgG/IgM Antibodies (S/CO) ("qualitative results classified on an ordinal scale")
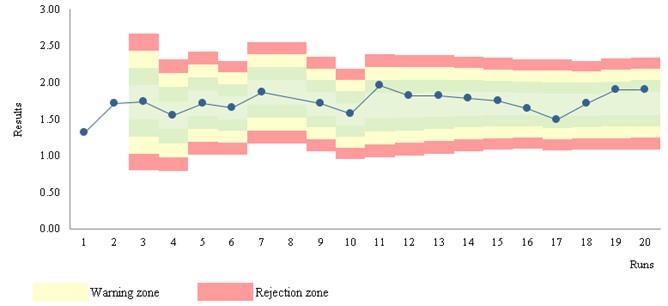
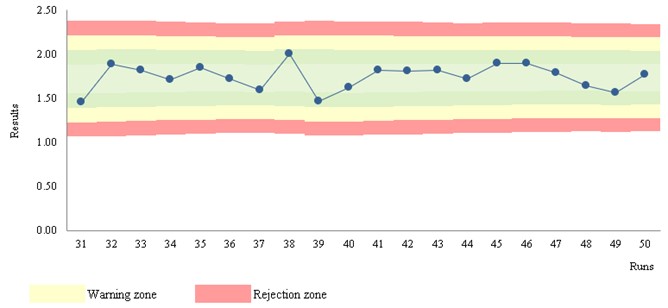
Figure 3 Levey-Jennings chart. (S/CO) ("qualitative results classified on an ordinal scale")
Stats: Mean = 1.75; SD = 0.14; CV = 7.8%; n = 563 (mobile data); STARTUP of 30
Rules: STARTUP: 1:3s, 2:2s, R:4s; MONITOR: 1:3s; n per analytical run = 2
Run position: randomness
Figure 3 a) shows the STARTUP stage - unstable results.
Figure 3 b) illustrates the MONITOR stage - stable results. The stability of the data arises from the observation of moving estimates. The marked zones support the interpretation of the data.
Case Study B: SARS-Cov-2 Real-Time PCR (""pure" qualitative results not quantifiable")
- Stats: True positives = 95.0%; False negatives = 5.0%; True negatives = 95.0%; False positives = 5.0%
- Rules: reject/accept; n per analytical run = 1
- Run position: randomness
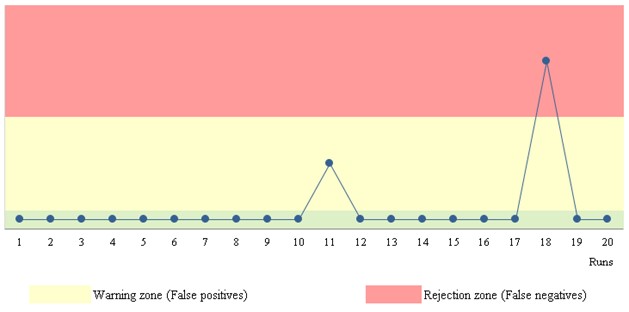
Figure 4. Qualitative results chart.
Data is introduced as "positive" or "negative" attributes. Figure 4 shows two zones: warning and rejection zones. False negatives are on the "rejection" zone and false positives on the "warning" zone.
References
- Pereira P (2019). Quality control of qualitative tests for medical laboratories. Lisbon: Author-Edition.
- Westgard JO (2016). Basic QC Practices. 4th ed. Madison (WI): Westgard QC.
- German Medical Association (2015). Revision of the "Guideline of the German Medical Association on Quality Assurance in Medical Laboratory Examinations – Rili-BAEK" (unauthorized translation). J Lab Med 39(1):26-69.
- Dimech W, Vincini G, Karakaltsas M (2015). Determination of quality control limits for serological infectious disease testing using historical data. Clin Chem Lab Med 53:329-36.
- Joint Committee for Guides in Metrology (2012). International Vocabulary of Metrology - Basic and General Concepts and Associated Terms. JCGM 200:2012, JCGM 200:2008 with minor corrections. JCGM
- Westgard J, Barry P, Hunt M, Groth T (1981). A multi-rule Shewhart chart for quality control in clinical chemistry. Clin Chem 27(3):493-501.
- Green GAT, Neill Carey R, Westgard JO, Carten T, Shablesky LA, Achord D, Page E, Van Le A. Quality control for qualitative assays: Quantitative QC procedure designed to assure analytical quality required for an ELISA of hepatitis B surface antigen. Clin Chemi 1997, 43(9):1618-1621.
- Westgard JO, Smith FA, Mountain PJ, Boss S (1996). Design and assessment of average of normal (AON) patient data algorithms to maximize run lengths for automatic process control. Clin Chem 42(10):1683-8.
- Westgard JO (2003). Internal quality control: planning and implementation strategies. Ann Clin Biochem 40(6):593-611
- Westgard JO, Groth T, Aronsson T, Falk H, de Verdier CH (1977). Performance characteristics of rules for internal quality control: probabilities for false rejection and error detection. Clin Chem, 23(10):1857-67.
- International Organization for Standardization (2012). ISO 15189 Medical laboratories - Requirements for quality and competence. 3rd ed. Geneva: The Organization.