Sigma Metric Analysis
Sigma metric analysis of an Atellica in Brazil
Recent posters offer a glimpse of the new Atellica performance. Can this new instrument meet the latest EFLM goals for performance?
Sigma-metric Analysis of an Atellica analyzer in Brazil
Sten Westgard, MS
October 2019, Corrected November 2019
- The Precision, Comparison and Sigma-metric data
- Summary of Performance according to EFLM, CLIA and Ricos Goals by Sigma-metrics Normalized Method Decision charts
- Conclusion
[Note: This QC application is an extension of the lesson From Method Validation to Six Sigma: Translating Method Performance Claims into Sigma Metrics. This article assumes that you have read that lesson first, and that you are also familiar with the concepts of QC Design, Method Validation, and Six Sigma metrics. If you aren't, follow the link provided.]
[Important correction: a previous version of this article contained technical errors. These have been corrected and we regret the mistakes. Other requests for clarifications about the scope and intention of the article were made - we have attempted to address those questions and concerns.]
See other analyses in this series:
- Multimode Analysis of a Cobas 8000
- Multimode Analysis of a DxC 700
- Multimode Analysis of an Abbott Alinity
At the AACC conference there were two posters from a Brazilian laboratory about Atellica instruments.
Performance Evaluation of Electrolytes and Renal Function Biomarkers Assays on the Atellica CH930, Deise Waltrick, Livia Avallone, Lucilene Rodrigues et al. DASA
Performance Evaluation of Hepatic Function Biomarkers Assays on the Atellica CH930 and Atellica IM 1600 Analyzers, Deise Waltrick, Livia Avallone, Lucilene Rodrigues et al. DASA
Since these represent the most advanced instrumentation on the marketplace, it's a good opportunity to check how the latest performance matches up with the latest goals. The EFLM (European Federation of Laboratory Medicine) has a new website, which posts the latest information on biological variation for various analytes. The approach is also known as EuBIVAS. There is some confusion over what goals can be derived from this database, as there are individual published articles, meta-studies, and the actual biological database itself. We will note which reference is used in the table. For simplicity's sake in the table, we will refer to all of them as "EFLM database goals".
As an approach, however, we are attempting to perform an "acid test" - take the most demanding desirable goals that are coming from EFLM, EuBIVAS, and recently published papers. The point here is not to flog the manufacturer - but to identify which goals may be most appropriate, realistic, and practical for the latest instrumentation in the field.
The key question: can the latest instrument from the diagnostic industry meet the latest performance specifications from the scientific community?
The Imprecision, Bias and Sigma-metric Data
"The precision study was performed according to EP15-A3, the method comparison according to EP09-0A3....For the precision study, two concentration ranges were used: each level of QC material was tested in one run per day with five replicates per run for five days, resulting in a total of 25 replicates per sample for each run. Method comparison studies were performed using at least 40 serum samples that covered the linearity of the method."
|
TEST |
% Bias |
CV |
|
Albumin |
0.5 |
1.7 |
|
Albumin |
0.15 |
1.4 |
|
ALT |
6.4 |
2.0 |
|
ALT |
6.11 |
0.8 |
|
AST |
2.7 |
3.0 |
|
AST |
3.35 |
0.8 |
|
Chloride |
0.9 |
0.5 |
|
Chloride |
0.1 |
0.7 |
|
Creatinine |
7.4 |
2.3 |
|
Creatinine |
5.9 |
1.2 |
|
GGT |
3.5 |
2.1 |
|
GGT |
2.9 |
1.5 |
|
Potassium |
1.2 |
0.2 |
|
Potassium |
2.1 |
0.2 |
|
Sodium |
1.4 |
0.4 |
|
Sodium |
0.5 |
0.2 |
|
Urea Nitrogen |
6.3 |
3.2 |
|
Urea Nitrogen |
5.6 |
1.7 |
|
Uric Acid |
1.1 |
1.0 |
|
Uric Acid |
1.9 |
0.6 |
Sigma-metric calculations for the Atellica
Remember the equation for Sigma metric is (TEa - bias) / CV:
For a 3.5% quality requirement, the latest EFLM specification, for Albumin on the normal level of the Atellica, the equation is (3.5 - 0.5) / 1.7 = 1.8
In contrast, for a 10% quality requirement, the CLIA goal, for Albumin on the normal level of the Atellica, the equation is (10 - 0.5) / 1.7 = 5.6
Just with this one example, we can see the major difference in judging Atelllica performance by EFLM or CLIA standards.
First, thought, let's calculate the performance by the 2019 EFLM desirable specifications for performance based on biological variation:
|
TEST |
TEa Source |
TEa |
% Bias |
CV |
Sigma |
|
Albumin |
EuBIVAS DB goals 2019 |
3.5 |
0.5 |
1.7 |
1.8 |
|
Albumin |
3.5% |
3.5 |
0.15 |
1.4 |
2.4 |
|
ALT |
EuBIVAS DB goals 2019 |
16.1 |
6.4 |
2.0 |
4.9 |
|
ALT |
16.1% |
16.1 |
6.11 |
0.8 |
>6 |
|
AST |
EuBIVAS DB goals 2019 |
13.7 |
2.7 |
3.0 |
3.6 |
|
AST |
13.7% |
13.7 |
3.35 |
0.8 |
>6 |
|
CEA |
EuBIVAS DB goals 2019 |
26.90 |
6.1 |
5.4 |
3.8 |
|
CEA |
26.90% |
26.90 |
1.01 |
3.5 |
>6 |
|
Chloride |
EuBIVAS DB goals 2019 |
1.2 |
0.9 |
0.5 |
0.6 |
|
Chloride |
1% |
1.2 |
0.1 |
0.7 |
1.7 |
|
Creatinine |
EuBIVAS DB goals 2019 |
7.20 |
7.4 |
2.3 |
negative |
|
Creatinine |
7.2% |
7.20 |
5.9 |
1.2 |
1.1 |
|
GGT |
EuBIVAS DB goals 2019 |
17.60 |
3.5 |
2.1 |
>6 |
|
GGT |
17.6% |
17.60 |
2.9 |
1.5 |
>6 |
|
Potassium |
EuBIVAS DB goals 2019 |
4.8 |
1.2 |
0.2 |
>6 |
|
Potassium |
4.8 |
4.8 |
2.1 |
0.2 |
>6 |
|
Sodium |
EuBIVAS DB goals 2019 |
0.7 |
1.4 |
0.4 |
-1.6 |
|
Sodium |
0.7 |
0.7 |
0.5 |
0.2 |
0.9 |
|
Urea Nitrogen |
EuBIVAS DB goals 2019 |
17.80 |
6.3 |
3.2 |
3.6 |
|
Urea Nitrogen |
17.8% |
17.80 |
5.6 |
1.7 |
>6 |
|
Uric Acid |
EFLM 2019 paper* |
10.60 |
1.1 |
1.0 |
>6 |
|
Uric Acid |
10.6% |
10.60 |
1.9 |
0.6 |
>6 |
Negative Sigma-metrics at certain levels. Very low Sigma-metrics at others. This is not a good sign for a "next generation" analyzer, unless the goals being used to judge the instrument are not appropriate.
* for Uric Acid, the database doesn't have an entry (11/21/2019) but a paper from the group does: EuBIVAS: Within- and Between-Subject Biological Variation Data for Electrolytes, Lipids, Urea, Uric Acid, Total Protein, Total Bilirubin, Direct Bilirubin, and Glucose, Aarsand AK, Diaz-Garzon J, Fernandez-CAlle P et al, Clin Chem 64:9 2017
Then if we believe the EFLM goals are too challenging, we can instead use a set of goals we have adopted for global performance standards at the Westgard Sigma Verification of Performance Program (WSVP), which contain a few EFLM goals from earlier years, as well as some CLIA goals. CLIA goals, according to common wisdom, are more permissive, and some even say, too loose.
|
TEST |
TEa Source |
TEa |
% Bias |
CV |
Sigma |
|
Albumin |
CLIA |
10 |
0.5 |
1.7 |
5.6 |
|
Albumin |
10% |
10 |
0.15 |
1.4 |
>6 |
|
ALT |
EFLM 2018 |
14.4 |
6.4 |
2.0 |
4.1 |
|
ALT |
14% |
14.4 |
6.11 |
0.8 |
>6 |
|
AST |
EFLM 2018 |
13.4 |
2.7 |
3.0 |
3.5 |
|
AST |
13% |
13.4 |
3.35 |
0.8 |
>6 |
|
CEA |
Ricos 2014 |
24.70 |
6.1 |
5.4 |
3.4 |
|
CEA |
24.70% |
24.70 |
1.01 |
3.5 |
>6 |
|
Chloride |
CLIA |
5 |
0.9 |
0.5 |
>6 |
|
Chloride |
5% |
5 |
0.1 |
0.7 |
>6 |
|
Creatinine |
CLIA 15% or |
31.55 |
7.4 |
2.3 |
>6 |
|
Creatinine |
0.3 mg/dL |
31.55 |
5.9 |
1.2 |
>6 |
|
GGT |
Ricos 2014 |
22.11 |
3.5 |
2.1 |
>6 |
|
GGT |
22% |
22.11 |
2.9 |
1.5 |
>6 |
|
Potassium |
CLIA |
12.65 |
1.2 |
0.2 |
>6 |
|
Potassium |
0.5 mEq/L |
8.24 |
2.1 |
0.4 |
>6 |
|
Sodium |
CLIA |
3.09 |
1.4 |
0.4 |
3.9 |
|
Sodium |
4 mEq/L |
2.72 |
0.5 |
0.2 |
>6 |
|
Urea Nitrogen |
CLIA 9% or |
9.00 |
6.3 |
3.2 |
0.9 |
|
Urea Nitrogen |
2.0 mg/dL |
9.00 |
5.6 |
1.7 |
2.0 |
|
Uric Acid |
CLIA |
17.00 |
1.1 |
1.0 |
>6 |
|
Uric Acid |
17% |
17.00 |
1.9 |
0.6 |
>6 |
Note: The above TEa goals correspond with the Sigma Verification of Performance (Sigma VP) Program goals of 2019. So they are a bit tighter than CLIA in some places but they are not nearly as challenging as EFLM goals in others. The result? more assays at 6 Sigma and higher.
Now, for some observers, the Westgard Sigma Verification goals may not satisfy. They might prefer to look at "pure" sets of goals such as, All CLIA 1992 goals, All CLIA proposed 2019 goals, and/or all Ricos 2014 goals. Don't worry, we have them all worked out here.
|
TEST |
TEa Source |
TEa |
% Bias |
CV |
Sigma |
|
Albumin |
CLIA |
10 |
0.5 |
1.7 |
5.6 |
|
Albumin |
10% |
10 |
0.15 |
1.4 |
>6 |
|
ALT |
CLIA |
20 |
6.4 |
2.0 |
>6 |
|
ALT |
20% |
20 |
6.11 |
0.8 |
>6 |
|
AST |
CLIA |
20 |
2.7 |
3.0 |
5.7 |
|
AST |
20% |
20 |
3.35 |
0.8 |
>6 |
|
Chloride |
CLIA |
5 |
0.9 |
0.5 |
>6 |
|
Chloride |
5% |
5 |
0.1 |
0.7 |
>6 |
|
Creatinine |
CLIA 15% or |
15.00 |
7.4 |
2.3 |
3.3 |
|
Creatinine |
0.3 mg/dL |
15.00 |
5.9 |
1.2 |
>6 |
|
Potassium |
CLIA |
12.65 |
1.2 |
0.2 |
>6 |
|
Potassium |
0.5 mEq/L |
8.24 |
2.1 |
0.2 |
>6 |
|
Sodium |
CLIA |
3.09 |
1.4 |
0.4 |
3.9 |
|
Sodium |
4 mEq/L |
2.72 |
0.5 |
0.2 |
>6 |
|
Urea Nitrogen |
CLIA 9% or |
12.71 |
6.3 |
3.2 |
2.0 |
|
Urea Nitrogen |
2.0 mg/dL |
9.00 |
5.6 |
1.7 |
2.0 |
|
Uric Acid |
CLIA |
17.00 |
1.1 |
1.0 |
>6 |
|
Uric Acid |
17% |
17.00 |
1.9 |
0.6 |
>6 |
There are even more Six Sigma assays when Atellica is judged by CLIA 1992 TEa goals. This instrument is well positioned to meet the current compliance requirements of US laboratories. Of course, there aren't as many TEa goals set by CLIA from 1992, GGT and CEA are not directly regulated in those guidelines.
What about the proposed update to goals for CLIA?
|
TEST |
TEa Source |
TEa |
% Bias |
CV |
Sigma |
|
Albumin |
CLIA 2019 proposed |
8 |
0.5 |
1.7 |
4.4 |
|
Albumin |
+/- 8% |
8 |
0.15 |
1.4 |
5.7 |
|
ALT |
CLIA 2019 proposed |
15 |
6.4 |
2.0 |
4.4 |
|
ALT |
+/- 15% |
15 |
6.11 |
0.8 |
>6 |
|
AST |
CLIA 2019 proposed |
15 |
2.7 |
3.0 |
4.1 |
|
AST |
+/- 15% |
15 |
3.35 |
0.8 |
>6 |
|
CEA |
CLIA 2019 proposed |
15 |
6.1 |
5.4 |
1.6 |
|
CEA |
+/- 15% |
15 |
1.01 |
3.5 |
4.0 |
|
Chloride |
CLIA 2019 proposed |
5 |
0.9 |
0.5 |
>6 |
|
Chloride |
+/- 5% |
5 |
0.1 |
0.7 |
>6 |
|
Creatinine |
CLIA 2019 proposed |
12.78 |
7.4 |
2.3 |
2.4 |
|
Creatinine |
+/- 10% or 0.3 mg/dL |
10.00 |
5.9 |
1.2 |
3.4 |
|
GGT |
CLIA 2019 proposed |
15.00 |
3.5 |
2.1 |
5.4 |
|
GGT |
+/- 5 or 15% |
15.00 |
2.9 |
1.5 |
>6 |
|
Potassium |
CLIA 2019 proposed |
7.59 |
1.2 |
0.2 |
>6 |
|
Potassium |
+/- 0.3 mEq/L |
4.94 |
2.1 |
0.2 |
>6 |
|
Sodium |
CLIA 2019 proposed |
3.09 |
1.4 |
0.4 |
3.9 |
|
Sodium |
+/- 4 mEq/L |
2.72 |
0.5 |
0.2 |
>6 |
|
Urea Nitrogen |
CLIA 2019 proposed |
12.71 |
6.3 |
3.2 |
2.0 |
|
Urea Nitrogen |
+/- 9% or 2.0 mg/dL |
9.00 |
5.6 |
1.7 |
2.0 |
|
Uric Acid |
CLIA 2019 proposed |
10.00 |
1.1 |
1.0 |
>6 |
|
Uric Acid |
+/- 10% |
10.00 |
1.9 |
0.6 |
>6 |
The proposed goals for updating CLIA are a bit more challenging. The new goals include specifications for CEA and GGT, so we can see the improvements. But this Atellica looks poised to be able to achieve compliance with updates to CLIA if the specifications are in fact made law.
Finally, here is the assessment if the desirable specifications are created from the Ricos 2014 biological variation database:
|
TEST |
TEa Source |
TEa |
% Bias |
CV |
Sigma |
|
Albumin |
Ricos 2014 |
4.1 |
0.5 |
1.7 |
2.1 |
|
Albumin |
4.1% |
4.1 |
0.15 |
1.4 |
2.9 |
|
ALT |
Ricos 2014 |
27.5 |
6.4 |
2.0 |
>6 |
|
ALT |
27.5% |
27.5 |
6.11 |
0.8 |
>6 |
|
AST |
Ricos 2014 |
16.7 |
2.7 |
3.0 |
4.6 |
|
AST |
16.7% |
16.7 |
3.35 |
0.8 |
>6 |
|
CEA |
Ricos 2014 |
24.70 |
6.1 |
5.4 |
3.4 |
|
CEA |
24.70% |
24.70 |
1.01 |
3.5 |
>6 |
|
Chloride |
Ricos 2014 |
4.6 |
0.9 |
0.5 |
>6 |
|
Chloride |
4.6% |
4.6 |
0.1 |
0.7 |
>6 |
|
Creatinine |
Ricos 2014 |
8.90 |
7.4 |
2.3 |
0.7 |
|
Creatinine |
8.9% |
8.90 |
5.9 |
1.2 |
2.5 |
|
GGT |
Ricos 2014 |
22.10 |
3.5 |
2.1 |
>6 |
|
GGT |
22.1% |
22.10 |
2.9 |
1.5 |
>6 |
|
Potassium |
Ricos 2014 |
5.6 |
1.2 |
0.2 |
>6 |
|
Potassium |
5.60% |
5.6 |
2.1 |
0.2 |
>6 |
|
Sodium |
Ricos 2014 |
0.7 |
1.4 |
0.4 |
negative |
|
Sodium |
0.7 |
0.7 |
0.5 |
0.2 |
0.9 |
|
Urea Nitrogen |
Ricos 2014 |
15.50 |
6.3 |
3.2 |
2.9 |
|
Urea Nitrogen |
15.5% |
15.50 |
5.6 |
1.7 |
5.8 |
|
Uric Acid |
Ricos 2014 |
12.00 |
1.1 |
1.0 |
>6 |
|
Uric Acid |
12% |
12.00 |
1.9 |
0.6 |
>6 |
Summary of Performance by Sigma-metrics Method Decision Chart using WSVP, CLIA and EFLM Goals
We can make visual assessments of this performance using a Normalized Sigma-metric Method Decision Chart:
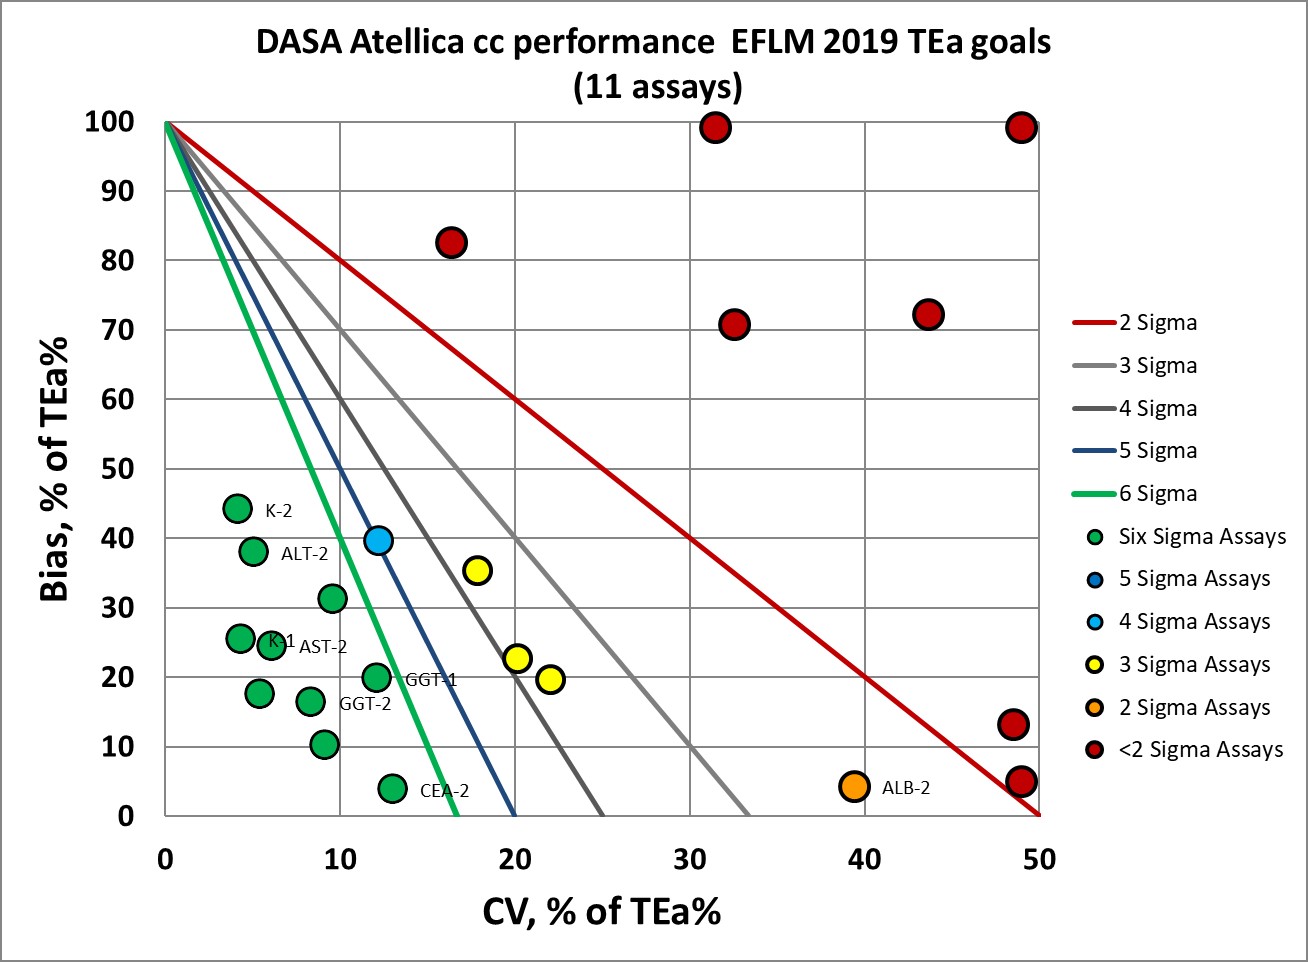
This graph shows that about a third of the levels measured, using EFLM 2019 goals, is 3 Sigma or lower.
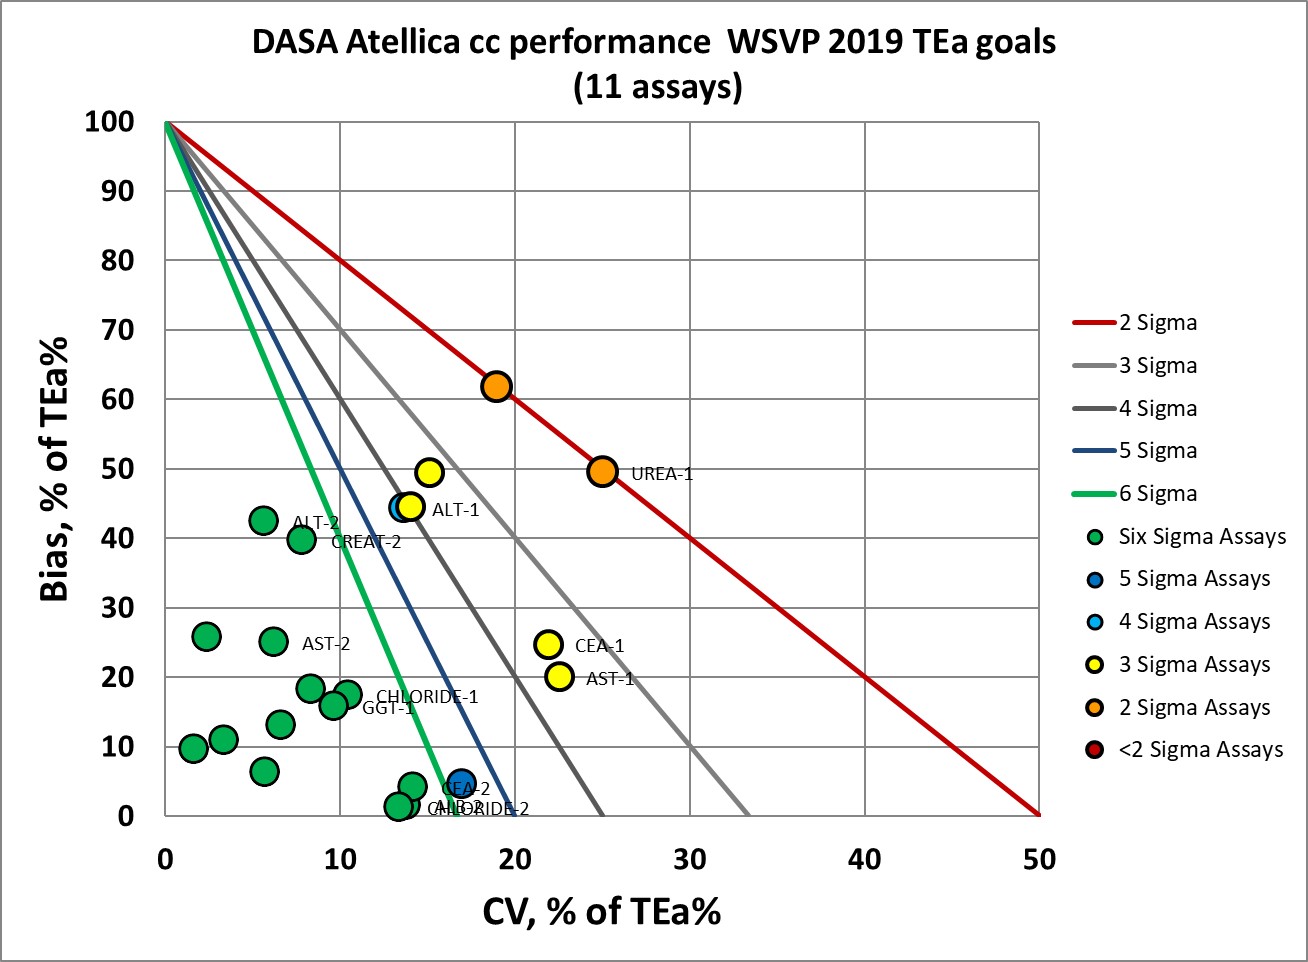
Performance by Westgard Sigma VP standards is much better, we would expect that 8 to 9 of the 11 assays would meet the verification criteria.
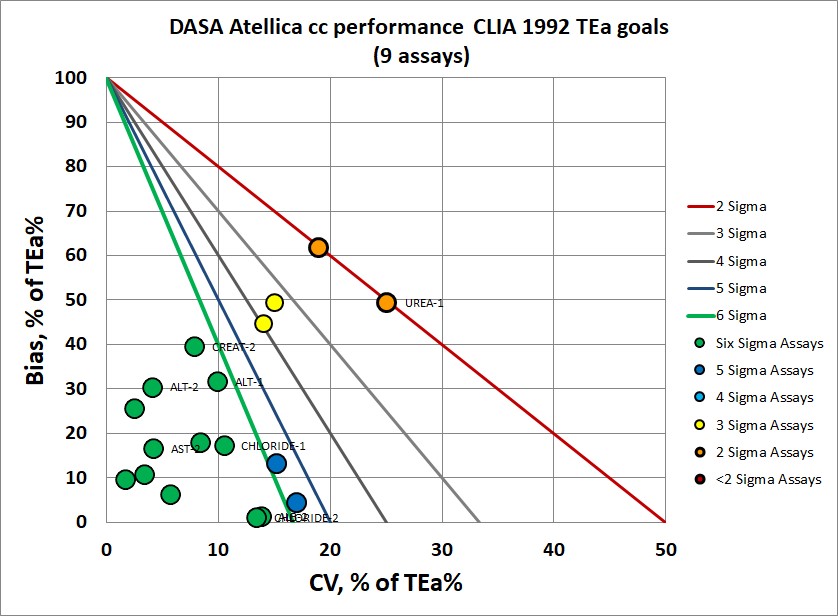
CLIA 1992 PT goals are incrementally more forgiving to the Atellica performance.
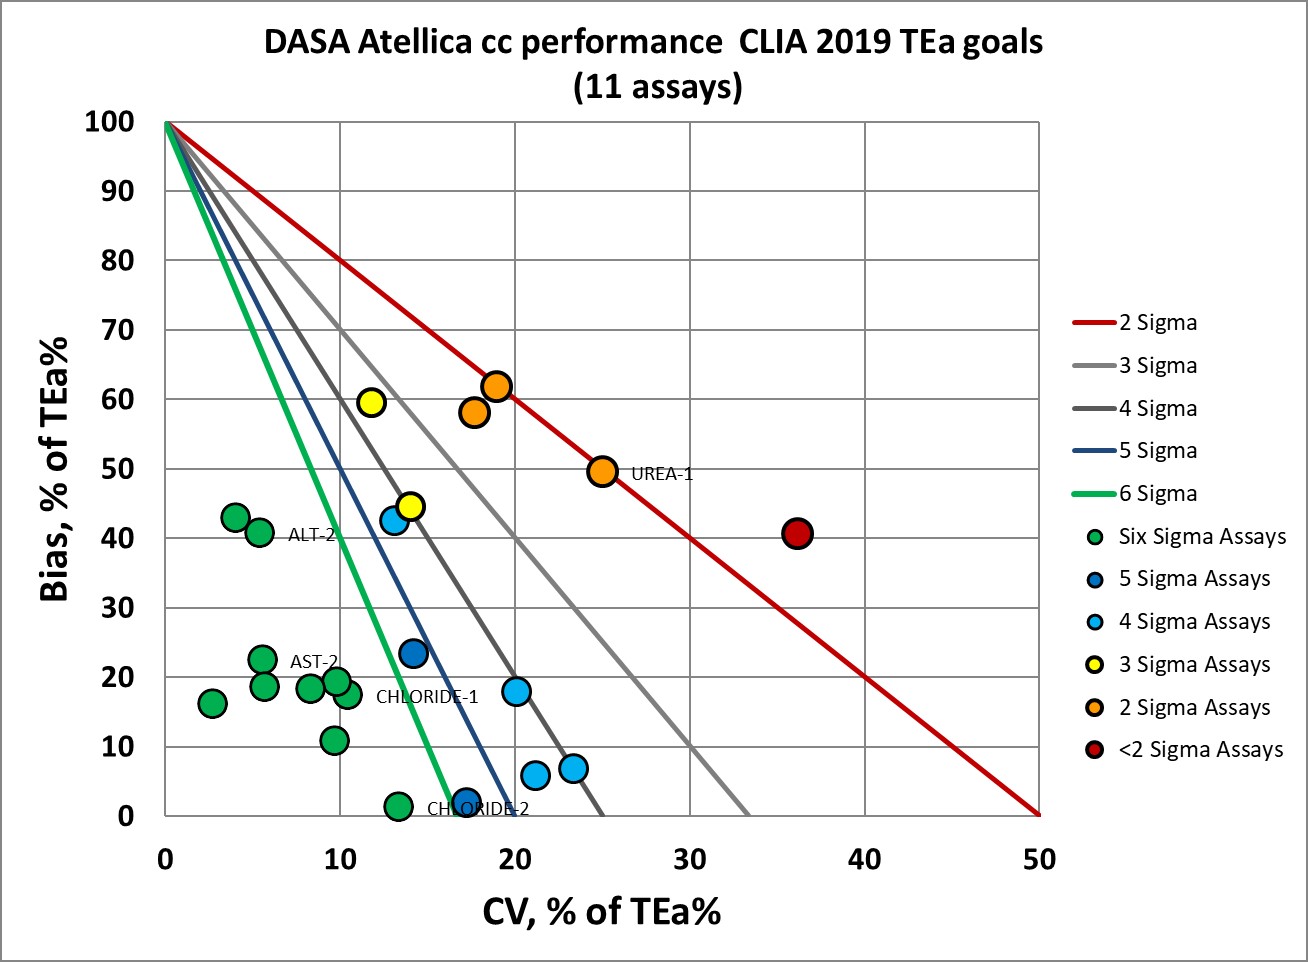
If the proposed tightening of CLIA goals carries forward, a few more levels will be considered less ideal in performance.
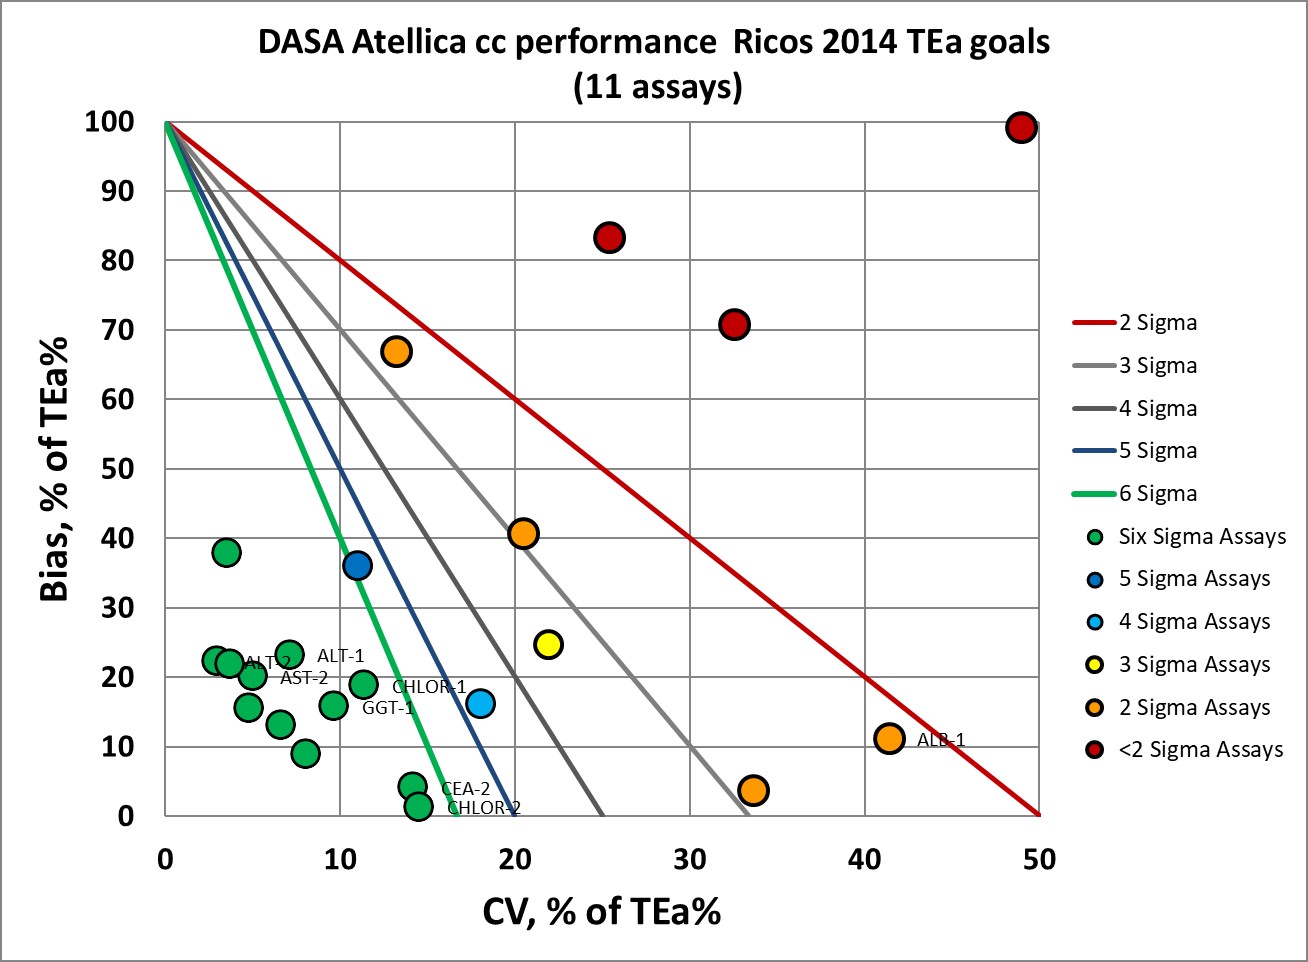
The original "Ricos goals" are about as demanding as the EFLM 2019 goals, with 7 of the 22 measured levels at 3 Sigma or lower.
Conclusion
The authors of the posters conclude that the Atellica performance is uniformly acceptable, but even in the case of the more lenient (or realistic) goals from CLIA, there are assays and levels that do have unacceptable performance. It's possible that laboratories might decide those specific levels are not relevant to clinical care, and that the Sigma-metrics at other levels are more germane. With the Sigma VP goals, performance is definitely more acceptable than what we see using the EFLM goals.
Would the Atellica performance be considered the best choice for a new chemistry analyzer? Individual laboratories will have to make that decision, depending on which goals are being adopted as benchmarks.
The greater issue is to raise concerns about the viability of new performance specifications derived from "EFLM goals". The desirable performance specifications that can be calculated from the database, as stated in earlier articles, are so tight that even the latest instrument is challenged to meet them. Does this invalidate the goals, the instrument, or both? Perhaps a new version of performance specifications are necessary, ones that are no longer "optimal" "desirable" or "minimum" as the Ricos goals from 1999-2014 formulated (according to the path laid out by Callum Fraser). Perhaps there is a need for "achievable" goals.