QC Design
Establishing Appropriate Risk-Based QC Frequency
Clinical Laboratory News June 2019 issue had an article about QC Frequency. Dr. Westgard was interviewed for that article, plus here are some additional extras that support the piece.
Establishing Appropriate Risk-Based Laboratory SQC Practices
James O. Westgard, PhD
June 2019
This is a follow-up discussion to the June 2019 Clinical Laboratory News article on “Challenging the status quo on quality control: A focus on patient risk is driving changes to old paradigms”[1] . The purpose here is to provide more explanation about practical tools that are available to support the planning of risk-based SQC strategies.
The reason we need to scrutinize our current QC frequencies is that the state of QC practice in US laboratories is not good! According to a recent survey organized by Kent Lewandrowski from Mass General and published in the American Journal of Clinical Pathology [ 2], the predominant QC practice is to use 2 SD control limits and analyze 2 controls once a shift or once a day. That practice represents the minimum requirement for compliance with the US CLIA rule [3] to “at least once each day patient specimens are assayed or examined, [laboratories should for] each quantitative procedures include two control materials of different concentrations…” By comparison, ISO 15189 [4] requires laboratories to “design statistical quality control procedures that verify the attainment of the intended quality of results.” The ISO requirement focuses on ensuring quality needed for patient care, whereas the US CLIA requirement focuses on just running controls, a minimum of 2 controls once a day. For regulatory compliance, such a minimum often becomes the maximum standard of practice, as this survey shows
Everyone knows (or they should) that the use of 2 SD control limits causes a problem with false rejections (remember 1 out of 20 outside the limits with N=1 and 1 out of 10 when N=2), but US laboratories have apparently overcome this limitation, possibly by continuously repeating the controls until they are “in”, or by selecting SDs that are inflated for multiple instruments, multiple laboratories, peer groups, or by using manufacturer "bottle values" and assigned values that are expected to encompass the results from a large group of laboratories. In addition, controls are typically analyzed upfront because that provides the best chance of getting the right values, whereas analyzing controls at the end of runs, shifts, or days is much more likely to show problems.
The rationales for such practices are usually economic, i.e., they save time and effort and facilitate the timely reporting of patient results. And they are in compliance with the CLIA regulatory requirements, as well as many manufacturers’ recommendations and US inspection programs that are also aimed at compliance with the CLIA minimum requirements of 2 controls per day or 2 controls per shift. Compliance is much simpler in the face of the confusion that has resulted from the introduction of risk management concepts, which are supposed to focus QC on patient safety and reducing the risk of patient harm from erroneous test results.
Why risk management?
Manufacturers started pushing for a risk management approach many years ago in order to have more flexibility in meeting QC regulations for POC devices. Remember the transition from Statistical QC to Electronic QC to Equivalent QC to Individualized QC Plans. SQC was considered too difficult in POC settings, so CMS haphazardly approved the use of Electronic QC (EQC) and soon learned that approach was not reliable. Then came "Equivalent QC" (also EQC) to justify Electronic QC, but there was no definition of the meaning of “equivalent” and the validation protocols for establishing weekly and even monthly QC frequency were themselves invalid, thus EQC was still mired with questions of reliability. Finally, CMS joined together with CLSI and instrument manufacturers (AdvaMed) to promote risk management as the solution for a flexible QC approach. That led to the development of two CLSI guidance documents, EP23 for the idea of a QC plan based on risk management principles [5] and C24-Ed4 for applying risk management principles to the planning of SQC procedures [6].
The idea of a risk-based QC plan is good in principle for providing many alternative ways of controlling a medical device, but it is bad in practice because, as currently implemented in the US, every plan is so "individual" that there is no reproducibility of plans from lab to lab. Nor is there a scientific approach to determining QC frequency - all the risk analysis ultimately leads to an arbitrary decision of "once a month", "once a week", or "once a day", which is the same frequencies that were being used before the risk-based plans were put into place. A real risk-based QC plan depends on implementing a proper process for risk management, which itself is very complicated. Labs and lab staff have not been trained to do risk management and adapting industrial approaches has not been successful. Because of these difficulties, we have been left with a CMS guideline for developing Individualized QC Plans [7] based on the following:
- What are our possible sources of errors?
- Can our identified sources of errors be reduced?
- How can we reduce the identified sources of errors?
This is not risk management, this is mere hazard identification - the first important step in risk assessment but not the entire process. If you answer NO to the 2nd question, the current CMS approach tells you to ignore the error, rather than make any effort being to detect that error and mitigate its impact. End of error source, no detection mechanism needed, nothing to include in the plan, no QC problem but also no assurance of quality!
Risk-based SQC – a better approach than an IQC plan
Application of risk management principles to the design of SQC procedures should be a more fruitful approach because it can be quantitative and reproducible, i.e., it can lead to a right way or right SQC procedure based on stated assumptions and defined planning parameters. The currently accepted approach is to utilize Parvin’s model for patient risk [8], which depends on defining the quality requirement as an allowable Total Error, characterizing method performance in terms of precision and bias, then optimizing the QC rules, number of control measurements, and the frequency of QC events, taking into account the rejection characteristics of the SQC procedure and considering the risk of producing erroneous patient results when an undetected out-of-control error conditions occurs. Accounting for all these variables, of course, makes for a complicated planning process that requires a carefully structured approach and practical planning tools. The CLSI C24-Ed4 document provides a theoretical “roadmap”, but leaves it to the individual laboratory to implement a practical approach. Therein lies the problem – converting theory to practice.
Practical tools
Parvin’s patient risk parameter, called MaxE(Nuf), is a challenge to understand and also difficult to calculate. To make it easier to use, graphical tools have been developed to support laboratory applications [9-15]. Some of these tools focus on relating the Sigma performance of the testing process to MaxE(Nuf), which can then be converted to run size, i.e., the number of patient samples between consecutive QC events for bracketed operation of continuous production processes, which is the recommended practice in C24-Ed4. Other tools relate Sigma performance directly to run size to further simplify the determination of QC frequency.
Sigma-metric Run Size Nomogram.
An example of this tool was included in the Clin Lab News article. To use this tool, a laboratory first calculates the Sigma-metric based on the quality required for the test (Allowable Total Error, TEa, or ATE) and the precision (CV) and bias observed for the measurement procedure:
Sigma = (%ATE - |%bias|)/%CV
For example, given that %ATE is 6.0%, %Bias is 2.0%, and %CV is 1.0%, Sigma would be (6.0-2.0)/1.0 or 4.0. That Sigma value is located on the x-axis and a vertical line drawn to intersect the lines on the graph that represent different control rules and different numbers of control measurements. Then the appropriate run sizes can be read off the y-axis, as illustrated in Figure 1.
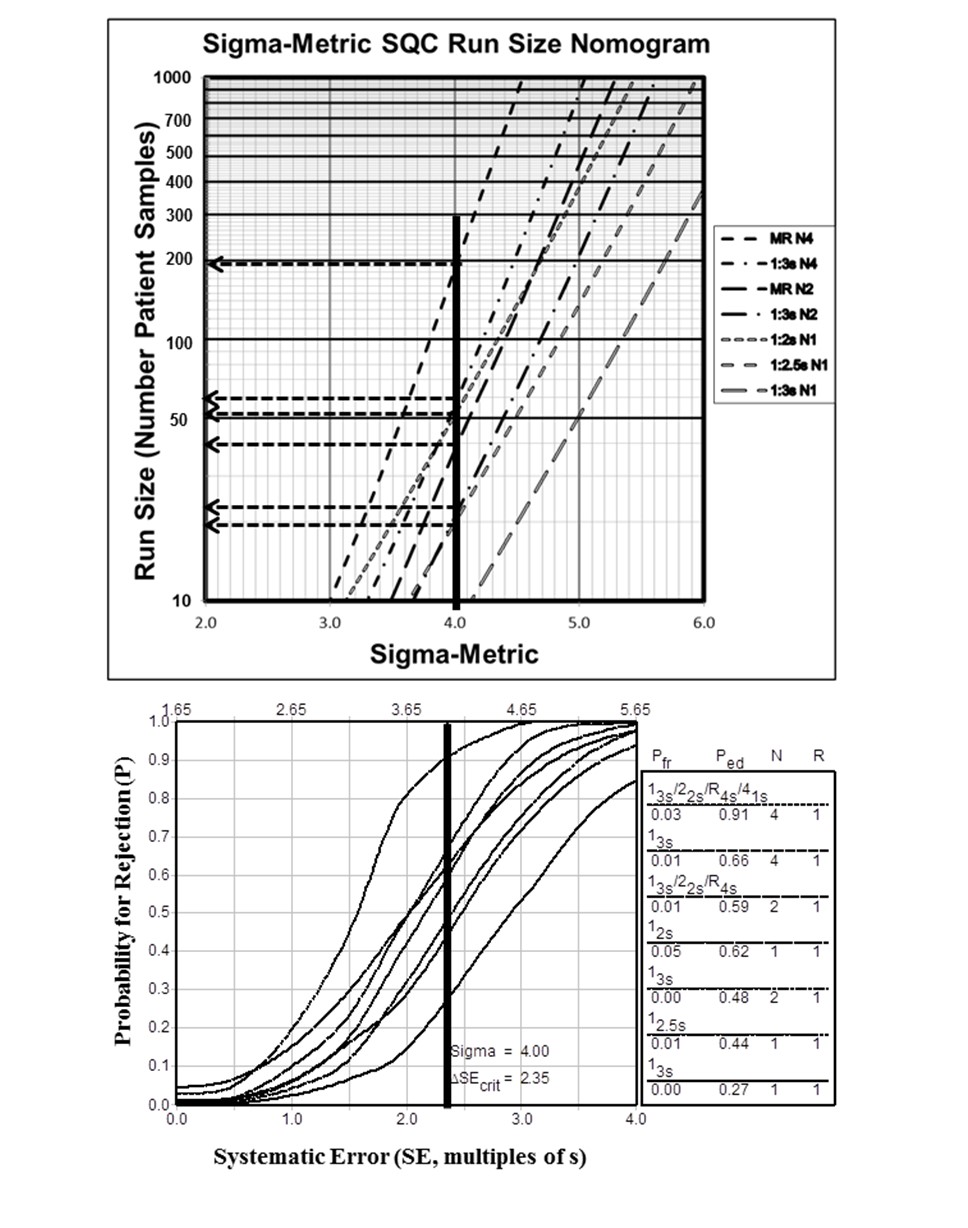
Figure 1. Sigma-Metric Run Size Nomogram (top) and Power Function Graph (bottom) for 4.0 Sigma Testing Process.
Run size would be about 190 patient samples for a multirule procedure with 4 control measurements per run (13s/22s/R4s/41s with N=4) but only 40 patient samples for a multirule procedure with 2 control measurements per run (13s/22s/R4s with N=2). It is also recommended that the laboratory examine the probabilities for error detection (Ped) and false rejection (Pfr) to understand the expected behavior of the QC procedure. These probabilities can be read off the accompanying power function graph, e.g., Ped is 0.91 and Pfr is 0.03 for the MR with N=4 and Ped is 0.59 and Pfr is 0.01 for MR with N=2.
Sigma-metric Run Size Matrix.
|
Candidate SQC (Pfr) |
Maximum Run Size / Ped |
|||||
|
6-Sigma |
5.5-Sigma |
5.0-Sigma |
4.5-Sigma |
4.0-Sigma |
3.5-Sigma |
|
|
MR N4 (0.03) |
≥1000 |
≥1000 |
≥1000 |
800 |
190 |
40 |
|
1.00 |
1.00 |
1.00 |
0.98 |
0.91 |
0.73 |
|
|
1:3s N4 (0.01) |
≥1000 |
≥1000 |
900 |
220 |
60 |
15 |
|
1.00 |
1.00 |
0.99 |
0.89 |
0.66 |
0.41 |
|
|
MR N2 (0.01) |
≥1000 |
≥1000 |
470 |
120 |
40 |
10 |
|
1.00 |
0.99 |
0.94 |
0.82 |
0.59 |
0.35 |
|
|
1:2s N1 (0.05) |
≥1000 |
≥1000 |
370 |
140 |
50 |
20 |
|
0.98 |
0.97 |
0.91 |
0.80 |
0.62 |
0.43 |
|
|
1:3s N2 (0.00) |
≥1000 |
700 |
220 |
70 |
25 |
<10 |
|
0.98 |
0.96 |
0.86 |
0.70 |
0.48 |
0.25 |
|
|
1:2.5s N1 (0.01) |
1000 |
400 |
150 |
50 |
20 |
<10 |
|
0.94 |
0.92 |
0.82 |
0.66 |
0.44 |
0.24 |
|
|
1:3s N1 (0.00) |
380 |
150 |
50 |
20 |
10 |
<10 |
|
0.85 |
0.82 |
0.67 |
0.46 |
0.27 |
0.11 |
|
Figure 2. Sigma-Metric Run Size Matrix.
It is possible to summarize all this information for different Sigma values [14] to provide an even simpler design tool, as shown in Figure 2. This matrix includes 7 candidate SQC procedures and Sigma values from 6.0 to 3.5. Estimates of Pfr are shown in parenthesis next to the SQC procedure. Estimates of run size are found in the matrix along with the associated Ped (shown below). For example, identify the multirule procedure with N=4 (MR N4) at the top of the Candidate SQC column. Its Pfr is 0.03 as shown in the parentheses. To assess QC frequency, find the value of 4.0 Sigma in the next to last column on the right. Run size is 190 and the Ped is 0.91 (immediately below run size). All the important information from the Sigma-metric Run Size Nomogram and Power Function Graph can be found in the Run Size Matrix.
Westgard Sigma Rules with Run Size.
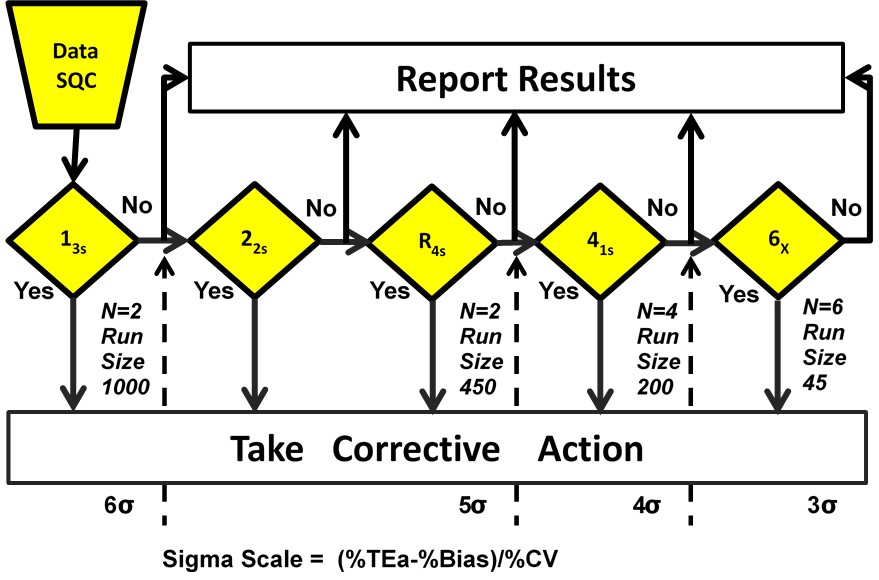
Figure 3. Westgard Sigma Rules with Run Size
A graphical summary of this information is provided in Figure 3, which is a diagram of Westgard Rules that includes a Sigma-Scale at the bottom and also indicates approximate run sizes [14]. For example, for a 4 Sigma process, locate the value 4σ on the Sigma-Scale at the bottom and read up. All the rules to the left should be used, i.e., 13s/22s/R4s/41s; N=4 R=1 means 4 control measurements in a single run; at the bottom below the Sigma value it indicates a run size of 200 patient samples.
What to do?
You may find this discussion to be dense and overwhelming because it summarizes results and recommendations from a dozen or so papers, documents, and guidelines.
- The take-away message is that simple tools are now available to convert the theoretical complexity of planning risk-based SQC procedures to a practical, doable SQC planning approach in your laboratory.
- Risk-based SQC procedures are preferred to IQC plans because there is a quantitative planning methodology that leads to objective evidence-based SQC practices. Total QC plans can be developed to include pre-analytic and post-analytic controls in addition to effective risk-based SQC for the analytic phase. See reference 15 for further explanation.
- The starting point for assessing your SQC practices is to calculate the Sigma-metrics for your testing processes.
- The initial assessment of the adequacy of your QC practices can be made using a graphical tool in the form of Westgard Sigma Rules with Run Size. This is a qualitative planning tool because the Sigma-value is rounded to the nearest whole number.
- Semi-quantitative planning can make use of the Sigma-Metric Run Size Matrix, where the sigma-value is rounded to the nearest 0.5 or whole number.
- More quantitative planning for your exact Sigma value can make use of the Sigma-Metric Run Size Nomogram along with the Power Function Graph, where the Sigma value can be considered to the nearest 0.1.
References
- Scott K. Challenging the status quo on quality control: A focus on patient risk is driving changes to old paradigms. Clin Lab News, June 2019.
- Rosenbaum MW, Flood JG, Melanson SEF, Bauman NA et al. Quality control practices for chemistry and immunochemistry in a cohort of 21 large academic medical centers. Am J Clin Pathol 2018;150-:96-104.
- US Centers for Medicare & Medicaid Services (CMS). Medicare, Medicaid, and CLIA Programs: Laboratory Requirements Relating to Quality Systems and Certain Personnel Qualifications. Final Rule. Fed Regist Jan 24 2003;16:3650-3714.
- ISO 15189. Medical laboratories – Requirements for quality and competence. Geneva:ISO, 2012.
- CLSI EP23A. Laboratory Quality Control Based on Risk Management. Clinical and Laboratory Standards Institute, 950 West Valley Road, Suite 2500, Wayne PA, 2011.
- CLSI C24-Ed4. Statistical Quality Control for Quantitative Measurement Procedures: Principles and Definitions. Clinical and Laboratory Standards Institute, 950 West Valley Road, Suite 2500, Wayne PA, 2016.
- CDC, CMS, US Department of Health and Human Services. Developing an IQCP: A Step-by-Step Guide. www.cddc.gov/CLIA/Resources/IQCP/
- Parvin CA. Assessing the impact of the frequency of quality control testing on the quality of reported patient results. Clin Chem 2008;54:2049-2054.
- Yago M, Alcover S. Selecting statistical procedures for quality control planning based on risk management. Clin Chem 2016;62:959-965.
- Bayat H. Selecting multi-rule quality control procedures based on patient risk. Ms accepted by Clin Chem Lab Med 2017;55:1702-1708.
- Bayat H, Westgard SA, Westgard JO. Planning risk-based SQC strategies: Practical tools to support the new CLSI C24Ed4 guidance. J Appl Lab Med 2017;2:211-221.
- Westgard JO, Bayat H, Westgard SA. Planning risk-based SQC schedules for bracketed operation of continuous production analyzers. Clin Chem 2018;64:289-296.
- Westgard SA, Bayat H, Westgard JO. Selecting a risk-based SQC procedure for HbA1c and a Total QC Plan. J Diabetes Tech Science. 2018;12:780-785.
- Westgard JO, Westgard SA. Establishing evidence-based statistical quality control practices. Am J Clin Pathol 2019;151:364-370.
- Westgard SA, Bayat H, Westgard JO. Selecting a risk-based SQC procedure for HbA1c and a Total QC Plan. J Diabetes Tech Science. 2018;12:780-785.