Basic Method Validation
COVID-19 Serology Testing Strategy: Confirm Positive Results
CDC is strongly recommending that laboratories check their positive results with confirmatory testing. Here's Why and Here's How.
COVID-19 Serology Testing Strategy: Confirm Positive Results
A Two-Test Predictive Value Calculator to Assess Effectiveness of Confirming Positive Results
James O. Westgard, Sten A. Westgard, Paul Schilling
May 2020
There has been considerable discussion of the potential difficulties in using antibody tests for surveillance of the population where the prevalence of disease is expected to be low. There is even greater concern if an antibody test becomes a “passport” for return to the workplace and resumption of normal activities. This “passport” further assumes that the presence of antibodies provides immunity to further infection, a premise that is under investigation, but yet to be proven by research studies.
The danger is due to false positive test results. False positives are likely in populations that have a low prevalence of disease unless the test has almost perfect specificity approaching 100%. The reliability of a positive test result is indicated by its “predictive value”, which is calculated from the sensitivity and specificity of a test and the prevalence of disease in the population. For example, a positive predictive value (PPV, PVpos) of 30% would mean that only 3 of 10 positive subjects have antibodies to the disease. The other 7 of 10 are false positives and may still be a danger to society. See the earlier discussion of predictive value on this website.
See even more stories about COVID-19 Laboratory Challenges...
The importance of predictive value was highlighted in an editorial in the American Journal of Clinical Pathology that appeared May 15, 2020, online ahead-of-print [1]. Interestingly, the authors include performance claims from the FDA EUA database to substantiate their argument:
“Average sensitivity and specificity of FDA-approved antibody tests is 84.90% and 98.63%, respectively… Given variable prevalence of COVID-19 (1%-15%) in different parts of the US and differences in performance characteristics of antibody tests (FDA approved and unapproved), statistically the PPV [Positive Predictive Value] will vary widely and can be as low as 30% to 50% in areas with low prevalence.”
Strategy to Confirm Positive Results
Fortunately, the data coming out about the performance of new antibody tests shows that many methods achieve high specificity. While sensitivity is not always as good, these tests may still provide excellent performance when used in combinations, i.e., all positive results from the first test are repeated by a second test for confirm.
On May 27, 2020, CDC released a new document providing “Interim guidelines for COVID-19 antibody testing.” [2] In discussing how to optimize testing strategies, it emphasizes the importance of positive predictive value (PPV, PVpos), suggesting three strategies:
- “Choosing a test with a very high specificity, perhaps 99.5% or greater, will yield a high positive predictive value in populations tested with prevalence ≥ 5%.
- Another strategy is to focus testing on persons with a high pre-test probability of having SARS-CoV-2 antibodies, such as persons with a history of COVID-19 like illness.
- A third approach is to employ an orthogonal testing algorithm in which persons who initially test positive are tested with a second test. Effective orthogonal algorithms are generally based on testing a patient sample with two tests, each with unique design characteristics (e.g., antigens or formats).”
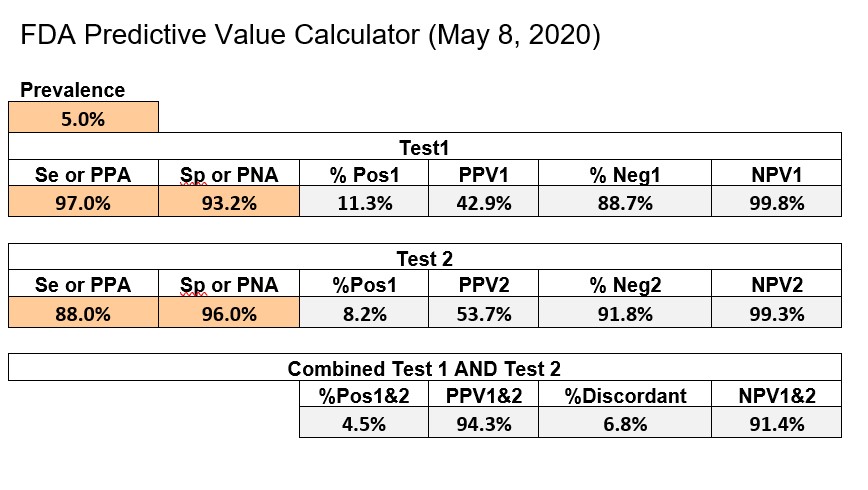
CDC recommends using the online Excel calculator provided by FDA, which can be downloaded from its website. The example below shows an implementation of the FDA Excel calculator with some format changes to fit everything on a single page.
The first test has Se of 97.0%, Sp of 93.2%, whereas the 2nd test has an Se of 88.0% and Sp of 96.0%. FDA uses a prevalence of 5.0% as their benchmark for calculating predictive value and actually adds the PPV and NPV figures to the information on the EUAs on their website. The bottom line shows the performance of the combination of Test1 and Test2.
Internet Calculator for Predictive Value of Two Tests
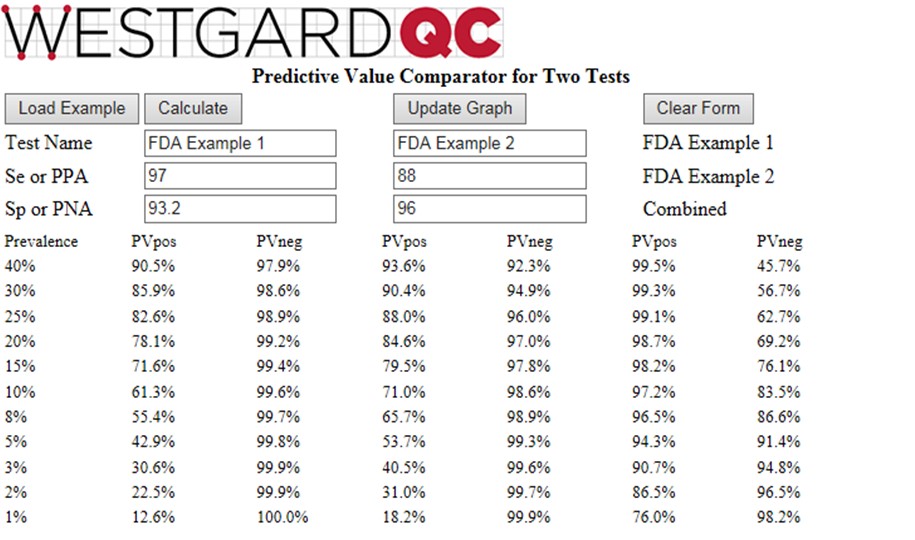
To provide these calculations for a wide range of prevalences, we are introducing a new web calculator http://tools.westgard.com/predictive.shtml for comparing and combining two different tests. This should help you assess the effectiveness of a repeat strategy for tests available in your laboratory or for selecting new tests and establishing a repeat test strategy.
A note about terminology and calculations: we find PPV is sometimes confusing because a similar abbreviation PPA is often used for Percent Positive Agreement or Sensitivity. Therefore we have used the abbreviations PVpos and PVneg instead of PPV and NPV because we think those terms more clearly distinguish Predictive Value. The equations for the calculations are provided in the appendix of this essay.
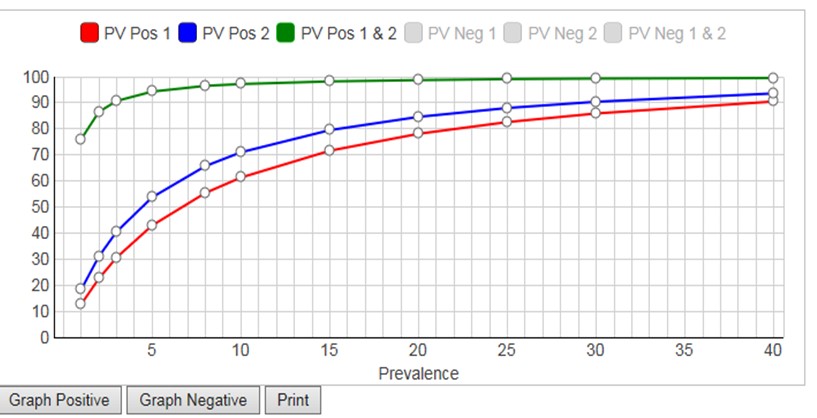
The calculator considers prevalences from 1% to 40%, calculates PVpos for test1, PVpos for test2, PVpos for the combination of Test1 and Test2 (and also the Negative Predictive Values, NPV, or PVneg). A graphical display of Predictive Value (y-axis) vs Prevalence (x-axis) is available for either PVpos or PVneg. Displaying both PPV and NPV at the same time overloads the graph, but you have the option to display either (Graph Positive, Graph Negative) and then print the results. If you want graphical output for both, print the positive graph and then switch the negative graph and print again.
To see how the calculator works, you can click the “Load Example” button which will then provide the Se and Sp values in the FDA example. The calculated PPV (PVpos) and NPV (PVneg) are given in the table and can be displayed graphically (click Update Graph).
Given the FDA requirements that SE should be 90% or greater and Sp should be 95% or greater [2], neither of the tests in the FDA example satisfies both requirements. Yet, it is obvious that the combination of those two tests will be highly effective for identifying subjects who have antibodies to COVID-19. At the FDA target prevalence of 5.0%, Test1 has PVpos of 42.9%, Test2 has PVpos of 53.7%, and the combination has a PVpos of 94.3%. This shows the power of employing a strategy to confirm positive test results by a 2nd method.
References
- Mathur G, Mathur S. Antibody testing for COVID-19: Can it be used as a screening tool in areas with low prevalence? Am J Clin Pathol 2020. https://doi.10.1093/ajcp/aqaa082.
- CDC Interim Guidelines for COVID-19 Antibody Testing, May 27, 2020. https://www.cdc.gov/coronavirus/2019-ncov/lab/resources/antibody-tests-guidelines.html
- FDA Policy for Coronovirus Disease-2019: Tests during the public health emergency. Immediately in effect guidance for clinical laboratories, commercial manufacturers, and Food and Drug administration staff. US Dept Health Human Services, FDA, Center for Devices and Radiological Health. May 4, 2020.
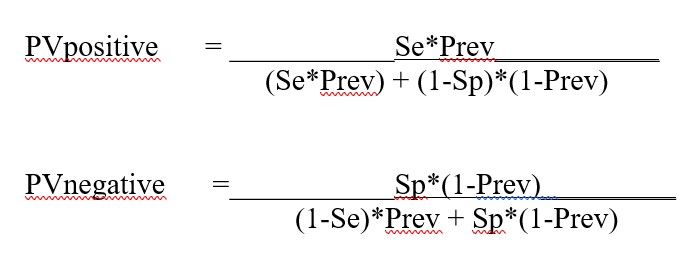
Appendix. Equations for calculations in Predictive Value Two Test Comparator
Se or PPA Value between 0.0 and 1.0, or 0.0% and 100%
Sp or PNA Value between 0.0 and l.0, or 0.0% and 100%
Prevalence Value between 0.0 and 1.0, or 0.0% and 100%
Se1 Sensitivity of Test1
Sp1 Specificity of Test1
Se2 Sensitivity of Test2
Sp2 Specificity of Test2
Equations for calculating the predictive value for Test1 (Se1, Sp1) and Test2 (Se2. Sp2)
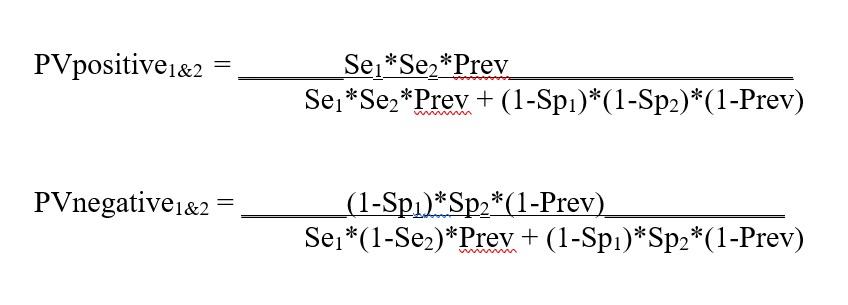
Equations for calculating the predictive values for combination of Test1 and Test2 (from FDA Excel calculator downloaded May 8, 2020):