Trends
The Myth of Medical Decision Limits
Medical Decision Limits are described as a "second set of limits set for control values ...meant to be a wider set of limits indicating the range of medically acceptable results." The idea is that these medical decision limits embody the medical usefulness requirement for a test and by drawing these limits on our control charts, we will detect medically significant errors. Using CLIA QC requirements and practical examples, Dr. Westgard evaluates these MDLs and reveals their true nature.
- Clarification of terms
- Current use of MDLs
- CLIA QC requirements and MDLs
- Example practices for setting MDLs
- Need to evaluate MDL practices
- Comparing control chart limits
- What's the point?
- Procedure for evaluating QC practices
- Do MDLs really work? The answer!
- References
The Myth of Medical Decision Limits
When I discussed myths of quality is an earlier essay, my intention was to illustrate the falsehood of some apparently well-accepted and well-documented beliefs, such as the existence of California as an island, which was documented in black and white by many reputable maps published in the 1600s. I suggested that some of our beliefs in healthcare quality assurance and laboratory quality control may also be myths, even though they appear in black and white in our professional magazines, journals, and books.
One of the current myths about QC is the use of medical decision limits on quality control charts to assure test results have the quality necessary for medical or clinical usefullness. As I was contemplating a topic for this month's essay, we received an e-mail question about the proper way to implement "medical decision limits," so this seems like a timely issue to discuss. With the background materials now available on this website, this issue can be understood in greater depth than would have been possible at the time of my earlier discussion of myths of quality.
Clarification of terms
"Medical decision limits" (MDL) is the term used by Tetrault and Steindel in the 1994 CAP Q-Probe which reviews daily quality control exception practices [1]. MDLs are described as a "second set of limits set for control values ...meant to be a wider set of limits indicating the range of medically acceptable results." The MDL concept is referenced to an earlier paper by Steindel [2], which in turn is referenced to an earlier abstract by a CAP group [3], but neither of these earlier references provide a more objective definition. Basically, the idea is that these medical decision limits embody the medical usefulness requirement for a test and by drawing these limits on our control charts, we will detect medically significant rather than statistically significant errors.
MDL should not be confused with our use of medical decision level (Xc), which refers to a the level or concentration at which a test is critically interpreted for patient care and treatment. Our approach for dealing with a clinical quality requirement is to define a medically important change (or clinical decision interval, Dint) at a medical decision level (Xc), then use a clinical quality planning model to derive (translate) the medical usefulness requirement into operating specifications for imprecision and inaccuracy that are allowable and the QC that is necessary. As illustrated in an earlier cholesterol QC planning application, this QC planning process leads to the selection of QC acceptability criteria (control rules) and the number of control measurements that are appropriate for individual tests performed by individual methods in individual laboratories. This is a well-defined and quantitative process that is quick and easy to perform when supported with appropriate tools, technology, and training.
Current use of MDLs
The Q-Probe survey [1] revealed that MDLs were used by about 30% of laboratories, but the authors noted that only 10-25% reported MDL limits wider than their analytical limits, which they interpreted as evidence that the application of MDLs was incorrect (which should not be unexpected given the lack of information and guidelines in the scientific literature). To improve the use of MDLS, they provided the following recommendations for setting MDLs:
"A good way to set medical decision limits is to set them based on either biological or medical need. You might also want to set them based on the rule system you use. For example, you may want to set an analytical limit somewhat tightly, at 2.0 SD, and the medical decision limit wider, at 3.5 SD. In this way, you could release medically acceptable results and still be warned of an impending analytical problem that you can fix at, hopefully, your leisure instead of by a deadline needed to report results."
It certainly is appealing to set wider control limits and have fewer run rejections. But, do MDLs really work? Or, is the MDL a modern myth that is being passed on without any scientific merit?
CLIA QC requirements and MDLs
CLIA allows laboratories the flexibility to define their own QC procedures, which means they can set the control limits in any way that is appropriate, including the use of MDLs if they are valid. Originally, it was proposed that manufacturers would provide QC instructions, and when approved or validated by FDA, laboratories could follow the manufacturer's approved QC instructions. In the absence of approved QC instructions (for which the approval process was delayed from 1992 to 1994 to 1996 and now further into the future), laboratories are still responsible under CLIA to establish appropriate QC procedures, as described in the rule 493.1218(b) [4]:
"...the laboratory must evaluate instrument and reagent stability and variance in determining the number, type, and frequency of testing calibration or control materials and establish criteria for acceptability used to monitor test performance during a run of patient specimen(s)."
Example practices for setting MDLs
In 'Walking the straight and narrow on quality control,' Passey [5] provided a detailed discussion of CLIA QC requirements and illustrated how this concept of medically useful control limits might be implemented:
"Laboratories must calculate the means and standard deviations of the control values for each lot of materials used for quality control... These statistical estimates are used along with consideration for medical requirements to establish the acceptability criteria for quality control. For example, if a test's measured imprecision indicates that the method can determine glucose with an SD of 2 mg/dL but medical usefulness dictates a preferrable SD of 4 mg/dL, construct your acceptability criteria around the larger medical requirement... Carefully consider changing your acceptability criteria (out of control) from +/- 2SD to +/-3SD. Even better, use a fixed window (+/- allowable error) that reflects both medical usefulness and analytical capability."
Thus, common professional practices for setting control limits on Levey-Jennings charts now include the use of statistical control limits, such as the mean plus/minus 2 or plus/minus 3 SDs, but also the use of medical decision control limits calculated from a medically allowable SD or representing a fixed error requirement, such as the CLIA proficiency testing criterion for acceptable performance. Other related practices may be to use a manufacturer's claim for method performance as the standard deviation to calculate control limits or a manufacturer's "acceptable range" as fixed control limits.
Need to evaluate MDL practices
Laboratories should evaluate whatever practice they follow to be sure their QC acceptability critieria are valid, particularly in the light of the FDA suggestions for validating QC procedures. In a draft document [6], FDA described a valid QC procedure as "...one that adequately maintains and monitors stated analytical performance characteristics and, at the same time, alerts the analyst to unsatisfactory performance when known and/or unknown technical variables are introduced. These procedures should adequately address the critical performance parameters of accuracy and precision within the reportable range of the test." These FDA guidelines were aimed at manufacturers, but in the absence of FDA clearance of manufacturers' QC instructions (which may be delayed indefinitely), laboratories performing moderately and highly complex tests are still responsible under CLIA for documenting their QC procedures.
Comparing control chart limits
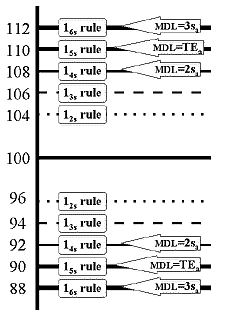 Consider our glucose method where a control material shows a mean of 100 mg/dL and standard deviation of 2 mg/dL (or 2.0% CV). For a Levey-Jennings chart, 2 SD limits (12s rule) would be set as 96 and 104; 3 SD limits (13s rule) would be 94 and 106. If it were of interest, what would be the limits for the 14s, 15s, and 16s rules? The answers would be 92 and 108, 90 and 110, and 88 and 112, correct? Let's draw all these control rules on a control chart, as shown here.
Now, suppose the medically allowable SD for this test (sa) has been defined as 4 mg/dL, which means the analytical performance appears to be better than needed for the medical use of this test. What control limits would results if this medical or clinical SD where used to calculate 2 SD and 3 SD control limits? Those limits would be 92 to 108 and 88 to 112, right? If you were to draw them on the control chart, they would be the same as the 14s and 16s statistical limits. Thus, these supposedly clinical limits still correspond to particular statistical control rules.
Also consider that the allowable total error (TEa) for this test is given as 10% by the CLIA proficiency testing criterion. This means that a value of 100 must be good to within 90 to 110 units. If this total or fixed error criterion were used to set control limits, these limits would be the same as the 15s statistical control rule, thus again, a supposedly fixed allowable error corresponds to a particular statistical control rule.
What's the point?
Any control limit, regardless of the rationale for drawing it on the chart, still corresponds to a statistical control rule. The actual performance of that control limit,or control procedure, can be assessed from the power curves for that particular statistical control rule. Given a quality requirement in the form of an allowable total error or a clinical decision interval, and given the imprecision and inaccuracy of your method, you can evaluate the performance of any recommended QC practice.
Procedure for evaluating QC practices
The key is to determine the actual statistical QC rule that is being implemented based on the control limits being set, then find the power curves for that statistical rule to evaluate the performance of the QC procedure. This can be done as follows:
- Calculate the actual control limits.
- Take the difference from the mean.
- Divide the difference by smeas to determine the number of multiples of the SD.
- Identify the control rule considering the number of measurements that must exceed the control limits.
- Calculate the critical-sized systematic error.
- Impose the critical systematic error on the power curves for the statistical control rules of interest to evaluate the error detection and false rejection characteristics of that QC rule
Do MDLs really work?
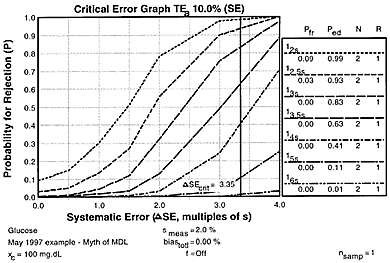 For our glucose example where the CLIA criterion for acceptable performance(TEa) is 10%, the observed method imprecision (smeas) is 2.0%, and the medically allowable imprecision (sa) is 4.0%, let's assume bias is 0.0%, then the critical systematic error that needs to be detected by the QC procedure is 3.35 smeas [from equation ((TE - bias)/smeas) - 1.65 ]. The accompanying critical-error graph shows the power curves for common statistical control rules all with N=2, as well as the possible medical decision limits that corresponded to statistical control rules of 14s (2 times medically allowable SD), 15s (CLIA fixed error limit), and 16s (3 times medically allowable SD).
Observe that the critical systematic error would be detected only 42%, 11%, and 1% of the time, resp., by the MDLs corresponding to 14s, 15s, and 16s. Use of a 12.5s limit would detect the critical systematic error 93% of the time and have only a 3% false rejection rate, thus a simple, practical, effective, and appropriate QC procedure is available to assure the necessary quality is achieved, but it doesn't correspond to any of the possible medical decision limits.
This shows that MDLs don't really work! They may reduce the number of run rejections (including the number of rejections of runs that have medically important errors), but they won't assure the medically necessary quality. The idea is good, the words sound right, but the practice is wrong. MDLs are a modern myth with no scientific justification.
For the right way to assure the clinical quality needed for a glucose test, see our earlier glucose POC example application.
For a similar discussion with potassium as an example, see reference 7. You need to take the time to understand this issue and be sure that the myth of MDLs doesn't exist in your own laboratory.
References
- Tetrault GA, Steindel SJ. Q-Probe 94-08. Daily quality control exception practices. Chicago: College of American Pathologists, 1994.
- Steindel SJ. New directions in quality control: Part I. New QC systems. Lab Med 1986;17:463-466.
- Howanitz PJ, Kafka MT, Steindel SJ, et al. Quality control run acceptance and rejection using fixed and medically useful limits for QAS Today. Clin Chem 1985;31:1016 (abstract).
- Health Care Financing Administration (HCFA) and Public Health Service (PHS), US Dept of Health and Human Services (HHS). Medicare, Medicaid and CLIA Programs: Regulations implementing the Clinical Laboratory Improvement Amendments of 1988 (CLIA) and Clinical Laboratory Improvement Act program fee collection. Fed Regist 1993;58:5215- 37.
- Passey RB, Walking the straight and narrow on quality control. Med Lab Observ 1993;25(2): 39-43.
- Draft FDA Guidance to Manufacturers of In Vitro Analytical Test Systems for Preparation of Premarkt Submissions Implementing CLIA. December 17, 1992: obtained from the Division of Small Manufacturers Assistance (DSMA)(HFZ-220), Center for Devices and Radiological Health, Food and Drug Administration, 5600 Fishers Lane, Rockville, MD 202957.
- Westgard JO, Quam EF, Barry PL. Establishing and validating QC acceptability criteria. Med Lab Observ 1994;26(2):22-26.