Guest Essay
Defect Rates, Quality and Productivity
Robert W. Burnett, Ph.D.
Dr. Robert Burnett describes the need to focus our future thinking on defect rates to better manage the analytical quality of laboratory tests. In the midst of our preoccupation with the profound changes that are taking place in health care delivery in general, and laboratory medicine in particular, it might be of some comfort to realize that there are some fundamental things that have remained the same. Two management objectives that have not changed in organizations, including clinical laboratories, are the need for high quality and the need for high productivity.
- Current priority on productivity
- Current thinking about quality
- Need to consider defect rate
- Importance of error frequency
- Defects vs. blunders
- Difficulties in estimating error frequencies
- Playing it safe with QC design
- What to do!
- References
- Biography: Robert W. Burnett, Ph.D.
As the nineteenth century French author Alphonse Karr observed, "The more things change, the more they remain the same." In the midst of our preoccupation with the profound changes that are taking place in health care delivery in general, and laboratory medicine in particular, it might be of some comfort to realize that there are some fundamental things that have remained the same. Two management objectives that have not changed in organizations, including clinical laboratories, are the need for high quality and the need for high productivity.
Current priority on productivity
Perhaps the emphasis has shifted. Fifteen or twenty years ago we could afford to focus mainly on the quality of our product. It was fine to be efficient, but with a lot of inpatient days, a high volume of ordered tests, and a predominately fee-for-service payment system, it didn't have to be a top priority. Now, changes in reimbursement have made laboratories cost centers. The majority of patients' hospital bills are paid either on the basis of a fixed per diem, a fixed amount determined by the diagnosis, or some other variety of flat rate that has nothing to do with the actual procedures and tests performed for an individual patient. In hospital laboratories, the sudden shift from profit center to cost center has prompted downsizing and reorganizing. At the same time much more effort is being spent to control test utilization and to reduce the cost of performing those tests that remain. The prevailing feeling in most laboratories is that quality is high enough, but test costs need to be reduced more, i.e., productivity needs to be higher. What I will review here are the factors that determine analytical quality from the customer's perspective, the interdependence that exists between quality and productivity, and the trade-offs that are often made.
Current thinking about quality
What evidence do we have that analytical quality is generally high? In a recent publication [1] Westgard et al. found that only one of eighteen common laboratory tests was routinely performed with precision high enough that current QC practices could detect medically important errors. This raises questions: Why do we laboratory directors not perceive that there is an enormous problem here? And why are we not being bombarded with complaints from the medical staff? To answer these questions, think about how analytical quality is perceived by people outside the laboratory. As laboratory professionals, we are aware of several different components and indicators of analytical quality, but our customers are sensitive only to the "bottom line" - which we call the defect rate. This quantity has been defined in the literature on the basis of a fraction of analytical runs with an unacceptable number of erroneous results, but here I want to define defect rate in terms of test results - specifically, the fraction of test results reported with an error greater than TEa, the total error deemed allowable on the basis of medical usefulness.
Need to consider defect rate
The defect rate for a test represents the best single indicator of analytical quality, as perceived by our customers, that we can derive. Unfortunately, measuring defect rate is not as simple as one might think. But to get a rough idea of what a typical defect rate might be, let's say we are running a test on an automated chemistry analyzer, performing QC once a day. If we run every day, and sometimes have an extra run thrown in, we might have 400 runs in a year with, say, an average of 100 samples per run, for a total of 40,000 patient results per year.
Importance of error frequency
In quality control system design, it is important to know the frequency of critical error (f) associated with the method. This is defined as the frequency of runs in which the distribution of results has shifted such that 5% or greater have errors larger than TEa. Let's say our automated analyzer has f equal to 2% - not an unreasonable figure for a well-designed instrument. This means that in a year, eight of the four hundred runs will have at least five results with errors larger than TEa. But we have a quality control system in place, the purpose of which is to detect such problems. Unfortunately, practical considerations in QC system design often dictate that we can expect to catch only a fraction of the errors we would like to detect. However, even if the probability of error detection, Ped, is a modest 50% (at the critical error level) then four of the eight runs would be expected to fail QC and erroneous results would presumably not be reported. This leaves four runs and a total of 20 erroneous results that would be reported, which is 0.05% of the total number of results, or 5 defects per 10,000 test results, a defect rate of 1 in 2,000.
Defects vs. blunders
I digress here to acknowledge that the defect rate seen by the customer must also include "blunders", or what statisticians call outliers. These include results reported on the wrong specimen, or on specimens that were mishandled or improperly collected. Also included are transcription errors. One might expect that we have fewer such blunders in the laboratory than we had ten or twenty years ago because of automation, bar-coded identification labels and instrument interfaces. On the other hand, downsizing has resulted in more pressure on the remaining technologists, and this might be expected to increase the blunder rate, especially in non-automated sections of the laboratory.
Difficulties in estimating error frequencies
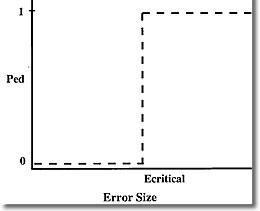
How realistic is the above estimate of defect rate? Well, it's only as good as the estimate of the critical error frequency of the method or instrument, so the question becomes, how can we know the actual value of f? This is a difficult problem, and probably represents the most serious obstacle to knowing how cost-effective our QC systems really are. It might be expected that critical error frequency is related to the frequency of runs rejected as being out of control. In fact these two quantities would be equal if we were using a QC system with an ideal power curve. Such a function would have a probability of false rejection (Pfr) equal to zero and a probability of error detection also equal to zero until error size reached the critical point. At this point Ped would go to 100%. Such a power curve is depicted below.
In the real world however, power curves look like the one below
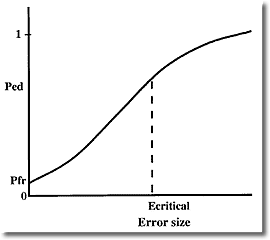
Inspection of these "real" power curves reveals a problem that I don't believe is widely appreciated. Most quality control systems will reject many runs where the error size is less than critical. Pfr gives the probability of rejecting a run with zero error, but what I call the true false rejection rate is much higher, because all runs rejected with error sizes less than critical should be considered false rejections from a medical usefulness viewpoint. Note that although Ped is lower for these smaller errors, this is offset by the fact that small errors occur more frequently than large ones.
Playing it safe with QC design
So the actual frequency of critical error of a method turns out to be extremely difficult to measure in the laboratory. This is unfortunate because important decisions in QC system design often depend on having a reasonable estimate of this quantity. When choosing QC rules, we tend to play it safe by opting for a fairly high Ped so that we will be covered if the method proves to be relatively unstable. The problem is that this is often accompanied by a high Pfr, and the true false rejection rate is even higher. Thus, high analytical quality can be (and often is) achieved at the expense of falsely rejecting a lot of runs, which wastes time and money in repeating work and searching for problems that aren't there. This illustrates the tradeoff mentioned earlier - high quality can always be achieved at the expense of the second quantity managers are interested in, productivity. In a laboratory setting productivity can be equated to test yield - the fraction of "good" results which are, in fact, reported. Even when we reject a run having 5% of results with errors greater than TEa, the other 95% we reject are "good" results. And when we falsely reject a run, we may needlessly repeat the test on every one of the samples.
I believe that in many laboratories poor productivity is a more serious problem than poor quality. This is because of the high incidence of true false rejections - rejection of runs with errors less than the critical level - which results in unnecessary repeating of tests and/or time wasted troubleshooting a non-existent problem.
What to do?
How can this dilemma be avoided? The solution is familiar to readers of Dr. Westgard's papers. First, methods with higher precision are needed.[2] Why? So that method shifts of one or two standard deviations will be medically insignificant. If the critical error size that needs detection (based on medical usefulness criteria) is at least 3s (3 times method standard deviation) then high Ped can be achieved with control rules like 13.5s or 14s where the true false rejection rate is low. It is important to note that in this situation more powerful multirules would not just be unnecessary, they would be inappropriate because their use would result in a higher probability of detecting medically insignificant errors while increasing probability of critical error detection only slightly.
Even more desirable (arguably) would be methods with very low frequency of error, say less than one percent. Regardless of the power of the QC system, if errors are very infrequent quality will be high. Then the QC system could be designed specifically to minimize true false rejections, and the Holy Grail of simultaneously achieving high quality and high productivity could be realized.
References
- Westgard JO, Bawa N, Ross JW, Lawson NS. Laboratory precision performance: State of the art versus operating specifications that assure the analytical quality required by proficiency testing criteria. Arch Pathol Lab Med 1996; 120; 621-625.
- Westgard JO, Burnett RW. Precision requirements for cost-effective operation of analytical processes. Clin Chem 1990;36:1629-32.
Biography: Robert W. Burnett, Ph.D.
Dr. Burnett received a Ph.D. in analytical chemistry in 1969 and joined the clinical chemistry laboratory at Hartford Hospital, Hartford, CT as Associate Director, a position he still holds. In 1985 he received a M.S. in computer science and also holds the position of Director of Information and Instrument Systems in the Department of Pathology and Laboratory Medicine. He is also Assistant Professor of Laboratory Medicine at the University of Connecticut and a Diplomate of the American Board of Clinical Chemistry.
Dr. Burnett has been actively involved for many years in writing consensus standards for laboratory medicine. He is a past chairman of the NCCLS Area Committee on Instrumentation, the NCCLS Subcommittee on Blood pH and Gases, and the IFCC Committee on Blood pH, Gases and Electrolytes. Currently he is a member of the IFCC Working Group on Selective Electrodes and a Consultant to the CAP Chemistry Resource Committee. His current interests are in laboratory information systems, instrument interfacing and quantitative tools for laboratory management, including quality control systems. He has written and lectured on quality control of blood gases and electrolytes and on cost-effective design of QC systems.