Quality Standards
Calculating TE and MU, why not do both two?
A recent study calculated both MAU (6 month uncertainty) and Total Error. Which model was more stringent on the methods? Which model was more forgiving? The answer may surprise you.
Calculating TE and MU: comparison of method judgments
March 2026
Sten Westgard, MS
A recent study tackled both the calculation of measurement uncertainty and total error and compared the utility of both approaches:
Debate on Measurement Uncertainty Versus Total Error: A Take by Tertiary Care Hospital Laboratory. Aastha Bansal, Rachna Agarwal. Indian Journal of Clinical Biochemistry. https://doi.org/10.1007/s12291-026-01391-y
While MU is mandated by ISO 15189:2022, TE and related calculations like analytical Sigma metrics are entirely optional. This laboratory decided to do both.
"It has been observed that various laboratories regard MU andd TE as identical concepts, employing them interchangeably to define target analytical variation. The debate between adopting MU or TE as the primary quality indicator reflects the broader challenge in harmonizing laboratory quality standards. Based on the given scenario, there has been considerable discussions in different countries about a practical approach to performance evaluation as to whether laboratories should eimate MU or calculate TE....If MU is estimated, whether there are any practical methodologies for performing that estimation."
The study was conducted at the routine biochemistry laboratory of the neurochemistry department of the Institute of Human Behaviour and Allied Sciences in Dehli, India. The name of the instrument was not provided, and it will become clear why that happened.
The imprecision and bias data
"IQC values were collected from September 2024 to February 2025." One lot of Bio-Rad controls was used throughout the period. Monthly values were calculated, but a cumulative 6 month value was also calculated. Two levels of performance were measured. The 6 month imprecision was used both for the analytical Sigma metrics as well as the measurement uncertainty. This estimate of mu could be compared to the minimum MAU listed in the EFLM biological variation database. Analytical sigma-metrics were calculated, using CLIA 2025 allowable total error goals. Both MU and the Sigma metric were based on the 6 month imprecision, not monthly estimates. Two levels of control were run, but the study did not present the specific levels where the test were being run. For goals that rely on a unit-based calculated of allowable total error, that key piece of information was missing. For the purposes of this analysis, similar TEa goals were obtained from another biochemistry study, providing a usable TEa goal for every level in the study.
Bias was determined from EQAS. the study captured both the lowest and highest bias, and also listed the median bias. For this analysis, the median bias was used.
Analytical sigma metrics were calculated using the standard Westgard equation: (TEa - |bias|) / CV
| Analyte | Sigma-metric |
| Albumin | 1.2 |
| Albumin | 1.0 |
| Alk Phos | 1.9 |
| Alk Phos | 1.7 |
| ALT* | 2.1 |
| ALT | 1.7 |
| AST* | 2.1 |
| AST | 1.7 |
| Bilirubin, Total* | 11.8 |
| Bilirubin, Total | 3.6 |
| Calcium* | 4.6 |
| Calcium* | 2.3 |
| Chloride | 0.5 |
| Chloride | 0.6 |
| Cholesterol | 1.8 |
| Cholesterol | 2.2 |
| Creatinine* | 4.9 |
| Creatinine* | 2.4 |
| Glucose* | 1.2 |
| Glucose | 0.6 |
| HDL* | 4.5 |
| HDL | 2.5 |
| Magnesium | 2.2 |
| Magnesium | 3.2 |
| Phosphorous | 2.3 |
| Phosphorous | 2.0 |
| Potassium* | 4.4 |
| Potassium* | 1.7 |
| Protein, Total | 2.0 |
| Protein, Total | 1.9 |
| Sodium* | 1.0 |
| Sodium* | 0.4 |
| Triglycerides | 2.2 |
| Triglycerides | 2.7 |
| Urea Nitrogen* | 2.8 |
| Urea Nitrogen* | 1.9 |
| Uric Acid | 2.0 |
| Uric Acid | 2.5 |
The analytical Sigma performance is summarized visually in the following Normalized Method Decision Chart (NMEDx):
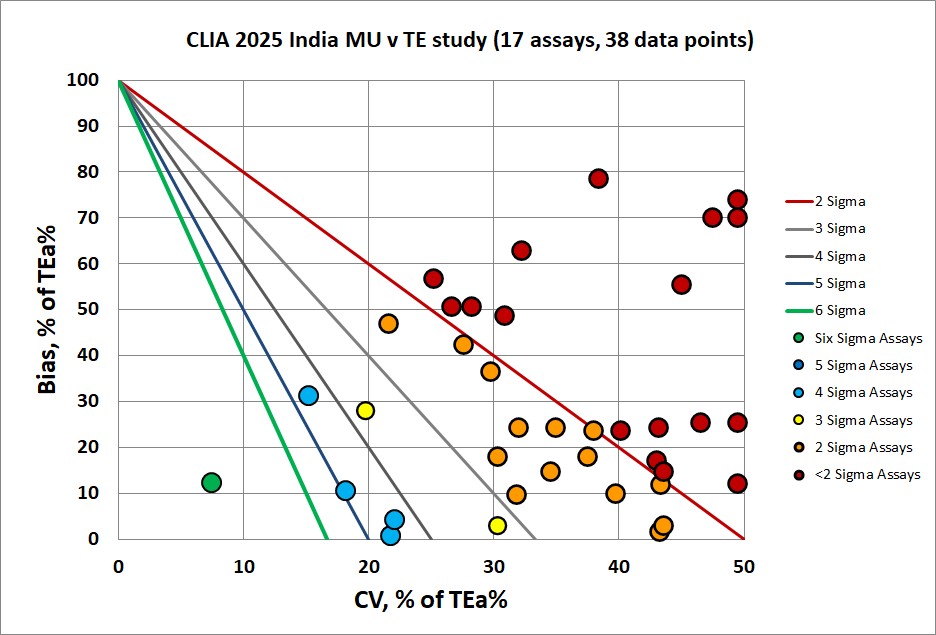
Performance is not that impressive for this instrument. Remember, orange and red mean 2 and less than 2 Sigma. That would be judged as failing to meet the quality goals.
While the analytical Sigma metric is a harsh judge of this instrument, the minimum MAU standard is more forgiving:
| Analyte | MU 6 month | EFLM min MAU | MAU pass? | Sigma pass? |
| Albumin | 9.8 | 3 | fail | fail |
| Albumin | 11.57 | 3 | fail | fail |
| Alk Phos | 10.65 | 9.9 | fail | fail |
| Alk Phos | 11.3 | 9.9 | fail | fail |
| ALT* | 11.9 | 18.9 | pass | fail |
| ALT | 9.26 | 18.9 | pass | fail |
| AST* | 11.03 | 12.9 | pass | fail |
| AST | 7.65 | 12.9 | pass | fail |
| Bilirubin, Total* | 6.67 | 30.3 | pass | pass |
| Bilirubin, Total | 7.89 | 30.3 | pass | pass |
| Calcium* | 6.51 | 2.7 | fail | pass |
| Calcium* | 6.91 | 2.7 | fail | fail |
| Chloride | 6.14 | 1.5 | fail | fail |
| Chloride | 5.33 | 1.5 | fail | fail |
| Cholesterol | 8.64 | 8.1 | fail | fail |
| Cholesterol | 6.98 | 8.1 | pass | fail |
| Creatinine* | 8.31 | 6.6 | fail | pass |
| Creatinine* | 6.4 | 6.6 | pass | fail |
| Glucose* | 6.44 | 7.5 | pass | fail |
| Glucose | 6.13 | 7.5 | pass | fail |
| HDL* | 9.09 | 8.6 | fail | pass |
| HDL | 8.64 | 8.6 | fail | fail |
| Magnesium | 13.05 | 4.1 | fail | fail |
| Magnesium | 9.1 | 4.1 | fail | pass |
| Phosphorous | 9.53 | 11.6 | pass | fail |
| Phosphorous | 8.66 | 11.6 | pass | fail |
| Potassium* | 6.16 | 5.9 | fail | pass |
| Potassium* | 5.23 | 5.9 | pass | fail |
| Protein, Total | 6.08 | 3.9 | fail | fail |
| Protein, Total | 6.42 | 3.9 | fail | fail |
| Sodium* | 3.6 | 0.9 | fail | fail |
| Sodium* | 3.8 | 0.9 | fail | fail |
| Triglycerides | 11.25 | 29.7 | pass | fail |
| Triglycerides | 9.08 | 29.7 | pass | fail |
| Urea Nitrogen* | 10.17 | 19.7 | pass | fail |
| Urea Nitrogen* | 7.75 | 19.7 | pass | fail |
| Uric Acid | 8.72 | 12.5 | pass | fail |
| Uric Acid | 6.89 | 12.5 | pass | fail |
Of the 19 assays and 38 evaluations possible, assessments of Sigma metrics and MU disagreed more than half the time (21 analytes had different verdicts from TE and MU). Minimum MAU was more forgiving, judging half of this performance acceptable, while analytical Sigma metrics found that less than a quarter of the performance was acceptable (7 of 38). If you're looking for the most discerning eye, the choice is analytical Sigma metrics.
It's not completely surprising to see these differences, since MAU is based on EFLM biological variation goals, and the analytical Sigma metrics here were calculated from CLIA 2025 goals. Biological goals can be extremely tight for electrolytes and at the same time, extremely permissive for analytes like triglycerides. Analytical sigma metrics are also more challenging because bias is incorporated into the calculation, instead of ignored. The typical laboratory that calculates MU does not include bias in the calculation. Thus, a critical component of performance is ignored.
Conclusion
The authors end their study with a conciliatory note:
"Our study suggests that MU and TE should be viewed as complementary components of a comprehensive laboratory quality assurance framework. MU, as mandated by ISO 15189, focuse on quantifying analytical imprecision and characterizing the reliability and traceability of measurement results, thereby strengthening confidence in the analytical process. In contrast, TE integrates both bias and imprecision, translating analytical performance into clinically meaningful limits aligned with medical decision-making. These approaches should be viewed as two sides of the same coin.... Adopting an integrated MU-TE strategy may enable laboratories to design balanced, rational, risk-based quality control protocols that are both regulatory compliant and clinically effective."
It's interesting to see a study encourage uses of both approaches, particularly with the MU monologues are calling not for tolerance, but for extinction of the TE approach. Clearly, MU by itself misses out on important aspects of analytical performance. MU alone might give laboratories a false sense of security if bias is ignored. In contrast, TE does not seek to abolish MU. The TE approach is not mandated, is not exclusionary, it's simply an attempt to provide practical help to the laboratory.
More practically, the instrument assessed in this study would not be considered acceptable in the developed parts of the world like Europe and the USA. With MU, the only alternative is to seek better imprecision and demand more from the manufacturer. With TE, the use of the Westgard Sigma Rules will allow laboratories to identify how much QC is needed for this instrument (short answer: a LOT). Improving bias can raise the Sigma metrics. Improving imprecision will impact both MU and TE benchmarking.