Sigma Metric Analysis
POC Chemistry Instrument
When a new POC instrument reports it has great precision, is that all you need to know about performance?
- The Precision and Comparison data
- Calculate bias at the critical decision level
- Determine quality requirements at the critical decision level
- Calculate Sigma metrics
- Summary of Performance by Normalized OPSpecs Chart
- Conclusions
May 2008
 |
[Note: This QC application is an extension of the lesson From Method Validation to Six Sigma: Translating Method Performance Claims into Sigma Metrics. This article assumes that you have read that lesson first, and that you are also familiar with the concepts of QC Design, Method Validation, and Six Sigma. If you aren't, follow the link provided.] |  |
This application comes from a 2008 paper from the journal Clinical Chemistry and Laboratory Medicine for a multitest point of care instrument. This instrument was promoted as a fast diagnostic tool for blood gases, electrolytes, and metabolites. We're going to take a look at this method validation study and calculate Sigma-metrics for some of the analytes.
The Precision and Comparison data
According to the paper, the laboratory conducted both within-day and between-day precision studies. The between-day study interests us the most, since the longer time frame (measuring controls once/day for 20 days) provides us with the most realistic estimate of method imprecision.
A comparison study was performed using 74 randomly-selected arterial whole blood samples. For most of the analytes, the new method was compared against an earlier generation POC analyzer. For two analytes, however, Chloride and BUN, the Dimension RxL system was used as the comparative method. Deming regression was used to determine the regression equation (so we actually won't have to concern ourselves with the correlation coefficient at all).
Now all we need to do is select which estimates to use, supply the quality requirements and calculate the Sigma metrics.
Imprecision Estimates:
| Assay |
Level
|
Converted
level |
CV% |
| pCO2, mm HG |
54.2
|
conversion not needed |
1.9%
|
|
40.5
|
1.8%
|
||
|
24.1
|
2.7%
|
||
| Sodium, mmol/L |
116.5
|
conversion not needed |
0.3%
|
|
143.6
|
0.2%
|
||
| Potassium, mmol/L |
6.47
|
conversion not needed |
1.3%
|
|
4.04
|
1.7%
|
||
| Chloride, mmol/L |
98.2
|
conversion not needed |
0.4%
|
|
127
|
0.3%
|
||
| Glucose, mmol/L |
15.4
|
277.48 mg/dL |
1.7%
|
|
4.6
|
82.88 mg/dL |
0.8%
|
|
| BUN, mmol/L |
2.1
|
5.88 mg/dL |
1.9%
|
|
0.7
|
1.96 mg/dL |
4.3%
|
|
| iCa, mmol/L |
1.63
|
6.52 mg/dL |
1.4%
|
|
1.12
|
1.96 mg/dL |
1.5%
|
|
| iMg, mmol/L |
1.12
|
conversion not needed |
2.6%
|
|
0.62
|
1.6%
|
Note that some of the imprecision units are in SI units, not the "conventional" units to which we in the US are accustomed. Thus, as noted, we need to convert the units and levels into conventional units. While this doesn't change the CV, since CV is "unit-less," the units are extremely important for determining performance at the critical decision level.
Comparison of Methods Data (n=74, vs. STP Ultra C or Dimension RxL):
| Assay |
Slope
|
Y-Int
|
r
|
| pCO2, mm HG |
0.976
|
-3.662 mm Hg
|
0.987
|
| Sodium, mmol/L |
0.852
|
+19.99 mmol
|
0.933
|
| Potassium, mmol/L |
1.11
|
-0.434 mmol
|
0.981
|
| Chloride, mmol/L |
0.985
|
+5.422 mmol
|
0.937
|
| Glucose, mmol/L |
0.972
|
-0.076 mmol
|
0.974
|
| BUN, mmol/L |
1.026
|
+0.576 mmol
|
0.996
|
| iCa, mmol/L |
0.745
|
+0.325 mmol
|
0.960
|
| iMg, mmol/L |
0.786
|
+0.136 mmol
|
0.945
|
At this point, remember the following: the correlation coefficient is not the key statistic here. Correlation coefficient merely gives us a indication of whether or not a linear regression technique is sufficient. You can see the need for Deming regression given that r is less than 0.97 for sodium, chloride, iCa, and IMg.
Calculate bias at the critical decision level
Now we take the comparison of methods data and determine bias at the levels of critical decision interest, using Statland's guidelines. Solving those equations will give us bias estimates.
Using sodium as an example, let's see how to calculate bias:
For sodium, one of the critical medical decision levels is 115 mmol/dL. So we will calculate the bias at this level.
((slope*level) + YIntercept) - level) / level = % bias
((0.852 * 115) + 19.99) - 115) / 115 = ((97.98 + 19.99) - 115 ) / 115
(117.97 - 115) / 115 = 2.97 / 115 = 0.0258 * 100 = 2.58% bias
For analytes where we convert the units, we have to use the original numbers and units because the regression equation is in units (the y-intercept, specifically). So we will use the regression equation to estimate the % bias in the original units, then use that unit-less number going forward.
Using glucose as an example, let's walk through this way of calculating:
For glucose, one of the critical medical decision levels is 120 mg/dL, which corresponds to a 6.66 mmol/L. So we will calculate the bias at this level.
((slope*level) + YIntercept) - level) / level = % bias
((0.972 * 6.66) - 0.076) - 6.66) / 6.66 = ((6.472 - 0.076) - 6.66 ) / 6.66
(6.397 - 6.66) / 6.66 = -0.262 / 6.66 = 0.0394 * 100 = 3.94%
[Note that bias is absolute, so the negative sign is dropped.]
One last wrinkle: for pCO2, we're not going to pick a single critical decision level. Instead, we're going to calculate Sigma at every level available to us. The paper gives three CV estimates from three levels, so we'll calculate bias at three levels, too.
Finally, here are the bias numbers, calculated at chosen critical decision levels:
| Assay | Critical decision level |
Slope
|
Y-Int
|
% bias
|
| pCO2, mm HG |
54.2 mm HG
|
0.976
|
-3.662
|
9.16%
|
|
40.5 mm HG
|
11.44%
|
|||
|
24.1 mm HG
|
17.60%
|
|||
| Sodium, mmol/L |
115 mmol/L
|
0.852
|
+19.99
|
2.58%
|
| Potassium, mmol/L |
5.8 mmol/L
|
1.11
|
-0.434
|
3.52%
|
| Chloride, mmol/L |
90 mmol/L
|
0.985
|
+5.422
|
4.52%
|
| Glucose, mmol/L converted to mg/dL |
120 mg/dL
6.66 mmol/L |
0.972
|
-0.076
|
3.94%
|
| BUN, mmol/L converted to mg/dL |
6 mg/dL
2.14 mmol/L |
1.026
|
+0.576
|
29.49%
|
| iCa, mmol/L, converted to mg/dL |
7 mg/dL
1.75 mmol/L |
0.745
|
+0.325
|
6.93%
|
| iMg, mmol/L |
1 mmol/L
|
0.786
|
+0.136
|
7.38%
|
Determine the quality requirements at the critical decision level
Now that we have both bias and CV estimates, we are almost ready to calculate the Sigma metrics for these analytes. The last thing we need is the quality requirement for each method. CLIA provides most of the quality requirements we need, but in several cases, we need to transform those requirements into useful percentages.
| Assay | CLIA PT criterion | notes |
Final Quality Requirement
|
| pCO2, mm HG |
Target value ± 5 mm Hg or ± 8% (greater)
|
At 54.2 mm Hg, (5/54.2) = 9.22 |
9.22%
|
| At 40.5 mm Hg, (5/40.5) = 12.3 |
12.3%
|
||
| At 24.1 mm Hg, (5/24.1) = 20.7% |
20.7%
|
||
| Sodium, mmol/L |
Target value ± 4 mmol/L
|
At 115 mmol/L, (4/115) = 3.47 |
3.47%
|
| Potassium, mmol/L |
Target value ± 0.5 mmol/L
|
At 5.8 mmol/L, (0.5/5.8) = 8.62% |
8.62%
|
| Chloride, mmol/L |
Target value ± 5%
|
5.0%
|
|
| Glucose, mg/dL |
Target value ± 6 mg/dL or ± 10% (greater)
|
At 120 mg/dL, (6/120) = 5.0% |
10.0%
|
| BUN, mg/dL |
Target value ± 2 mg/dL or ± 9% (greater)
|
At 6 mg/dL, (2/6) = 33.3% |
33.3%
|
| iCa, mmol/L |
Target value ± 1.0 mg/dL
|
At 7 mg/dL, (1/7) = 14.3 |
14.3%
|
| iMg, mmol/L |
Target value ± 25%
|
25.0%
|
Note that some of these requirements are extremely tight. Sodium and Potassium have a fixed target values, regardless of the level of the test, which creates very small windows of opportunity. Chloride's requirement is also quite small.
Calculate Sigma metrics
Now we have all the pieces in place.
Remember the equation for Sigma metric is (TEa - bias) / CV:
For Glucose, (10.0 - 1.1) / 1.3 = 6.85
| Assay |
CV%
|
Bias%
|
TEa%
|
Sigma metric |
| pCO2, mm HG |
1.9%
|
9.16%
|
9.22%
|
0.03
|
|
1.8%
|
11.44%
|
12.3%
|
0.48
|
|
|
2.7%
|
17.60%
|
20.7%
|
1.15
|
|
| Sodium, mmol/L |
0.3%
|
2.58%
|
3.4%
|
2.72
|
| Potassium, mmol/L |
1.3%
|
3.52%
|
8.62%
|
3.93
|
| Chloride, mmol/L |
0.4%
|
4.52%
|
5.0%
|
1.19
|
| Glucose, mg/dL |
0.8%
|
3.94%
|
10.0%
|
7.57
|
| BUN, mg/dL |
1.9%
|
29.49%
|
33.3%
|
2.00
|
| iCa, mmol/L |
1.4%
|
6.93%
|
14.3%
|
5.27
|
| iMg, mmol/L |
2.6%
|
7.8%
|
25%
|
6.62
|
A mixed bag of results here. A few methods, glucose and magnesium have world class performance. Others, however are below what usual business and industry considers acceptable performance. Anything under 3 Sigma, in an industry other than healthcare, would be considered unacceptable.
Take another look at these metrics if we could eliminate bias:
| Assay |
CV%
|
TEa%
|
Sigma metric without bias |
| pCO2, mm HG |
1.9%
|
9.22%
|
4.85
|
|
1.8%
|
12.3%
|
6.83
|
|
|
2.7%
|
20.7%
|
7.67
|
|
| Sodium, mmol/L |
0.3%
|
3.4%
|
11.33
|
| Potassium, mmol/L |
1.3%
|
8.62%
|
6.63
|
| Chloride, mmol/L |
0.4%
|
5.0%
|
12.50
|
| Glucose, mg/dL |
0.8%
|
10.0%
|
12.50
|
| BUN, mg/dL |
1.9%
|
33.3%
|
17.53
|
| iCa, mmol/L |
1.4%
|
14.3%
|
10.21
|
| iMg, mmol/L |
2.6%
|
25%
|
9.62
|
Imagine, if bias could be eliminated, nearly every test on this instrument could achieve world class performance. In some cases, the method bias in the previous table is eating up 99% of the error budget!
Summary of Performance by Normalized OPSpecs chart
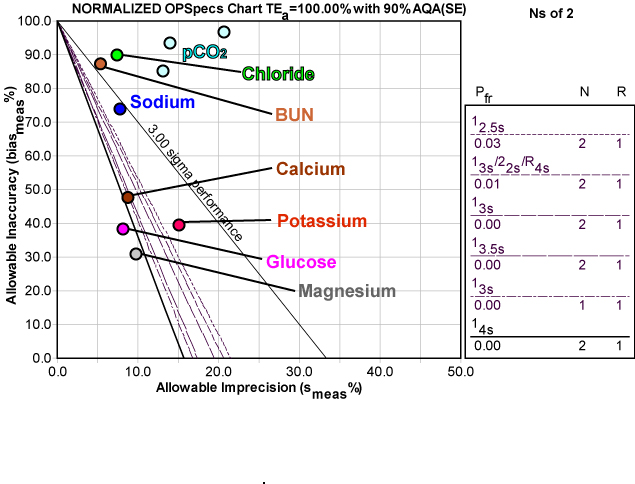
Here's a graphic depiction of these analytes, normalized so they can be presented together on a Normalized OPSpecs chart:
As you can see, most of the operating points are in "deep water." The extent of the bias problem is visually striking - if bias could be reduced significantly, the precision performance is actually pretty good, and "dry land" would be easy to reach.
In contrast, recall an earlier QC application on an automated central laboratory instrument, where many of the same analytes did in fact achieve world class performance, even with bias taken into account.
The difference between POC and the central lab are stark. Take a look a performance of central lab analyzers here and here, while contrasting them with a POC device here.
Conclusions
As we find with many POC devices, the methods deliver good precision but suffer from significant bias problems.
If the biases represent differences that will be seen between the POC measurements and other routine measurements from a central laboratory, then bias is a real problem in following patient results. However, if the POC measurements are not intermixed with other routine measurements, then changes in patient conditions will not be affected by the bias, i.e., the bias is consistent from measurement to measurement so changes or trends can still be observed.

