QC Design
Cholesterol, Clinical Quality Requirement
This cholesterol example illustrates the use of a clinical quality requirement based on the National Cholesterol Education Program's guidelines for use and interpretation of a screening cholesterol test. OPSpecs charts designed for clinical quality requirements are used to plan QC for cholesterol based on these guidelines.
Note: at this time this was written, QC Validator was the QC Design software available. Validator has been replaced by EZ Rules 3, which has all the features and capabilities of the earlier version, as well as new enhancements.
This cholesterol example illustrates the use of a clinical quality requirement based on the National Cholesterol Education Program's guidelines for use and interpretation of a screening cholesterol test. This example complements our earlier cholesterol example that used the US CLIA analytical quality requirement for acceptability of proficiency testing results. OPSpecs charts are used for selecting QC procedures in both examples, but the analytical OPSpecs charts can be obtained from the OPSpecs Manual, whereas the clinical OPSpecs charts must be generated by a computer program, such as QC Validator, to account for preanalytical factors, particularly the expected within-subject biological variation. We follow a similar 8-step planning process here, but note that steps 4-6 could be combined by the automatic QC selection feature of QC Validator 2.0.
- 1. Define the Quality Requirement
- 2. Evaluate the analytical and preanalytical factors
- 3. Enter parameters in computer program
- 4. Obtain clinical OPSpecs chart
- 5. Assess probabilities of rejection
- 6. Select the control rules and numbers of control measurements, N
- 7. Adopt a Total QC Strategy
- 8. Reassess for changes in performance
- For further reading
We'll again follow the steps of the QC planning process.
1. Define the quality requirement.
The National Cholesterol Education Program (NCEP) [1] recommends that a cholesterol value of 200 mg/dL (5.17 mmol/L) or less is desirable and that a value of 240 mg/dl (6.21 mmol/L) or above requires clinical followup, usually by additional lipid tests such as estimation of LDL cholesterol, which depends on determining total cholesterol, HDL cholesterol, and triglyceride in a 12 hour fasting specimen. A difference or change from 200 to 240 would be clinically important because it would change the interpretation of the test and the treatment of the patient. This corresponds to a decision interval (Dint) of 20% at a decision level of 200 mg/dL.
2. Evaluate analytical and preanalytical factors.
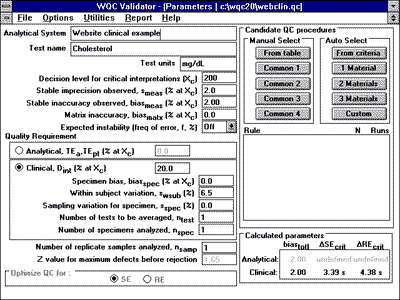
The initial replication study gave a standard deviation of 4.0 mg/dL for a control material whose mean value was 200 mg/dL, which is a CV of 2.0%. From a comparison of methods study, the bias is estimated as 4 mg/dL at a decision level of 200 mg/dL, which is also 2.0%. An important preanalytical factor is within-subject biological variation, which was estimated as 6.5% in a study by Costongs et al [2].
3. Enter parameters in computer program.For the QC Validator program, the input parameters would be entered as shown. |
|
4. Obtain clinical OPSpecs charts
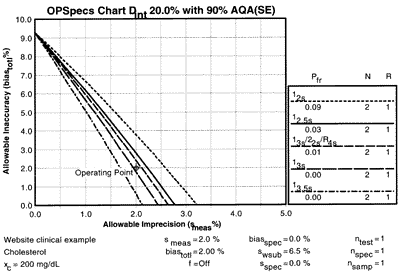
 The OPSpecs chart for a clinical decision interval requirement of 20% and 90% AQA(SE) shows that there are three lines above the operating point.
5. Assess the probabilities for rejection.
These three lines correspond to the 12s control rule with N=2, 12.5s with N=2, and 13s/22s/R4s with N=2, all of which will provide 90% detection of medically important systematic errors. The expected false rejection rates would be 9%, 3%, and 1%, resp., as shown by the Pfr figures in the key area of the chart.
6. Select control rules and N
The high false rejection should eliminate the 12s control procedure from further consideration because there is no need to tolerate 9% waste when there are two other possibilities that have only 1-3% waste. Of the remaining two QC procedures, practical considerations are important in selecting which one to use. For simplicity, the 12.5s single rule procedure may be preferred. For cost-effectiveness, the multirule procedure may be preferred. Either would provide appropriate control for the clinical quality needed for the cholesterol test.
8. Reassess for changes
This QC planning process can be repeated whenever there are changes in performance of the method. If performance were to improved due to reduction of method bias, then a 13s or even 13.5s procedure could be used to reduce false rejections even further.
Comparison of QC for analytical and clinical quality requirements
From our earlier cholesterol application for a CLIA analytical quality requirement of 10%, recall that the QC procedure needed 4 control measurements per run when the method had a 2% CV and a 2% bias. It is interesting that only 2 control measurements per run are needed to assure this same method will satisfy the NCEP clinical quality requirement. This comparison shows that the CLIA analytical requirement is actually more demanding than the NCEP clinical requirement. It makes no sense, but it is understandable because these governmental recommendations come from two different groups that have different purposes and don't recognize the need for a consistent set of clinical and analytical quality requirements.
What to do? The laboratory needs to establish a testing process that satisfies the most demanding requirement. In this case, that means using the higher N QC procedure that is necessary to assure the quality required by CLIA PT.
References
- National Cholesterol Education Program Laboratory Standardization Panel. Current status of blood cholesterol measurement in clinical laboratories in the United States. Clin Chem 1988;34:193-201.
- Costongs GMPJ, Janson PCW, Bas BM, et al. Short-term and long-term intra- individual variations and critical differences of clinical chemical laboratory parameters. J Clin Chem Clin Biochem 1985;23:7-16.


