Basic QC Practices
The 2021 USA QC Survey Results
Has QC in the USA gotten better or worse? Are trends in consolidation, automation, POC-ization, and the waiving-waiving-waiving of methods had an impact on how quality control is practiced in US laboratories? The results are in.
The 2021 USA QC Survey Results: Is Quality going Up or Down? "In" or "Out"?
Sten Westgard, MS
November 2021
[This survey was completed with the support and partnership of Technopath Clinical Diagnostics.]
- The Top Ten Findings of the 2021 Global QC Survey
- The 2021 Global QC Survey
- The 2021 US QC Survey Results
- The 2021 Asia QC Survey Results
- The 2021 Middle-East QC Survey Results
- The 2021 Latin and South America QC Survey Results
- The 2021 European QC Survey Results
It's 2021 in America, is it the dawn of better practices? Or the twilight of quality control?
We surveyed US laboratories in 2017 about their quality control practices. We did it again in 2021.
Let's set the board.
The demographics of the participants
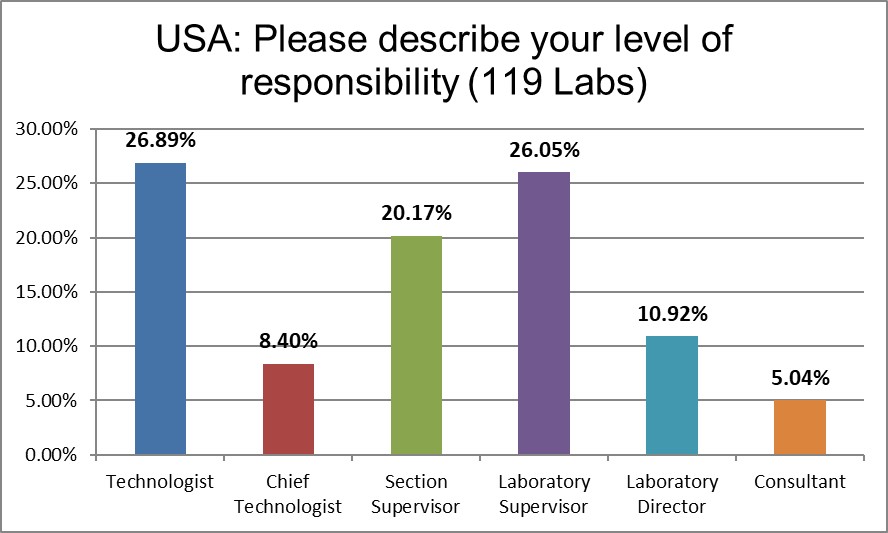
The majority of respondents are in direct contact with the bench, who directly implement the policies, not just direct others to do so.
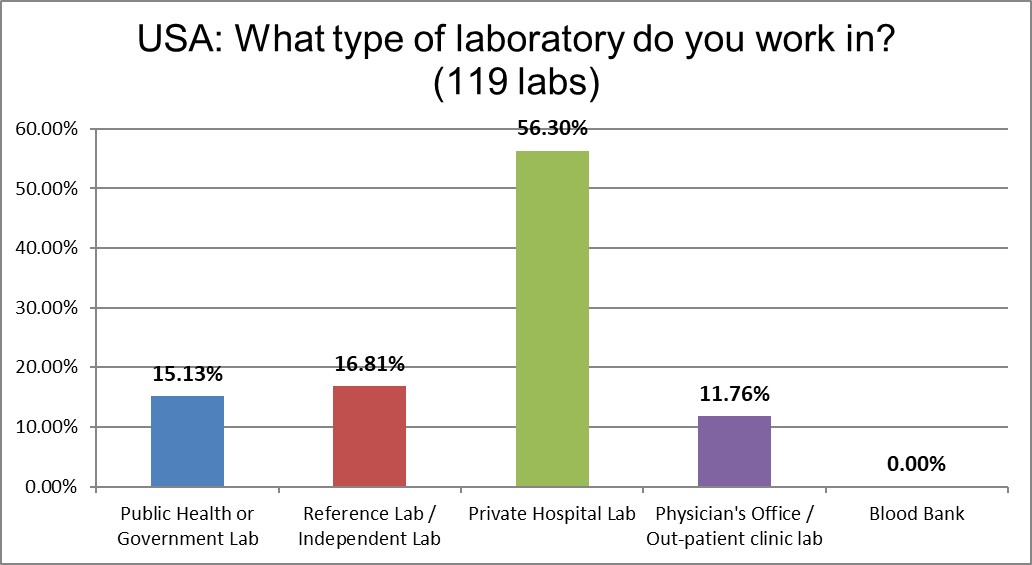
Not surprising that the majority of labs that responded are private hospitals, that's how the healthcare system is set up here.
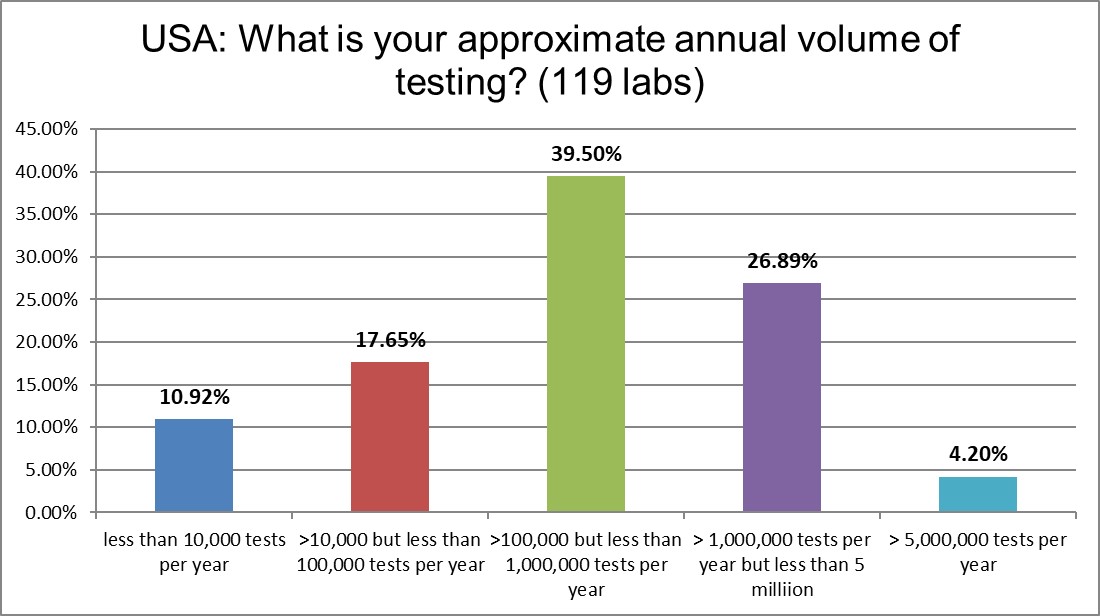
The skew of this bell curve is toward the bigger but not the mega testing volumes. We run a lot of tests in the US, don't we?
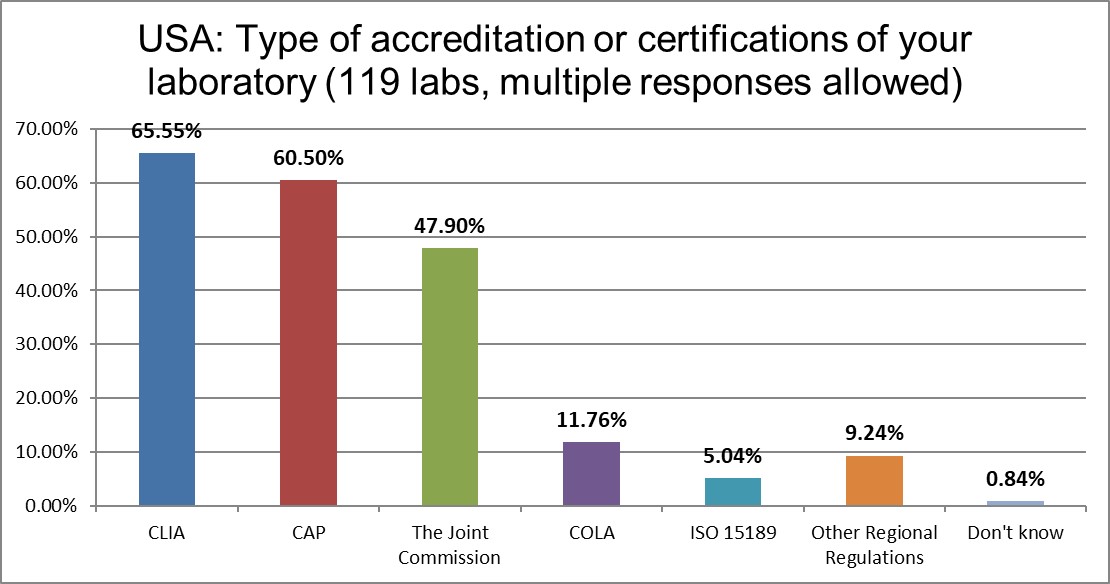
The ISO 15189 standard is basically unimplemented here in the US, with CLIA regulations the law of the land. CAP labs still dominate over TJC and COLA accreditation.
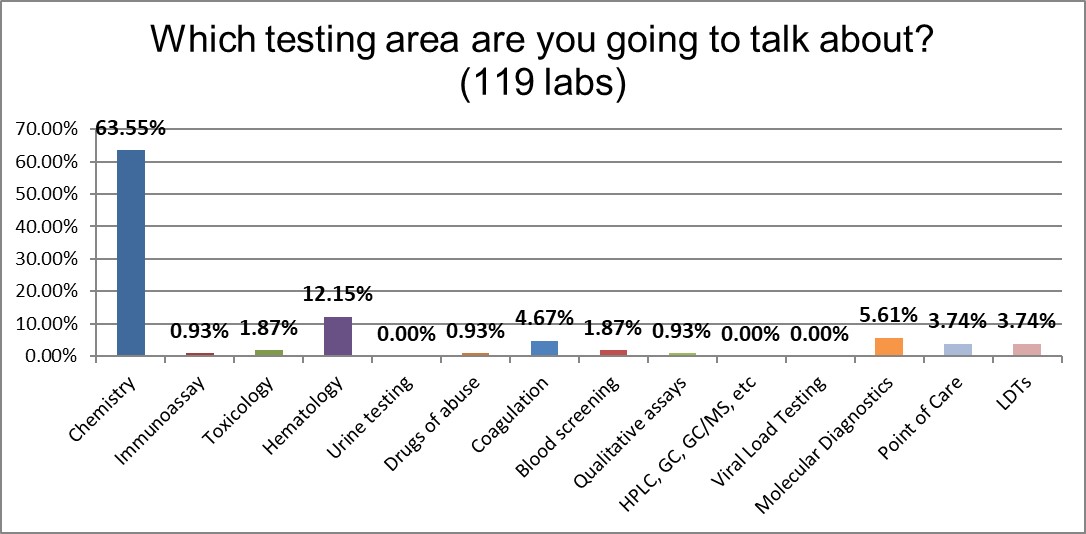
Participants almost 2 to 1 were focusing on chemistry rather than any other testing area.
The QC Set Up
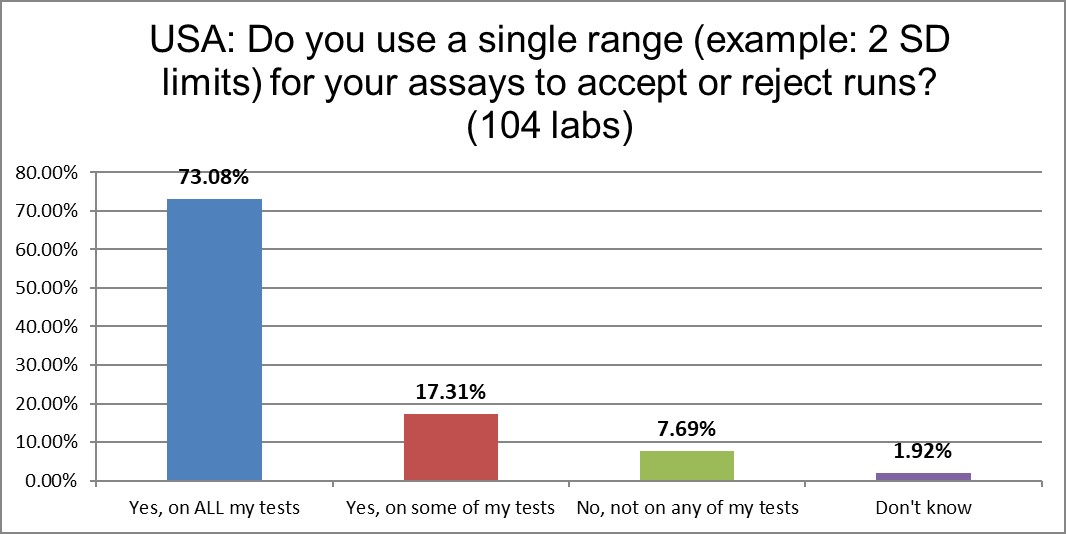
90% of labs are still using 2 standard deviations as one of their primary QC techniques. Only a very few labs have abolished the practice. This, despite the well-known false rejection rate caused by these too-tight limits. In fact, in the last survey, the percentage was only 55%. More labs are falling backward in their practices
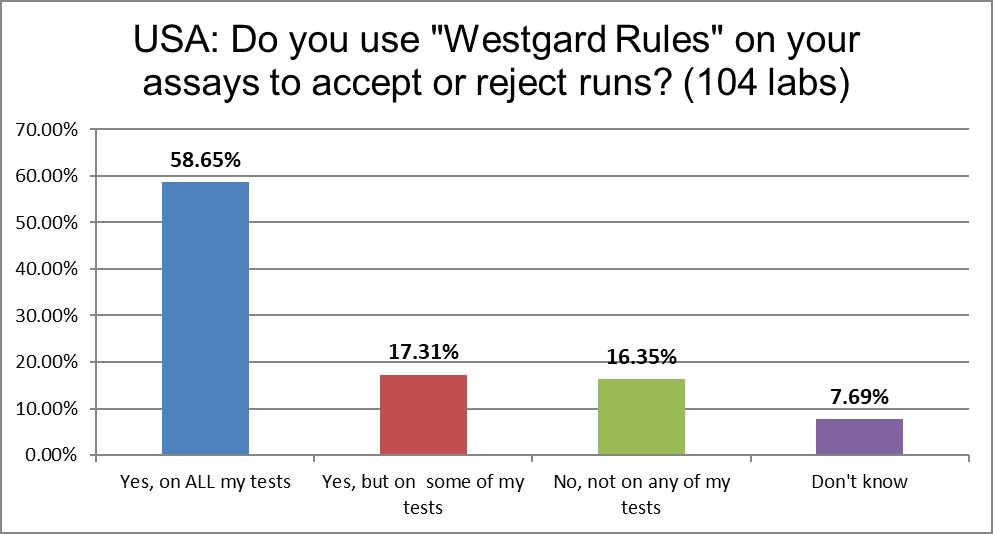
"Westgard Rules" are still in use, to some extent, in over 90% of labs. However, a growing number of labs are no longer using them. We've seen a drop of about 14%.
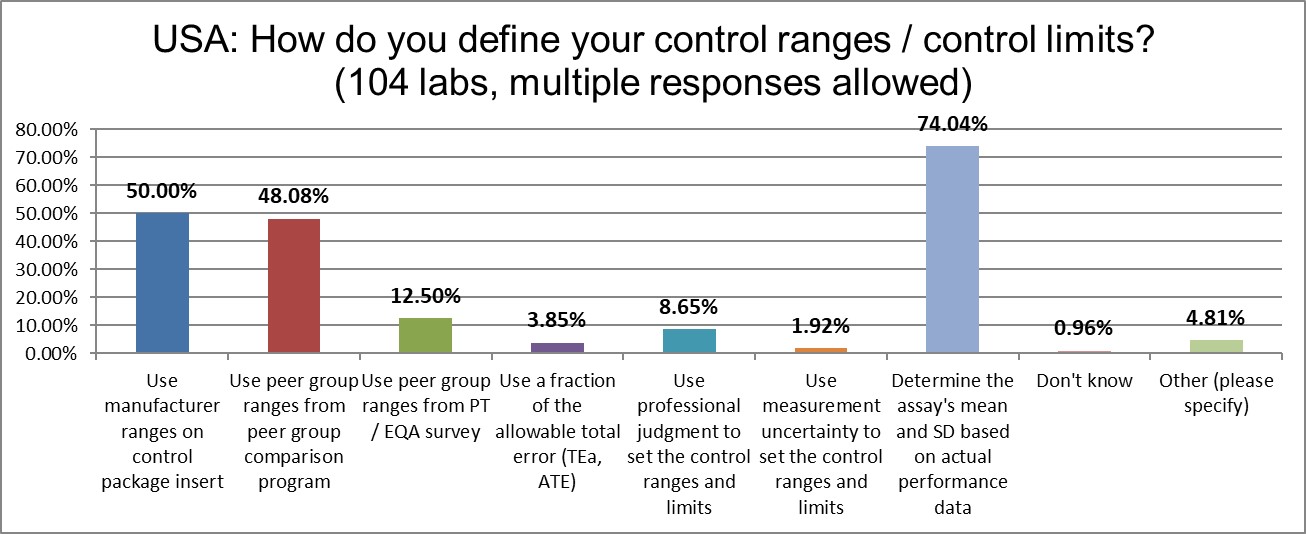
Nearly three-quarters of labs in the USA calculate the actual mean and the actual SD to create their Levey-Jennings control charts. The number of labs using manufacturer ranges has risen by 18% since 2017, the use of peer group ranges has risen by 16% since 2017.
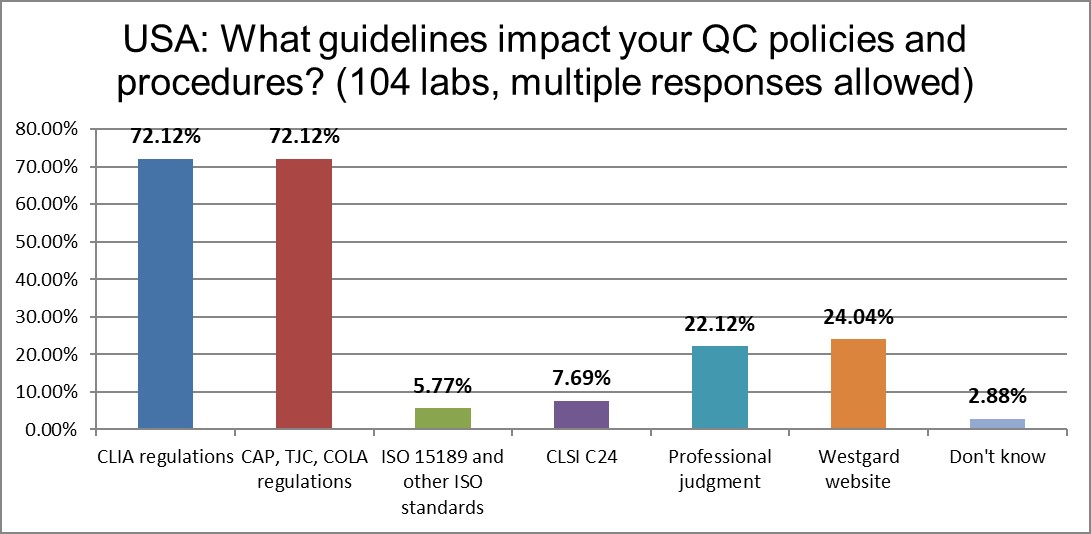
The guidelines that mainly impact the laboratory are CLIA and accreditation requirements from CAP, TJC, and COLA. The advice of CLSI C24 has declined in half since 2017.
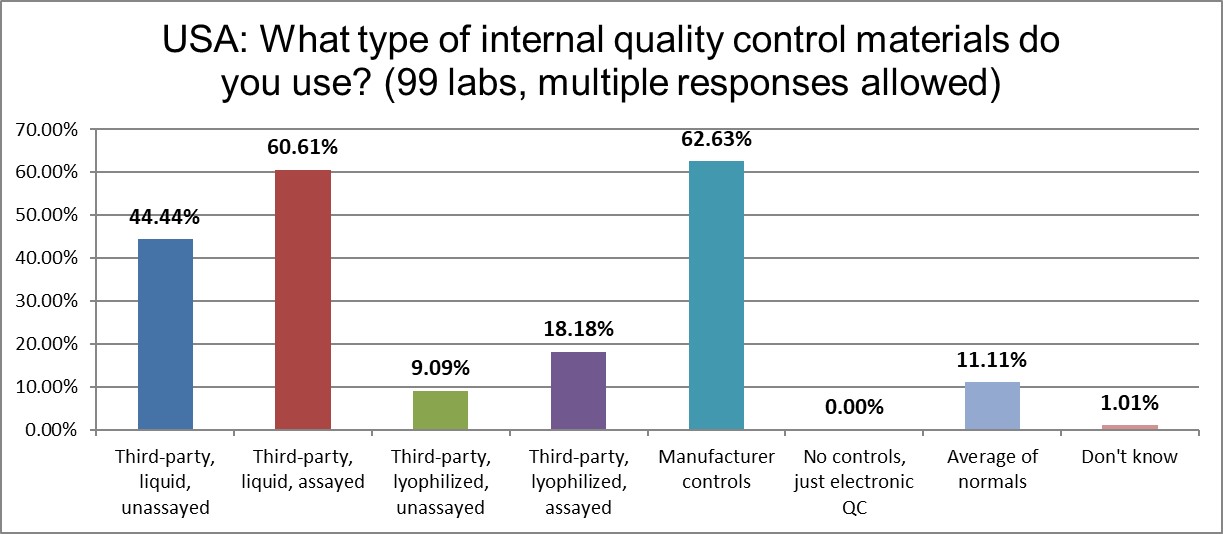
The use of the following types of controls have decreased in the last four years: 3rd party unassayed liquid and both types of lyophilized controls. The use of 3rd party assayed liquid controls and manufacturer controls have increased just slightly. The implementation of average of normals (or PBRTQC techniques) has also ticked up just a nudge, to 11%.
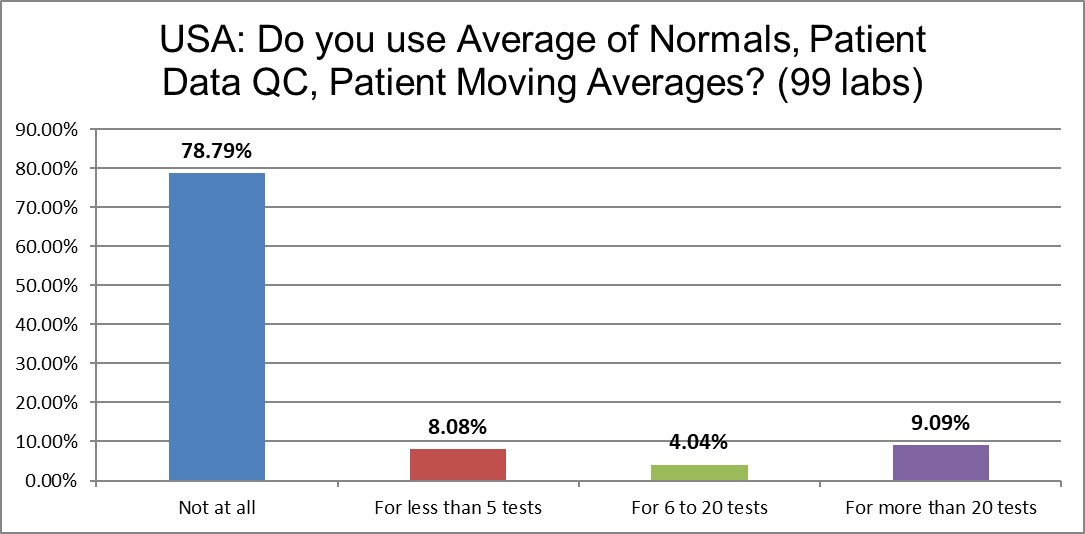
While PBRTQC is popular in the literature, nearly 80% of labs aren't doing it at all. About 1 in 10 are doing it seriously, on more than 20 tests in their lab. Another 12% of the labs are doing it for a handful or a dozen tests.
The Real Practice of Running Controls
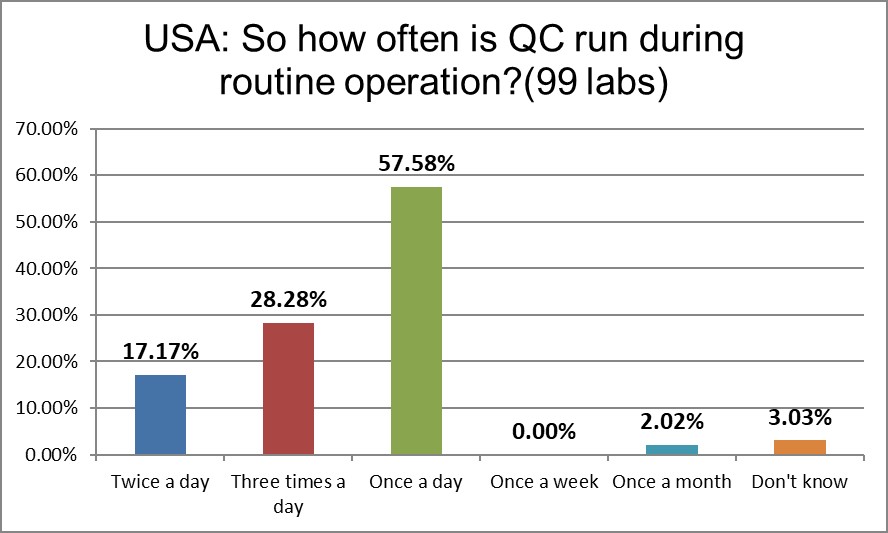
A shift in the QC frequency is occurring in the US. While the percentage of once/day has essentially not changed, the percentage reporting twice a day QC has doubled, and there's a 50% increase in the three a day QC runs. The USA runs controls more frequently once a day and more frequently three times a day than the global average.
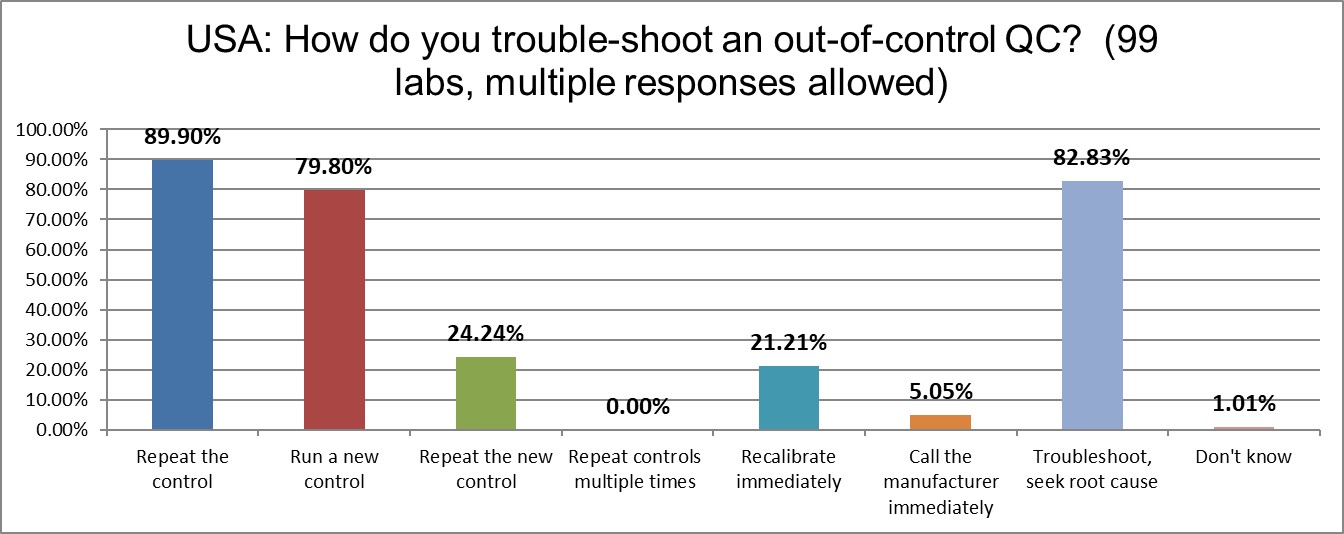
Nearly 90% of US labs simply repeat the control when it's out. Nearly 80% will run a new control after the repeat. Nearly a quarter will repeat the new control after that. This is a very significant increase since the last survey. It appears labs in the US are the most likely to repeat the control in the entire world. As we have said in the past, this is a lot more like gambling than quality.
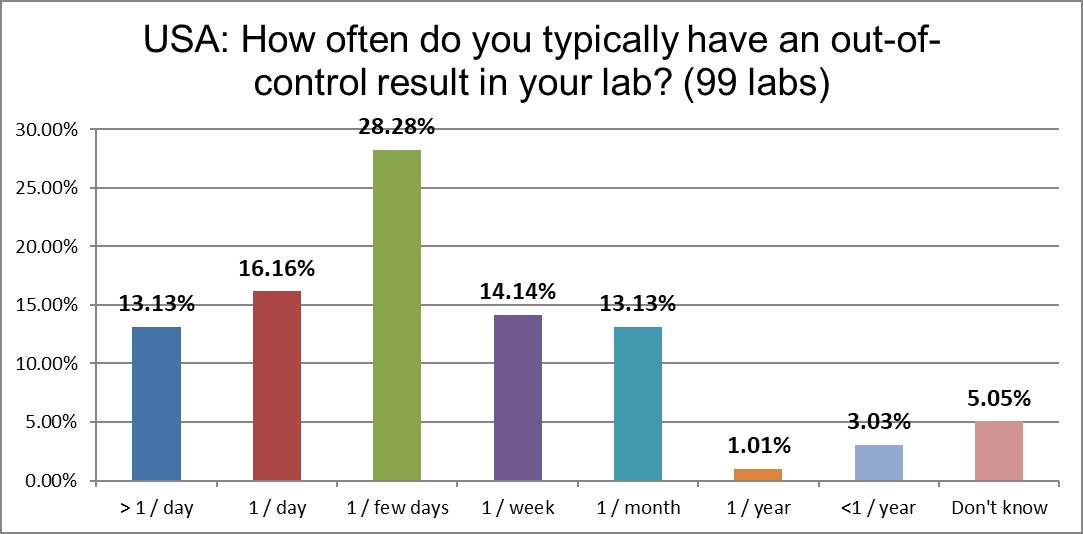
Almost a third of labs in the US are out of control every day, if not more than once a day. It's fairly stable from the error rates recorded in 2017, but it remains significantly higher than the global average.
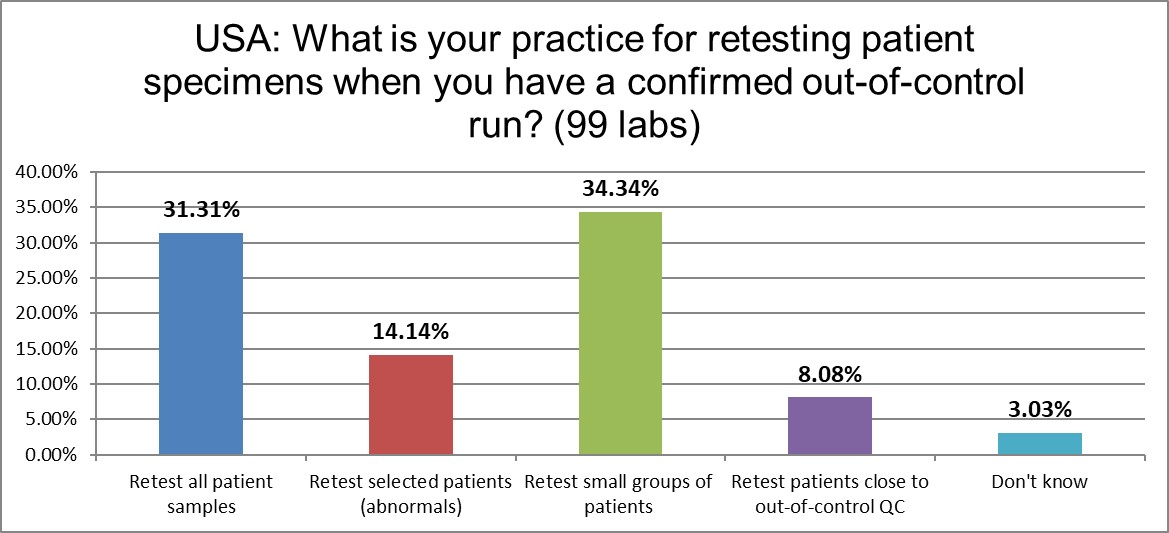
How do US laboratories handle patient specimens from an out-of-control run? The behaviors are just about the same as the 2021 global average, and remarkably stable compared to the 2017 US lab practices.
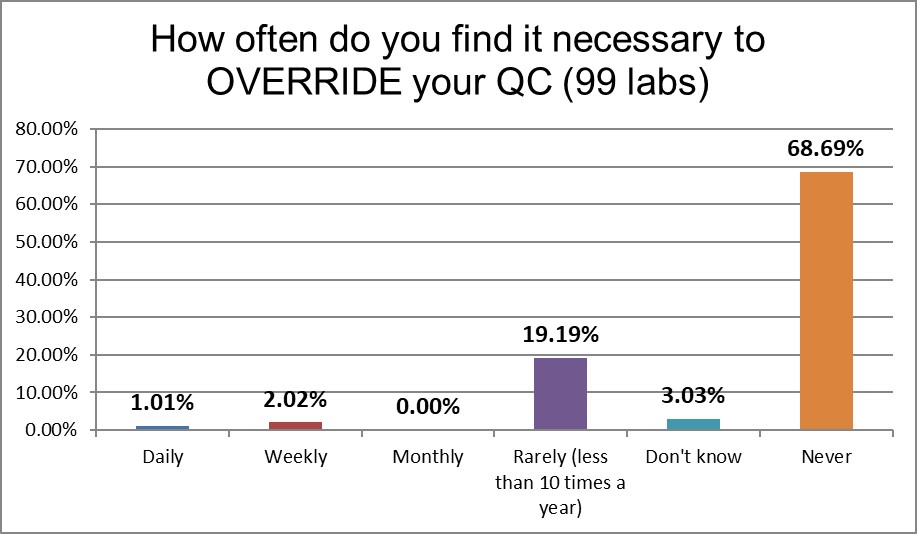
There's a significant difference from the 2017 US practices. More than 10% of labs back then reported overriding QC daily or weekly. This time the labs only report that behavior 3% of the time. That's good news.
The Final Overview
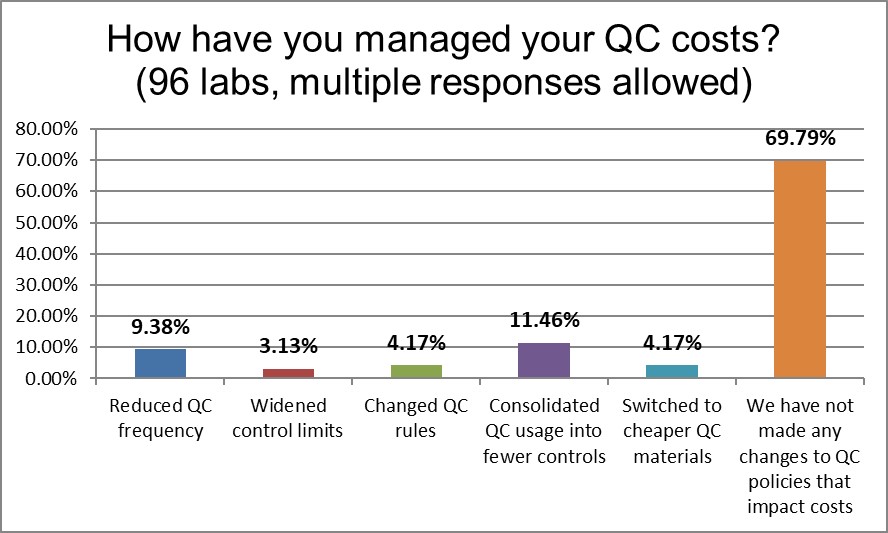
Since the 2017 survey, more labs are reporting that they have not made any changes to manage their QC costs. This is higher than global average. Labs in the US appear to have been going static, a dangerous status quo where there are lots of errors, lots of repeats, and an expensive waste of time and resources.