Basic QC Practices
Break All the Rules - Answers to Part One
Answers to the Part One (N=1) of Break All The Rules.
Break All the Rules! (Answers to Part One)
Sten Westgard, MS
August 2015
The answers
The following data set is going to have a mean of 47 and an SD of 3. I'm not going to tell you which test or what units are involved. They're irrelevant to this exercise. We're also not going to look at the total allowable error or CV or bias. All of that becomes important after we know the basics of QC and charting.
To make it easier, we transformed the data into z-scores, which tell you how many SDs the point is from the mean, and in what direction. For example, a 42.5 is 42.5-47 = -4.5, which is (-4.5)/3 = -1.5 SDs below the mean. so the z-value of 42.5 is -1.5.
Control Measurement |
Value |
Z-value |
Rule Broken |
| 1 | 42.5 | -1.5 | |
| 2 | 55.1 | 2.7 | |
| 3 | 46.4 | -0.2 | |
| 4 | 47.0 | 0 | |
| 5 | 43.1 | -1.3 | |
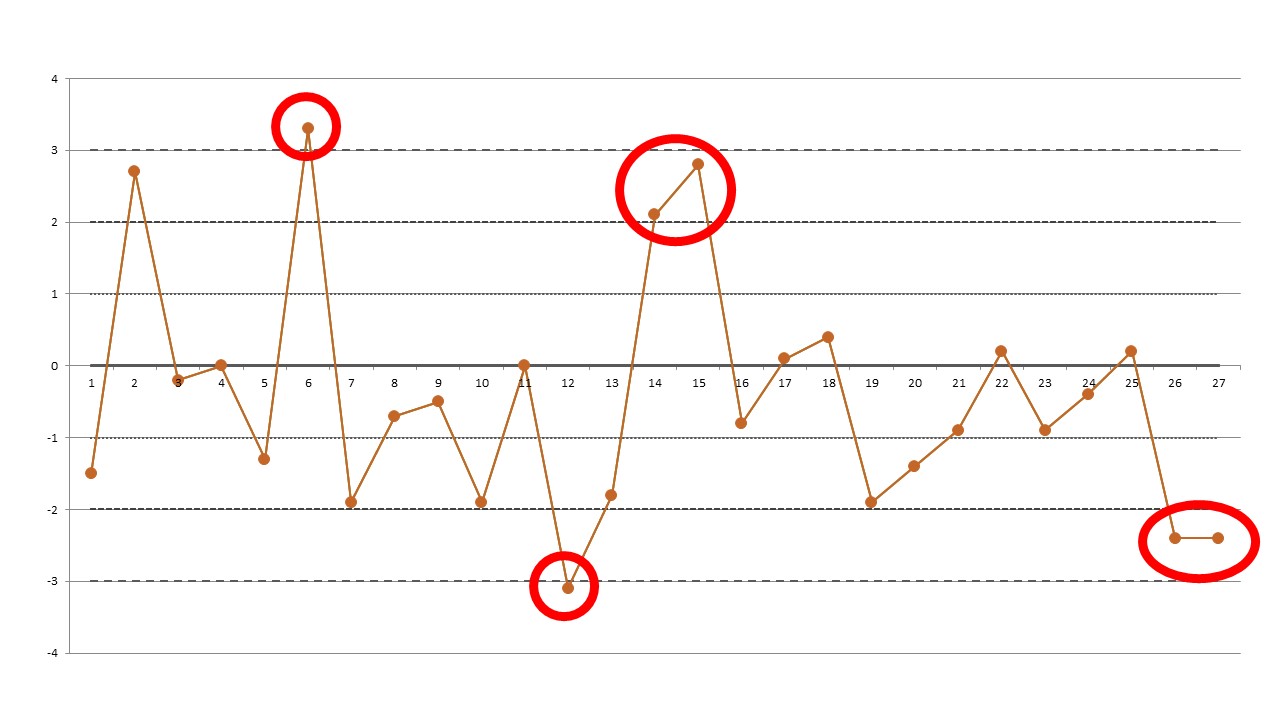
| 6 | 56.9 | 3.3 | 1:3s rule |
| 7 | 41.3 | -1.9 | |
| 8 | 44.9 | -0.7 | |
| 9 | 45.5 | -0.5 | |
| 10 | 41.3 | -1.9 | |
| 11 | 47.0 | 0 | |
| 12 | 37.7 | -3.1 | 1:3s rule |
| 13 | 41.6 | -1.8 | |
| 14 | 53.3 | 2.1 | 2:2 rule |
| 15 | 55.4 | 2.8 | |
| 16 | 44.6 | -0.8 | |
| 17 | 47.3 | 0.1 | |
| 18 | 48.2 | 0.4 | |
| 19 | 41.3 | -1.9 | |
| 20 | 42.8 | -1.4 | |
| 21 | 44.3 | -0.9 | |
| 22 | 47.6 | 0.2 | |
| 23 | 44.3 | -0.9 | |
| 24 | 45.8 | -0.4 | |
| 25 | 47.6 | 0.2 | |
| 26 | 39.8 | -2.4 | 2:2s rule |
| 27 | 39.8 | -2.4 | |
| 28 | 50.9 | 1.3 | |
| 29 | 49.7 | 0.9 | |
| 30 | 45.5 | -0.5 | |
| 31 | 45.2 | -0.6 | |
| 32 | 47.3 | 0.1 | |
| 33 | 47.9 | 0.3 | |
| 34 | 44.3 | -0.9 | |
| 35 | 40.1 | -2.3 | |
| 36 | 48.2 | 0.4 | |
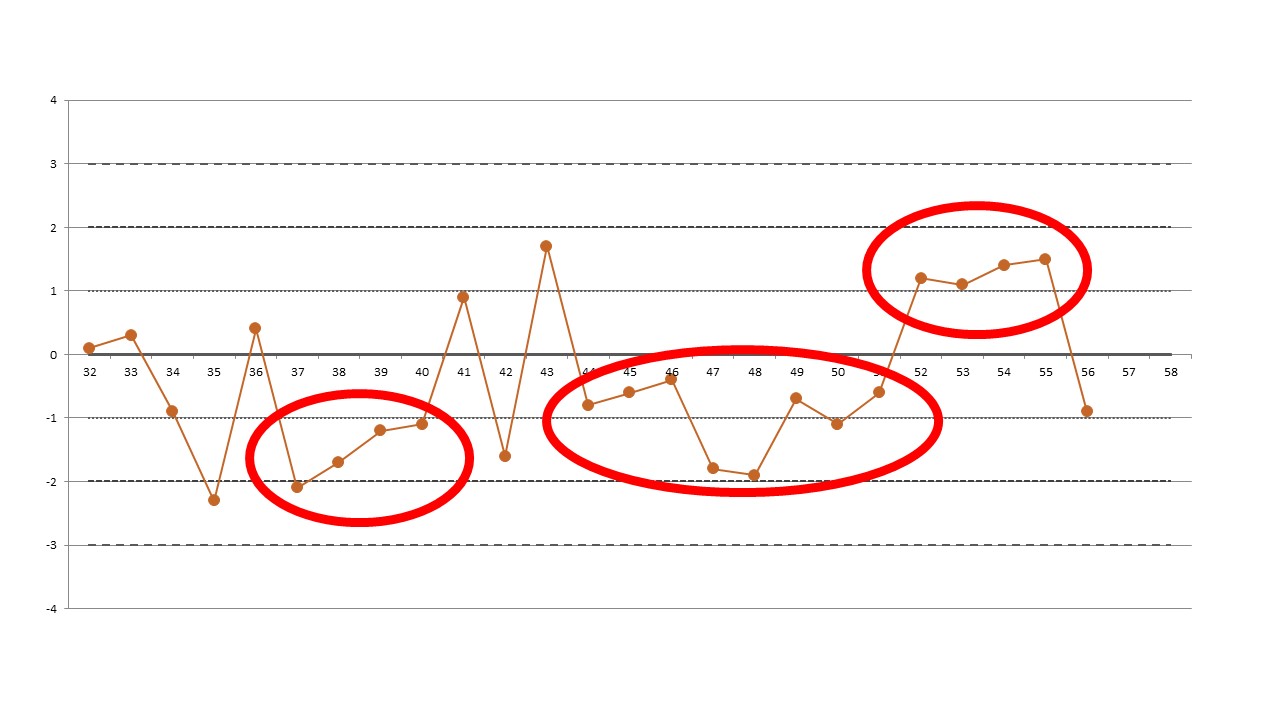
| 37 | 40.7 | -2.1 | 4:1s rule |
| 38 | 41.9 | -1.7 | |
| 39 | 43.4 | -1.2 | |
| 40 | 43.7 | -1.1 | |
| 41 | 49.7 | 0.9 | |
| 42 | 42.2 | -1.6 | |
| 43 | 52.1 | 1.7 | |
| 44 | 44.6 | -0.8 | 8:x rule |
| 45 | 45.2 | -0.6 | |
| 46 | 45.8 | -0.4 | |
| 47 | 41.6 | -1.8 | |
| 48 | 41.3 | -1.9 | |
| 49 | 44.9 | -0.7 | |
| 50 | 43.7 | -1.1 | |
| 51 | 45.2 | -0.6 | |
| 52 | 50.6 | 1.2 | 4:1s rule |
| 53 | 50.3 | 1.1 | |
| 54 | 51.2 | 1.4 | |
| 55 | 51.5 | 1.5 | |
| 56 | 44.3 | -0.9 | |
| 57 | 41.6 | -1.8 | |
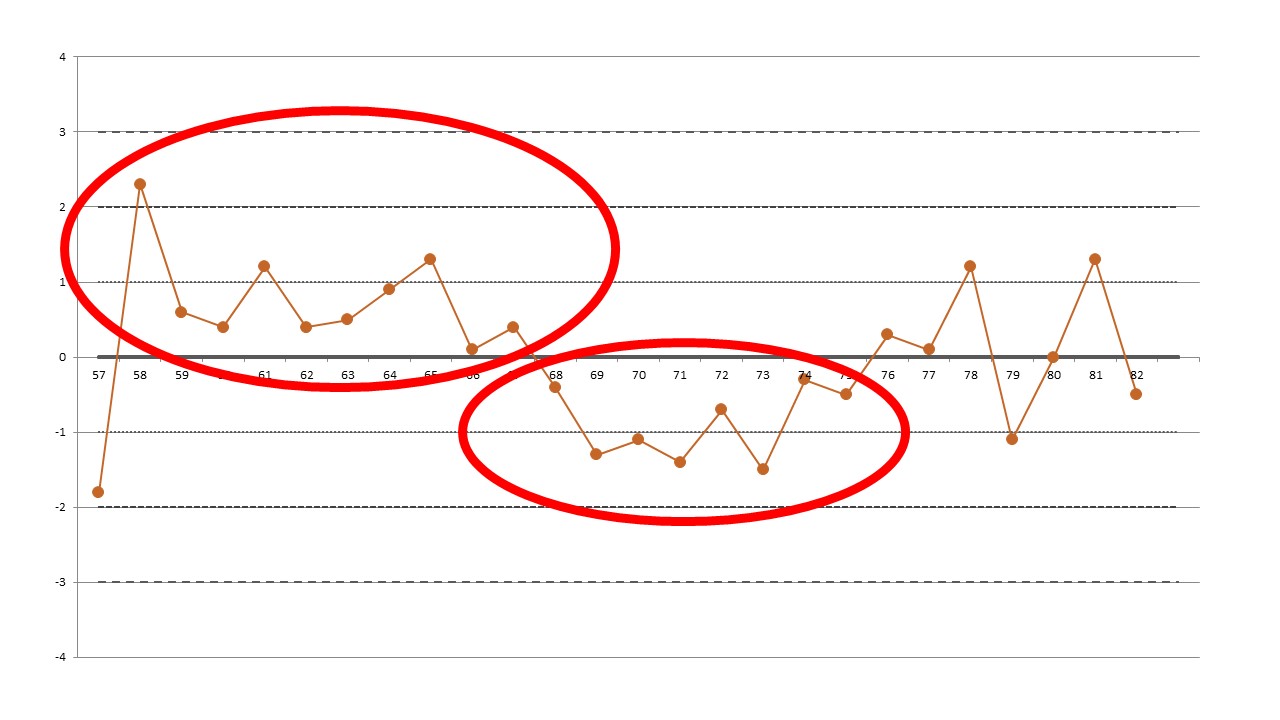
| 58 | 53.9 | 2.3 | 10:x rule |
| 59 | 48.8 | 0.6 | |
| 60 | 48.2 | 0.4 | |
| 61 | 50.6 | 1.2 | |
| 62 | 48.2 | 0.4 | |
| 63 | 48.5 | 0.5 | |
| 64 | 49.7 | 0.9 | |
| 65 | 50.9 | 1.3 | |
| 66 | 47.3 | 0.1 | |
| 67 | 48.2 | 0.4 | |
| 68 | 45.8 | -0.4 | 8:x rule |
| 69 | 43.1 | -1.3 | |
| 70 | 43.7 | -1.1 | |
| 71 | 42.8 | -1.4 | |
| 72 | 44.9 | -0.7 | |
| 73 | 42.5 | -1.5 | |
| 74 | 46.1 | -0.3 | |
| 75 | 45.5 | -0.5 | |
| 76 | 47.9 | 0.3 | |
| 77 | 47.3 | 0.1 | |
| 78 | 50.6 | 1.2 | |
| 79 | 43.7 | -1.1 | |
| 80 | 47.0 | 0 | |
| 81 | 50.9 | 1.3 | |
| 82 | 45.5 | -0.5 |
Remember the conditions:
- We are only running ONE control per run; assume each value represents one run (this is not realistic from a US CLIA scenario, but we've got to start small)
- We're NOT implementing the R:4s control rule, since we don't have two values that occur within a single run (which is the recommended interpretation for the R:4s rule)
- We're NOT looking 2s violations. Let's break that habit right now. In any case, I didn't generate these data points randomly, so we're not going to expect to see a certain number of 2s outliers
- We ARE going to try to find outliers of the following "Westgard Rules": 1:3s/2:2s/R:4s/4:1s/8:x (except remember the R:4s is not applicable)
- We're NOT going to get into the swamp that is repeating of controls. So don't assume anything you see is a repeated control - just stick with "in" or "out"
The Charts
I suspect this is a very long table for most readers. And probably I'm asking quite a bit for readers to convert this chart into something like a levey-jennings chart. So we'll help out immediately by generating some Levey-Jennings control charts
Here are the first 27 data points:
Here are the second set of data points (from 32 through 56):
Here's the last set of data points (57 through 82):
(Obviously, any data points not shown on these charts were automatically in-control.)
So, at the end of this, did you find the same answers?
- 9 different rule violations
- 2 violations of 1:3s rule
- 2 violations of 2:2s rule
- 2 violations of 4:1s rule
- 2 violations of 8:x rule
- 1 violation of 10:x rule
- If only the "Westgard Rules" 1:3s/2:2s/R:4s were necessary for this method
- the 5 violations of 4:1s, 8:x, and 10:x would not have mattered (or we wouldn't have rejected the run based on those events)
- If only the 1:3s control rule was necessary for this method
- the 8 other violations of 2:2s, 4:1s, 8:x, and 10:x would not have mattered (we wouldn't have rejected the run based on those events)