Guest Essay
Sysmex Perspective on Sigma-metrics
Dr. Ian Giles, MD, Director of Scientific Affairs for Sysmex America, shares their experiences with Sigma-metric analysis and its impact upon their operations and customer relations.
A Manufacturer's Perspective on Sigma-metrics: Sysmex
- Special concerns in Hematology about QC
- A Sigma-metric perspective on instrument performance
- Conclusion
Ian Giles, MD
Director of Scientific Affairs
Sysmex America Inc.
Advocating the incorporation of a clinical quality goal as an essential component in Sigma metric calculations is a significant step forward in any instrument design specification development. In combination with growing information about biological variation, the total error and Six Sigma concepts bring clarity and potential standardization to performance determination and enhancement. These concepts were developed for and work best in Clinical Chemistry and Immunology. In Hematology, stability and purity challenges remain, but through the use of QC Design applications, test quality can still be managed appropriately.
The mathematical approaches proposed by Westgard can be applied at multiple levels within the entire quality control process (multiple data sets from multiple instruments), and can provide reliable and appropriate insight into the relevance of specific processes and current instrument performance in any setting. For example, the Sigma metric calculations can be performed in a research and development environment, in an assay value assignment lab, on a single instrument, a single institution, or an entire instrument installed base. Information retrieved can highlight and differentiate probable origins of deficient performance, and allow focused efforts to reduce components of error within complex systems. The total error approach can be applied to error budgeting in instrument design specifications. Traditionally, instrument specification decisions relating to new instruments have been based almost exclusively on competitive analysis, and final decisions have been made by individuals or consensus, without the luxury of being able to design instruments according to clinically relevant performance goals.
By applying simple Sigma calculations to data sets from multiple components of the laboratory / manufacturing system, assessments and comparisons can be made that enable realistic change relative to clinical diagnostic performance requirements, and varying regulatory restrictions.
The use of OPSpecs Charts provides clearly visible evidence of test performance requirements, and QC monitoring needs relative to the clinical performance goals at a specific analyte concentration, and clinical decision threshold.
Multiple examples of Sigma-metric calculations can be found elsewhere on the Westgard website. A specific example from Sysmex is shown below:
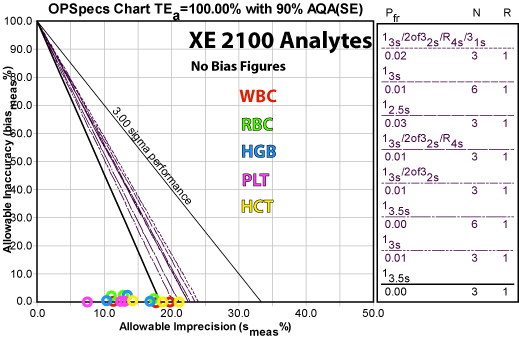
Here is a summary of the recommended QC rules and the resulting reductions in false rejection from common control practices:
Analyte QC Rule Implemented False Rejection (Pfr) Reduction from 12s rule
N=3 Pfr (0.14)Reduction from full "Westgard Rules" N=3 (Pfr =0.02) HCT HGB RBC WBC PLT
A detailed explanation of individual parameter performance for this application is available on the Westgard website
Special concerns in Hematology about QC
It must be recognized that what we are measuring in QC data is a surrogate system, developed in order to overcome the stability challenges associated with transportation of whole human blood samples. If there was a way to maintain stability of human blood for extended timeframes, there would in fact be no need for quality control products.
Logistical constraints and climate play a major role in quality control and sample stability, and the challenges are greater in larger countries, underdeveloped countries, and countries with extremes in temperature variation.
In Hematology, stabilized live cells invariably make up the bulk of the components in the quality materials. Typically these components are of non-human origin, and some synthetic materials are used. There is no absolute requirement to use live cells, but current synthetic surrogates are expensive and difficult to apply across the spectrum of cell types.
In Clinical Chemistry there are primary and secondary standards available which are separated by virtue of their purity and link to a traceable standard. In Hematology, this is less evident. Traceable standards being human blood, but the differences in “purity” between calibrators and QC materials is small or non-existent. Proficiency testing is traditionally done through the use of the same quality control materials as those used to routinely control the instruments.
In all Hematological cell counting, stability of products and samples is the source of the bulk of the variability. This is due to osmotic, temperature and metabolic changes within transport vials that impact cell morphology. Pre-analytical variability should be the focus of troubleshooting, and the secret often lies in the logistical support systems. Delivery times to labs, and temperature control are central to good quality control monitoring. Pre-analytical factors associated with temperature and sample mixing are important considerations, and training of cross-functional staff members can be used to address some of these components.
The service offered by instrument manufacturers can therefore be seen as twofold; 1) addressing the performance of instrument and reagent systems on patient blood in laboratories geographically associated with patients they serve; and 2) monitoring a surrogate product (that does not perfectly mimic changes in human blood, but is our best attempt at that.
This difference between the method performance with patients and the surrogate performance is recognized by advocates of monitoring moving averages in patient populations. It also opens the door for potential development of alternative approaches to monitoring instrument performance in the future. In the meantime it is important to recognize that the system we employ for monitoring performance is often more of a challenge than testing patient samples, and is hampered by stability of blood and quality testing materials. There is a good chance that instrument performance on human blood collected nearby without delay is better than that from data collected on multiple instruments geographically located throughout the world. The logistical, temperature, training conditions and variability in pre-analytical steps of the surrogate system are probably more difficult to control, than conditions on an individual instrument which receives freshly sampled local human blood.
It is for these reasons, that reducing false rejection of QC results makes sense from an efficiency perspective. "Westgard Rules" are particularly useful in that they reduce the incidence of false rejection, and bring a graduated approach to requirements for controlling tests.
A Sigma-metric perspective on instrument performance
Looking at data sets in each sector of the quality process is a useful exercise in order to critically assess existing practice, and identify opportunities for performance enhancement if clinically required, and to justify existing practices if clinical performance goals are already being achieved at clinically relevant analyte concentrations.
Steps in the assay assignment process can be broken down and investigated in isolation, and contributions from each phase to overall performance can be judged. If certain procedures are not achieving good Sigma values, those procedures can become the focus of enhancement efforts.
By looking at Sigma values of the entire instrument installed base, and by identifying uncompetitive components of the quality process, specific steps can be introduced in order to refine the existing approach. By identifying sources of bias and imprecision within the peer group, and by understanding the impact that they have on achieving performance targets for clinical decision making, improvement efforts can become far more focused and sensible. In addition, if no improvement is required, existing performance can be robustly defended.
An example of how these approaches have been applied at Sysmex is described below. During 2005-2006, an assessment of our existing installed base was undertaken in order to look for potential opportunities to refine our existing approach to calibrator assay value assignment and our entire quality control process.
An initial assessment of the peer group data suggested that the performance requirements within the assay assignment component were adequate, but that performance in the field offered an opportunity to improve. This was not unexpected since the contributions to variability and bias are much more likely to occur outside a controlled environment with optimal training, good instrument condition and maintenance, and a single analyzer with dedicated staff.
During the assay assignment process, calibrators and control materials are fresh and vigilance is high. Since the biggest contribution to bias and imprecision in the field is likely to be related to product instability, temperature control and logistical challenges, variability of training, multiple instruments in varying condition etc., focus was placed on variability sources downstream of the value assignment process.
In 2005, we took a snapshot of our customer data (more than 400 instruments) to assess our performance. The data shows Sigma metrics for the 5 principle parameters with existing clinical performance goals as specified in CLIA’88 goals for proficiency testing.
The first snapshot enabled us to look at the status quo in terms of what we had at the time, and showed us that the assay assignment processes were competitive (at that time, that level of performance was competitive), and that events outside our assay lab were less competitive.
At that time, our routine practice was to re-calibrate instruments on a 6 monthly basis, the same frequency that CLIA mandates for calibration verification. In other words, we were not verifying calibration and leaving the instruments alone if the calibration was verified. This was an overly invasive approach, and we thought that for both economic and efficiency reasons, we could be less invasive and do everyone a favor.
When Sigma-metric analysis revealed that method performance was not the problem, the recalibration approach was modified. Instead of a routine 6-month intervention, the maintenance schedule was changed to a a “cycle-based” service, whereby routine maintenance would be performed according to instrument usage, not calendar span.. This enhancement introduced efficiencies not only in terms of service intervention, but also allowed us to introduce and justiify a new remote “calibration verification” process, as opposed to the routine 6 monthly calibration. Remote calibration has been made possible thanks to software developments (specifically the E- verify process and the SNCS networking system) that allow remote gathering of instrument service data. We are now able to verify calibration without traveling to customer sites. If the instruments are adequately calibrated, and their instrument is not requiring service intervention, we leave them alone, and do not re-calibrate or interfere.
Once this new approach was implemented, we needed to allow time for data collection, the improvements are reflected in the Sigma metrics of QC data from the installed base (which is part of our routine monitoring of QC performance, independent of calibration verification). The second row of the table shows this more recent "snapshot" reflecting the improved instrument performance.
Conclusion
The Westgard concepts provide valuable tools for manufacturers to assess and improve not only instrumentation, but also their service practices. Calculating Sigma metrics of different processes, at different places in the value chain, allows manufacturers to isolate and identify areas for improvement and document quality assurance.
For more information about Sysmex and their eVerify (remote calibration) process, download and view this pdf (900k)