
Sigma Metric Analysis
An Erba EM 360 and a Vitros 5600 in Gujarat, India
A recent study compared a wet chemistry Erba EM 360 with a dry chemistry Vitros 5600 and concluded that wet is better than dry. Was that the correct conclusion?
An Erba EM 360 and a Vitros 5600 in Gujarat, India
August 2026
Sten Westgard, MS
[Sigma score: long-term imprecision: +0.5; controls near decision points: +0.5; 3rd-party controls: + 0.5; Bias from EQA/PT: +1; Bias from long-term: +0.5. Final Score: 3. Moderate quality data. ]
A recent study looked at the difference between wet and dry chemistry, specifically an Erba EM 630 and a Vitros 5600, and 14 common biochemistry tests, at an Indian laboratory in West Bengal:
Dussa HCK, Varsani T, Ahaya V, Marwah S, Toshniwal P. Six Sigma Metrics as a Means of Assessing Internal Quality Control in Wet Chemistry Versus Dry Chemistry. Int J Drug Deliv Technol. 2026;16(40s): 1190-1200. DOI:10.25258/ijdt.16.40s.120
We're going to try and salvage some of this performance data and apply the CLIA 2025 quality goals to see what the analytical Sigma metrics could be.
Calculating Sigma metrics from routine laboratory performance data.
The imprecision and bias of the analyzers
"[T]wo levels of commercial Lyphochek control material from Bio-Rad Laboratories were analyzed....Imprecisino data (coefficient of variation, CV%) for all fourteen analytes were extracted from the laboratory's monthly internal quality control records." Six months of data, from August 2024 to January 2025, were used to determine imprecision.
"The bias% was calculated from the CMC-EQAS results." This bias% was used for both the low and high level Sigma metric calculations.
TEa goals were taken from CLIA 2025.
One weakness of the study, the levels of the control were not shared. For many of the analytes, the CLIA 2025 goals sets unit-based goals at the lower end of the range. In the absence of know that level, only the upper end goal can be used. So, it is possible that some of the low level Sigma metrics might actually be better, if full information could be supplied.
First, here are the analytical Sigma metrics of the Vitros 5600:
| Vitros 5600 Test | % TEa | % Bias | % CV | Sigma |
| Albumin | 8 | 2.43 | 2.98 | 1.87 |
| Albumin | 8 | 2.43 | 2.48 | 2.25 |
| Alk Phos | 20 | 0.05 | 2.92 | 6.83 |
| Alk Phos | 20 | 0.05 | 2.57 | 7.76 |
| ALT | 15 | 0.08 | 3.72 | 4.01 |
| ALT | 15 | 0.08 | 2.55 | 5.85 |
| AST | 15 | 0.05 | 3.15 | 4.75 |
| AST | 15 | 0.05 | 3.28 | 4.56 |
| Bilirubin, Total | 20 | 3.2 | 6.07 | 2.77 |
| Bilirubin, Total | 20 | 3.2 | 3.5 | 4.80 |
| Chloride | 5 | 0.01 | 1.85 | 2.70 |
| Chloride | 5 | 0.01 | 2.03 | 2.46 |
| Cholesterol | 10 | 1.41 | 2.6 | 3.30 |
| Cholesterol | 10 | 1.41 | 2.77 | 3.10 |
| Creatinine | 10 | 3.33 | 2.58 | 2.59 |
| Creatinine | 10 | 3.33 | 2.2 | 3.03 |
| Glucose | 8 | 1.86 | 1.93 | 3.18 |
| Glucose | 8 | 1.86 | 1.83 | 3.36 |
| HDL | 20 | 2.79 | 3.75 | 4.59 |
| HDL | 20 | 2.79 | 3.07 | 5.61 |
| Protein, Total | 8 | 1.93 | 1.93 | 3.15 |
| Protein, Total | 8 | 1.93 | 1.92 | 3.16 |
| Triglycerides | 15 | 3.27 | 3 | 3.91 |
| Triglycerides | 15 | 3.27 | 2.75 | 4.27 |
| Urea Nitrogen | 9 | 1.36 | 2.28 | 3.35 |
| Urea Nitrogen | 9 | 1.36 | 1.67 | 4.57 |
| Uric Acid | 10 | 0.81 | 1.78 | 5.16 |
| Uric Acid | 10 | 0.81 | 1.83 | 5.02 |
Next, here are the metrics for the Erba EM 360:
| Erba EM 360 Test | % TEa | % Bias | % CV | Sigma |
| Albumin | 8 | 1.01 | 2.25 | 3.11 |
| Albumin | 8 | 1.01 | 2.84 | 2.46 |
| Alk Phos | 20 | 9.03 | 3.36 | 3.26 |
| Alk Phos | 20 | 9.03 | 3.31 | 3.31 |
| ALT | 15 | 8.89 | 5.25 | 1.16 |
| ALT | 15 | 8.89 | 3.62 | 1.69 |
| AST | 15 | 4.8 | 4.24 | 2.41 |
| AST | 15 | 4.8 | 3.5 | 2.91 |
| Bilirubin, Total | 20 | 6.32 | 2.48 | 5.52 |
| Bilirubin, Total | 20 | 6.32 | 2.71 | 5.05 |
| Chloride | 5 | 2.2 | 2.22 | 1.26 |
| Chloride | 5 | 2.2 | 2.01 | 1.39 |
| Cholesterol | 10 | 2.5 | 2.16 | 3.47 |
| Cholesterol | 10 | 2.5 | 1.95 | 3.85 |
| Creatinine | 10 | 6.87 | 2.06 | 1.52 |
| Creatinine | 10 | 6.87 | 1.97 | 1.59 |
| Glucose | 8 | 3.19 | 2.1 | 2.29 |
| Glucose | 8 | 3.19 | 1.79 | 2.69 |
| HDL | 20 | 6.57 | 2.18 | 6.16 |
| HDL | 20 | 6.57 | 2.33 | 5.76 |
| Protein, Total | 8 | 2.34 | 2.93 | 1.93 |
| Protein, Total | 8 | 2.34 | 2.85 | 1.99 |
| Triglycerides | 15 | 3.64 | 2.01 | 5.65 |
| Triglycerides | 15 | 3.64 | 1.87 | 6.07 |
| Urea Nitrogen | 9 | 4.27 | 3.91 | 1.21 |
| Urea Nitrogen | 9 | 4.27 | 4.33 | 1.09 |
| Uric Acid | 10 | 3.24 | 2.44 | 2.77 |
| Uric Acid | 10 | 3.24 | 2.17 | 3.12 |
That's a lot of numbers, it may be hard to ascertain which instrument is better or worse at a single glance. Below, we summarize the percentage of those 28 levels (14 tests with 2 levels each) that fall into different Sigma categories.
| Sigma | ERBA EM 360 | Vitros 5600 |
| 6 | 7.14% | 7.14% |
| 5 | 14.29% | 14.29% |
| 4 | 0% | 25% |
| 3 | 21.43% | 32.14% |
| <3 | 57.14% | 21.43% |
Interestingly, both instrument have the same percentage of their performance at 5 and 6 Sigma. But it's a very small part of the performance. Both instruments have a majority of performance at 3 Sigma or below. Where there is the biggest difference is the performance below 3 Sigma, where the Erba EM 360 has more than twice the poor performance than the Vitros 5600
If this summary is not illuminating enough, the graphic illustration makes the difference stark.
Graphic illustration of analytical performance by NMEDx chart
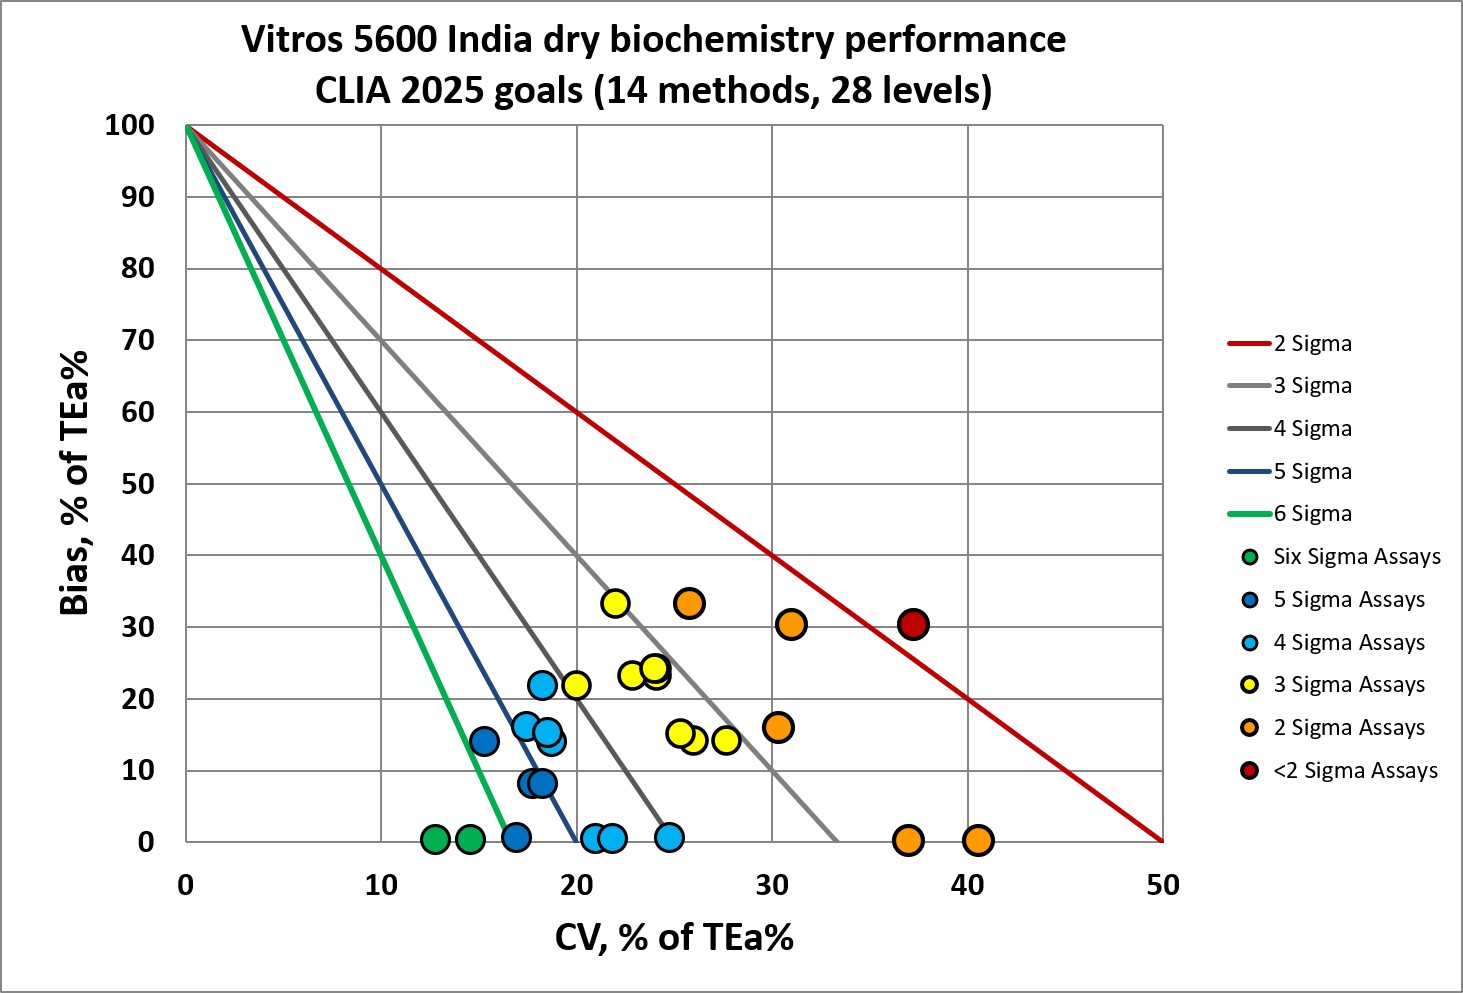
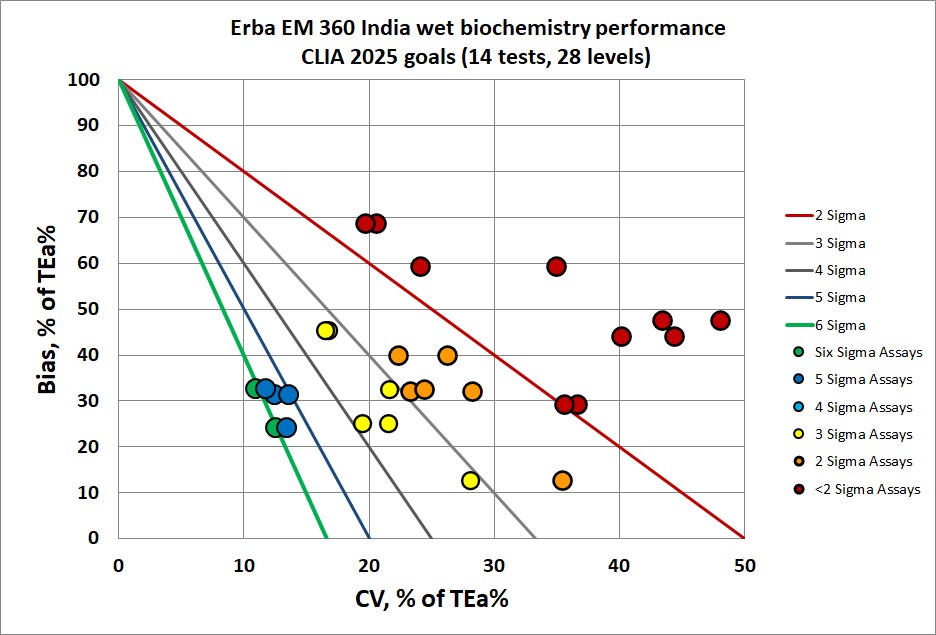
Neither of these instruments is fantastic, but one is clearly better than the other. One would require many more Westgard Rules than the other.
Conclusion
The authors concluded, "Overall, the observed superiority of wet chemistry for selected parameters and the predominantly precision-limited behavior of dry chemistry underscore the importance of laboratory-specific method verification rather than reliance on published expectations alone."
"This study demonstrates that, contrary to much of the published literature, wet chemistry analysers in our setting achieve higher sigma performance than dry chemistry."
Unfortunately, we conclude the opposite, that the Vitros 5600 outperforms the Erba EM 360, that in this case, dry is better than wet. There may be a case to be made for wet over dry, but it's not being made in this study.
The quality of the data in the study is moderate, but the conclusion made on this data is not.