It's time to change your tune on QC Frequency
Determining your QC frequency used to be the reserve of the few and highly sophisticated. It's time we made some calculators available so the rest of the world can do it.
QC Frequency: It's Time to Change your Tune!
[Additional QC Frequency Calculators for 2 and 3 Levels of Controls]
James O. Westgard, Hassan Bayat, Paul Schilling and Sten A. Westgard
October 2021
We have added 2 new online QC Frequency calculators: http://tools.westgard.com/frequency_calculator2.shtml, and http://tools.westgard.com/frequency_calculator3.shtml. They are similar in format to the first QC Frequency calculator but include an additional column for the “average” Patient Risk Sigma. This should facilitate selection/design of SQC strategies based on the Sigma performance observed over a concentration range, rather than the Sigma performance at a single concentration. These calculators are intended to support the application of the CLSI C24-Ed4 “road map” [1] for developing risk based SQC strategies, with calculation of QC Frequency in terms of run size, in accordance with Parvin’s patient risk model [2].
These calculators can be used to compare the performance for different levels of controls, compare the SQC strategies appropriate at different levels of controls, and compare the SQC strategies appropriate for the range of concentrations represented by the controls. We know that it is likely to observe different Sigmas at different concentrations. The issue is how to handle those differences in performance when designing an SQC strategy. One approach is to select the most critical decision level concentration; another is to average the Sigmas to design for a range of concentrations. The new calculators allow comparison of performance for each level of control vs the average performance over the concentration range of those controls.
The critical parameters for calculating QC Frequency are the Patient Risk Sigma and the Patient Risk Factor. The Patient Risk Sigma is equal to the calculated Sigma when Sigma ≤ 6.0 but is assigned a value of 6.0 if the calculated Sigma ˃ 6.0. For example, if Sigma were 3.0 for one level and 9.0 for another, the high control is assigned a Sigma value of 6.0, rather than 9.0, and the average Sigma is 4.5, not 6.0. The reasoning is that a high Sigma at one level should not overwhelm lower values at other levels. Note that the Patient Risk Factors can be assigned to each level of control, but they are not averaged; rather you must also assign the Patient Risk Factor that is used to calculate run size based on the average Patient Risk Sigma. The other averages that are calculated have limited meaning and should not be over interpreted. They are provided in case they might provide some additional information.
To illustrate the use of these new calculators, we again consider the two example applications that were provided in the CLSI C24-Ed4 document.
CLSI C24-Ed4 Calcium Example
The information is found in Table 3 of the C24-Ed4 document (pp 43-45). The quality goal is 6.0%; at a concentration of 10.20 mg/dL, this corresponds to a TEa of 0.612 mg/dL; at a concentration of 12.96 mg/dL, TEa is 0.776 mg/dL. Bias is assumed to be zero. The observed SD is 0.143 mg/dL for the lower control and 0.193 mg/dL for the higher control. The calculator results are shown below:
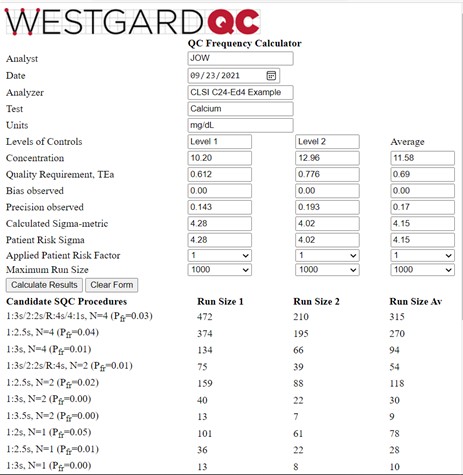
The average Patient Risk Sigma is the same as the average calculated Sigma-metric because neither of the calculated values exceeded 6.0. And, as would be expected, the run sizes for the average Patient Risk Sigma of 4.15 are between those for the Sigmas of 4.28 and 4.02 observed for the two control levels. As discussed elsewhere [3], the recommended answer in the C24-Ed4 document was to utilize a multi-rule procedure with N=2, which provides a run size of 54 patient samples based on the average Sigma, even though the desired run size is 125 patients (500 samples every 24 hour, 6 hour runs, 500/4 or 125 patients/run). It would be better to employ a multirule procedure with N=4 to reduce the risk of erroneous results for the desired run size of 125 patient samples.
CLSI C24-Ed4 TSH example
Information is again provided in Table 3 of the C24-Ed4 document [2, pp 43-45]. Three controls are analyzed at levels of 0.12, 0.85, and 5.20 mIU/L. The TEa goal of 23.7% converts to values of 0.028, 0.20, and 1.23 mIU/L. Bias is again assumed to be zero and the observed SDs are 0.0053, 0.022, and 0.131 mIU/L, resp. The calculator results are shown below:
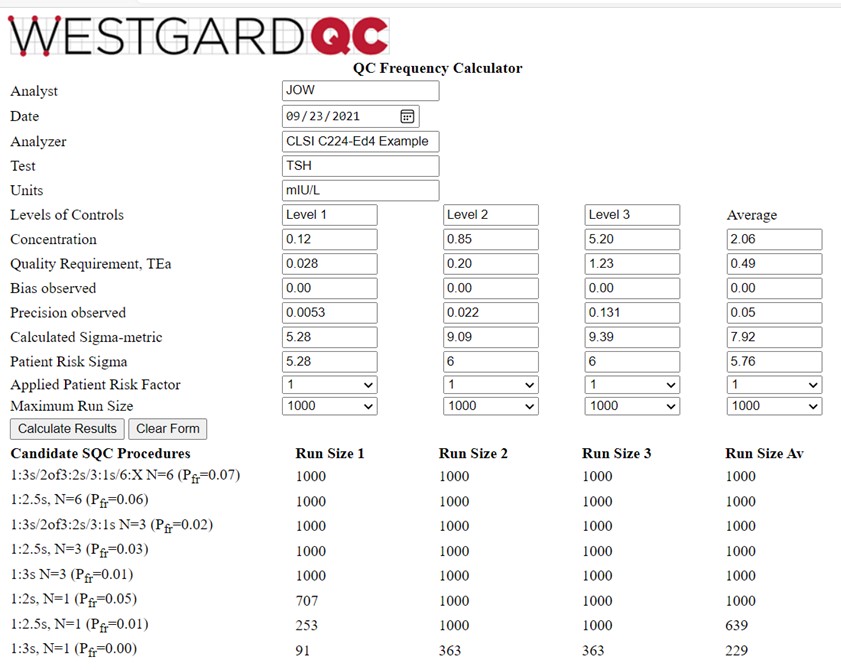
This is a more interesting example for illustrating the behavior of the QCF calculator. Note that the calculated Sigma-metrics are 5.28, 9.09, and 9.39, for an average of 7.92. However, the Patient Risk Sigmas are 5.28, 6.0, and 6.0, for an average of 5.76. The run sizes calculated for the Sigma average of 5.76 are still very large, somewhat higher than those for the Level 1 control, and lower than for the Level 2 and Level 3 controls, as would be expected based on their respective Sigma values. A 1:3s control rule with N=3 is an appropriate selection.
Multi-test chemistry and enzyme analyzer applications
More detailed applications for multi-test analyzers will be available soon in a publication describing a multi-test analyzer planning model [4].
References
- CLSI C24-Ed4. Statistical Quality Control for Quantitative Measurement Procedures: Principles and Definitions. Clinical and Laboratory Standards Institute, 950 West Valley Road, Suite 2500, Wayne PA, 2016.
- Parvin CA. Assessing the impact of the frequency of quality control testing on the quality of reported patient results. Clin Chem 2008;54:2049-2054.
- Bayat H, Westgard SA, Westgard JO. Planning risk-based SQC strategies: Practical tools to support the new CSI C24-Ed4 guidance. J App Lab Med 2017;2:211-21.
- Westgard SA, Bayat H, Westgard JO. A multi-test planning model for risk based statistical quality control strategies. Clin Chim Acta 2021 (CCACTA-D-21-01666, in press) https://doi.org/10.1016/j.cca.2021.09.020.