Basic QC Practices
Would your lab have caught this error?
For all its ubiquity in the lab, proper QC isn't easy. Even though every laboratory has to perform Quality Control, that hasn't made the task any simpler. It still relies on the right mean, the right SD, the right control limits, the right rules and numbers of control measurements, and the right interpretation of control data points. If you get one part of this system wrong, it can throw off the correct implementation. Here's an example that was recently published showing the difficulties and challenges of performing proper QC.
Consequences of a missed lab error: Would your lab have caught this?
Sten Westgard
JUNE 2013
In all the studies of errors, error rates, and the total testing process, it's been extremely rare to find a publication that discusses the clinical impact of an analytical error. It's much easier to see how many specimens come in hemolyzed or mislabelled, that's what you see happening right under your nose. But to properly detect an analytical error and then track the impacts of the test results on clinicians and patients, that's a much harder task. The fact that we don't see papers cover this subject isn't a sign that those errors aren't happening. It's just a sign of how difficult it is to perform such a study or observe and record the occurrence of such an error.
That makes this recent publication all the more important:
Clinical consequences of erroneous laboratory results that went unnoticed for 10 days, Loh TP, Lee LC, Sethi SK, et al. J Clin Pathol 2013:66:260-261
In our discussion here, I don't want to place blame on a particular instrument system. Instead, let's work from this perspective: an analytical error of this kind of error might occur on any platform by any diagnostic manufacturer.
Here's what happened (an excerpt):
"On 20 June 2012, an endocrinologist alerted the laboratory to possible spurious results after noticing extremely high insulin-like growth factor-1 (IGF-1) concentrations in two clinically asymptomatic patients. The ensuing investigations revealed an error in the analyser [ed. NAME WITHHELD] that performed five endocrine tests, including IGF-1, and affected all results reported on 11 June. The error eluded the internal quality control (QC) testing performed routinely prior to patient sample analysis.... All erroneous results (n=63) were unknowingly reported. Retesting of all specimens belonging to 49 patients revealed 2.1-to >108-fold reductions in their results."
In other words, this error was finally detected by the clinician, not the laboratory. And once the laboratory was alerted, they discovered that the error extended to 5 different tests (IGF-1, ATG, ATPO, GH, ACTH). The error was found to have impacted 63 test results and 49 patients. As a result, there were 4 procedures ordered erroneously, including a CT Scan; seven patients were ordered for retesting by clinicians; and 6 potential and actual misdiagnoses were made or could have been made. Once the error was discovered, all of those problems were corrected, including the cancellation of procedures, changes in diagnosis, etc. This was lucky in that no one's health was adversely harmed.
If we take a systems perspective of this incident, we see that "one" laboratory error can have a very large impact. We often focus our efforts on pre-analytical errors, which are far more visible and tangible to us, but even when we misplace a specimen, that's an error that affects only one patient. With analytical laboratory errors, we can be affecting hundreds, perhaps thousands of patients. This laboratory was doing a small volume of testing, so 10 days didn't affect a large number of patients. Consider the impact of 10 days of missed error on a large automated system. That's "one" error that might have a massive impact on patients.
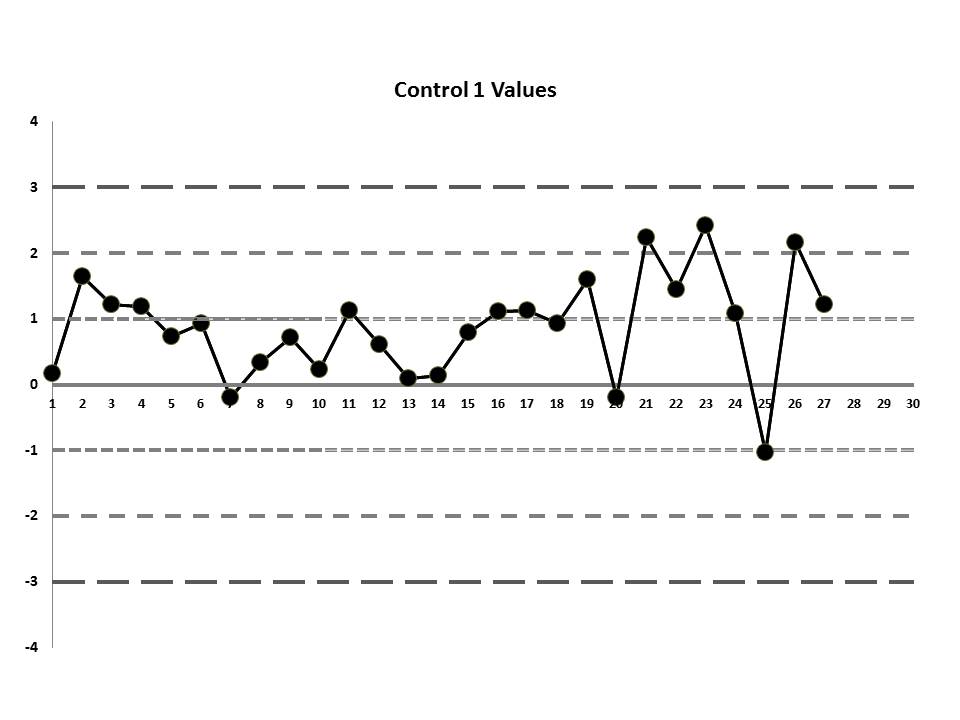
But let's get to the matter at hand? What was the QC that the laboratory was seeing? Well, they were running two controls and using the manufacturer's mean and SD. So this is what they saw:
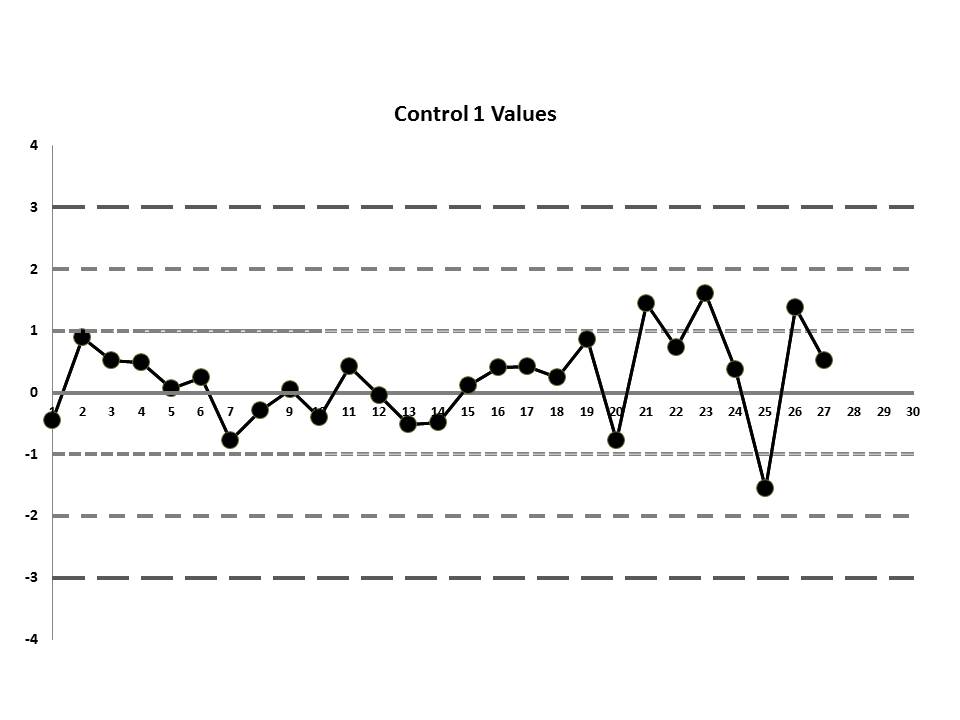
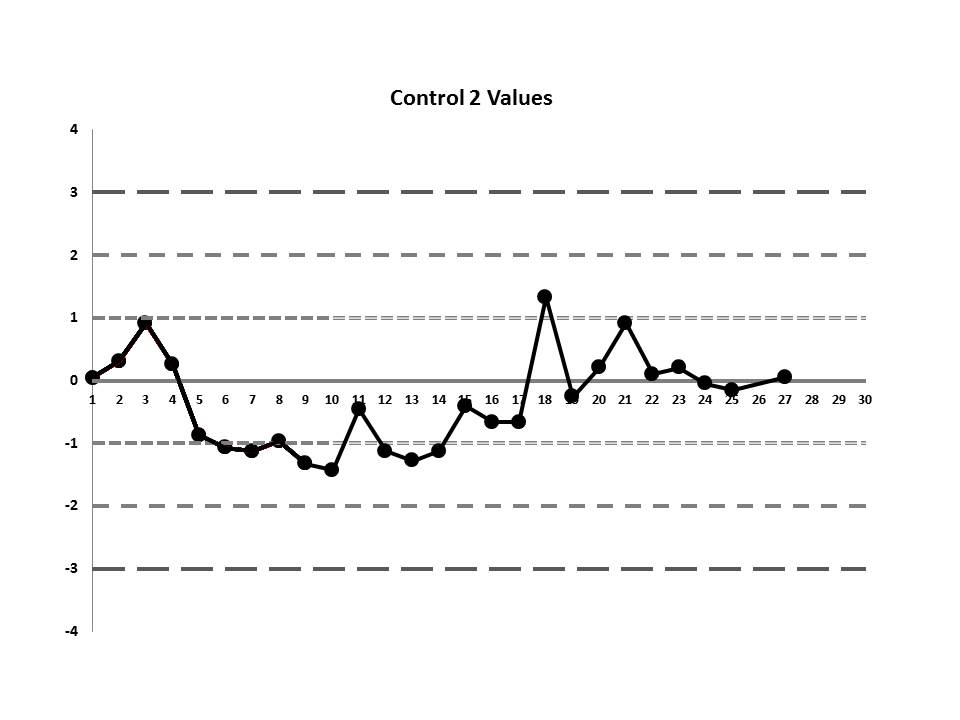
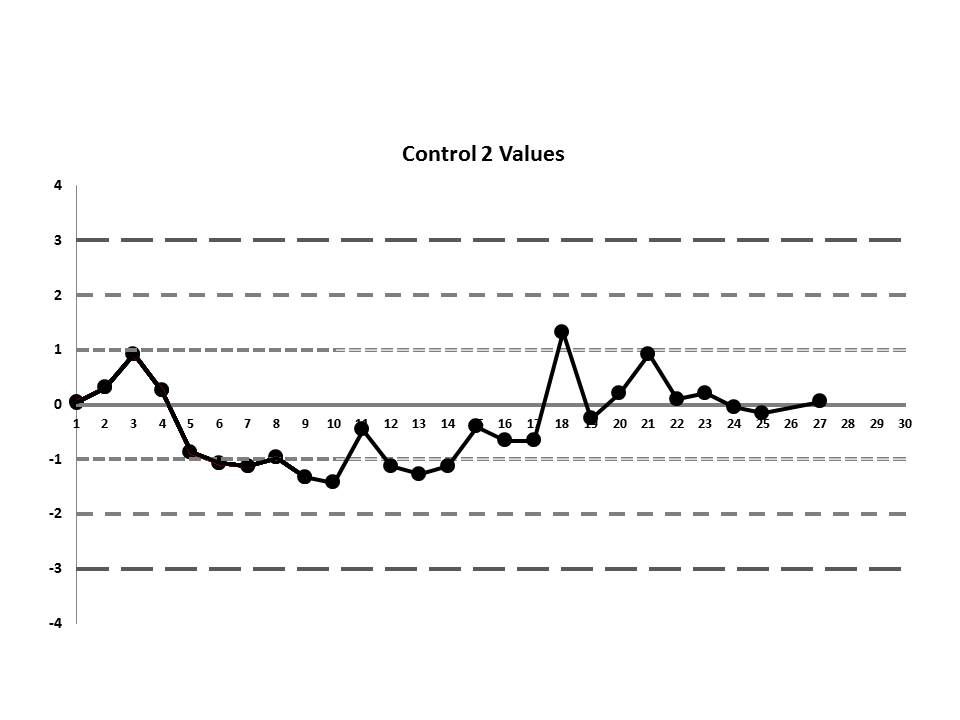
So, do you see any problems? No big outliers, of course. All the data points are pretty much within 1 SD. That should probably make you suspicious right there. Not much to be seen on the first control, but if we scrutinize the second control, there's a more obvious error:
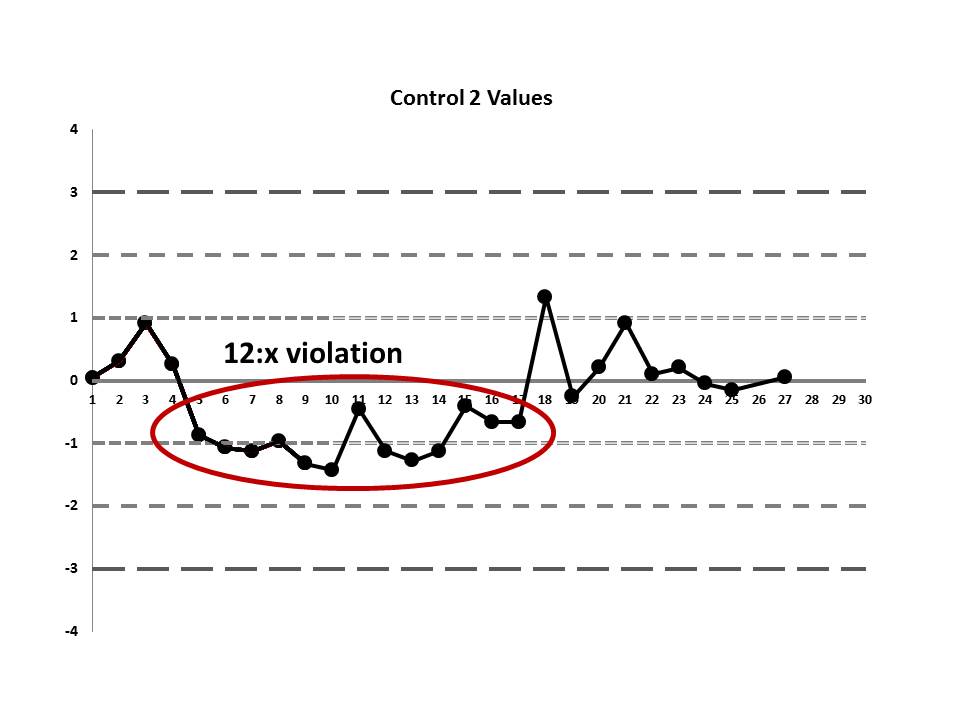
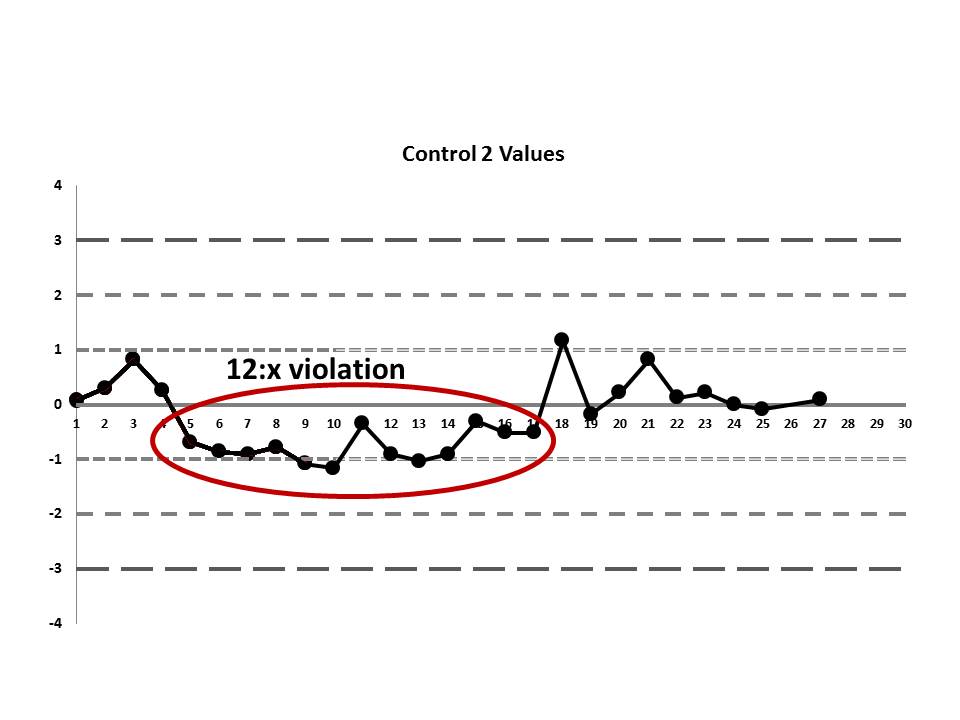
There's a 12:x rule violation (actually, 13 points are below the mean). So there appears to be a systematic error occurring.
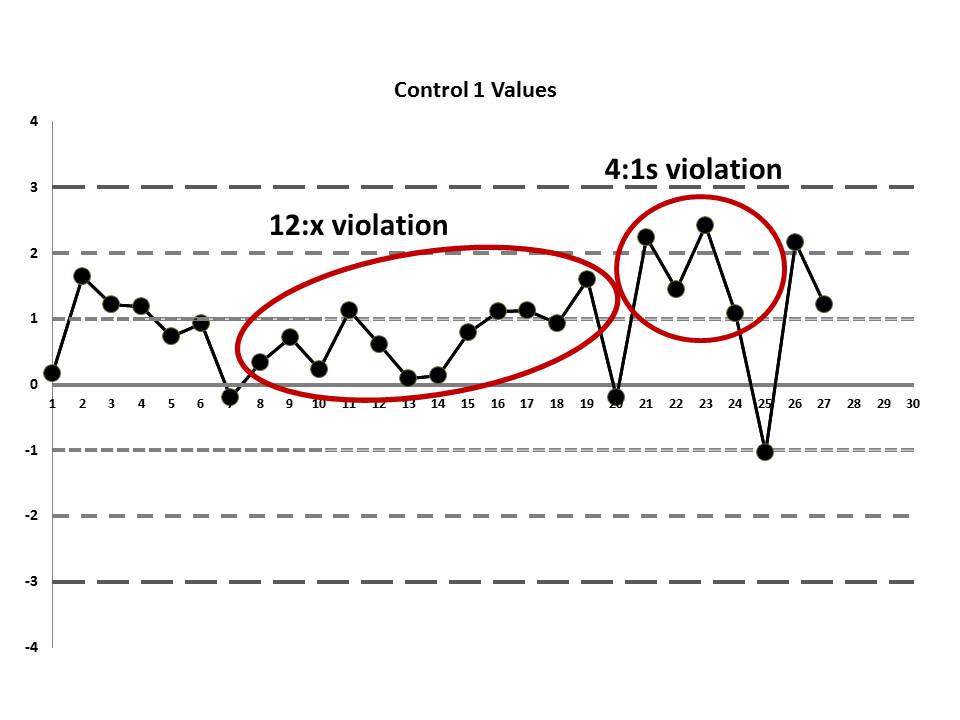
But if we look at both the lower and upper controls, we can actually find a few more errors, too.
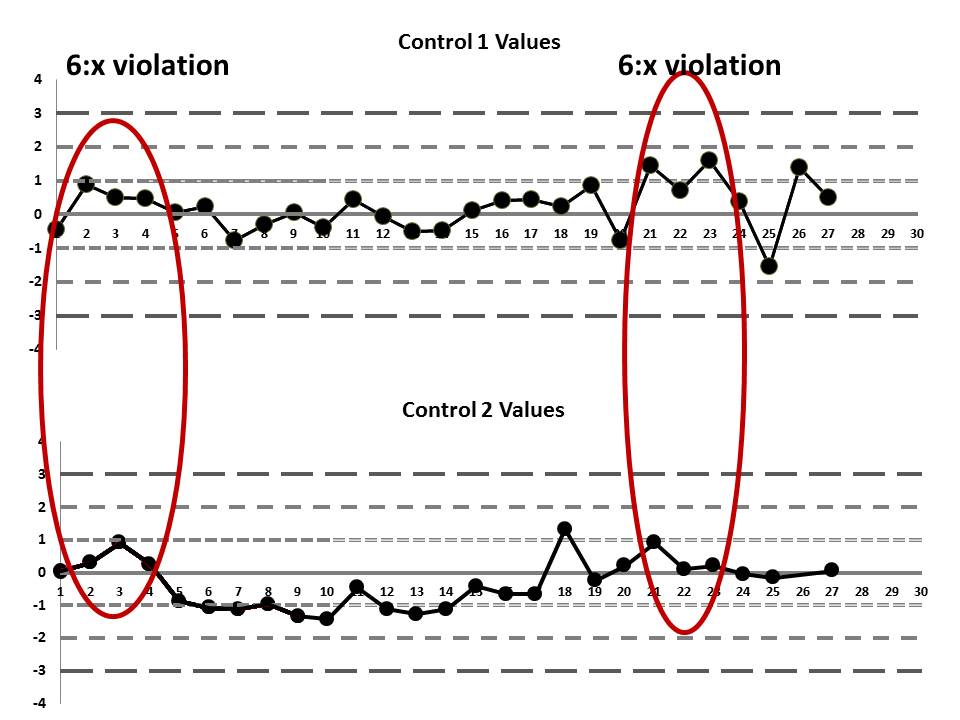
If we interpret across-materials (both high and low controls at the same time), we also see that the 6:x control rule is being violated.
If those violations were present, why didn't the laboratory catch them? Well, the explanation is simple: the laboratory's QC procedure was not using "Westgard Rules" or any of the 6:x or 12:x rules. They were only using a minimal combination of the 1:3s and 2:2s control rules. Neither of those rules was violated.
This is why at the very end of this data sequence, it wasn't the lab that noticed an error. Instead, "an endocrinologist alerted the laboratory to possible spurious results after noticing extremely high insulin-like growth factor-1 (IGF-1) concentrations in two clinically asymptomatic patients." QC didn't do its job. The error got out of the lab and it was only noticed because the results stopped making sense.
There's still one more problem to this scenario. The above charts are shown when the data is plotted using the manufacturer's mean and SD, not the actual laboratory's mean and SD. While this is not mentioned in the paper, the authors were kind enough to give us an "actual mean and SD" of the IGF method. Let's see what this data looks like when we use the real mean and SD of the laboratory:
Remember, the data points haven't changed, just the mean and the SD, which changes where the control limits are drawn.
Now it appears even more obvious that there are some error occurring:
So we see that when the actual mean and SD of the laboratory are used, even more errors are detected. Yet still none of those errors would have triggered the two-rule combo that the laboratory had in place.
Which begs the question: why was the laboratory using just 1:3s and 2:2s for their QC procedures for this test? This is a question many labs need to ask themselves: "Why are we using the rules that we're using now?" If it's just out of tradition ("We do these rules because those are the rules we've always done") or if it's just because the manufacturer is telling us to "loosen up" (that is, the manufacturer tells us not to use restrictive rules, means, or SDs and gives no justification), then we're setting ourselves up for failures. In this situation, the reason the clinician caught the lab error, not the laboratory, was because the laboratory wasn't using the right rules, nor was it using the right mean and SD.
If the laboratory had evaluated the performance of this IGF method and designed QC rationally (to try and meet a quality goal), it would have determined that a robust set of "Westgard Rules" were needed for this test, a multirule combination that would have included the 4:1s and 8:x rules. Then, regardless of whether it was using the manufacter mean and SD or its own mean and SD to generat the LJ charts, the laboratory would have had a chance to catch the error before the clinicians got hit with it.
Let's not blame the techs or the management of this one laboratory for the failure. This is not a "bad apple" lab we can dismiss. This is a laboratory that is trying very hard to do the right thing, just like your laboratory and other laboratories all over the world. In fact, we have to praise this laboratory for having the courage to publish this report and embark on a journey of internal self-scrutiny of their QC practices. They are to be commended, because having acknowledged their error, they have a chance now to correct it and change their practices so this won't happen in the future. For too many labs, the other path is chosen: let's ignore what we do so we don't have to make any changes.
The true moral of the story here is that we need to be vigilant. We can't assume our methods are perfect and error free. We can't assume using the manufacturer's mean and SD is going to give us a sufficient tight perspective on performance. And we can't assume we can use just any QC rule to properly monitor our methods. We need to do better than this.
We hope that this lesson is helpful to you. We hope that other labs will be inspired to share similar cases with us in the future.