Basic QC Practices
Break all the rules (Part 3)
After a significant time elapsed since parts one and two, we continue our series on basic QC interpretation. We are finally tackilng that most complex scenario: what happens when we have 3 controls? How do we interpret across materials/levels? Does that mean we stop interpreting across runs? Here's another simple exercise - if you're told that all the rules have been broken, can you find where the violations occurred?
Break All the Rules! (Part Three)
Sten Westgard, MS
July 2017
As laboratorians, we are constantly pressured to achieve compliance, to operate with an absence of problems, to generate a stream of data points that land lovingly near the mean. As a contrarian exercise, this article is about the exact opposite of getting all your data to stay in control. We're going to look at data that's out-of-control, breaking all of the various "Westgard Rules." And we're going to see if you can identify which data points are outliers and which rules are being broken.
As the title suggests, this is third installment. Part One was just one control. Part Two was two controls. Now we're going to get about as complicated as most labs gets. We're going to look at rule violations with three controls.
The data
The following data set is going to have a low control with a mean of 47 and an SD of 3 and a middle control with a mean of 71 and an SD of 8 and a high control of 256 with an SD of 18. I'm not going to tell you which test or what units are involved. They're irrelevant to this exercise. We're also not going to look at the total allowable error or CV or bias. All of that becomes important after we know the basics of QC and charting.
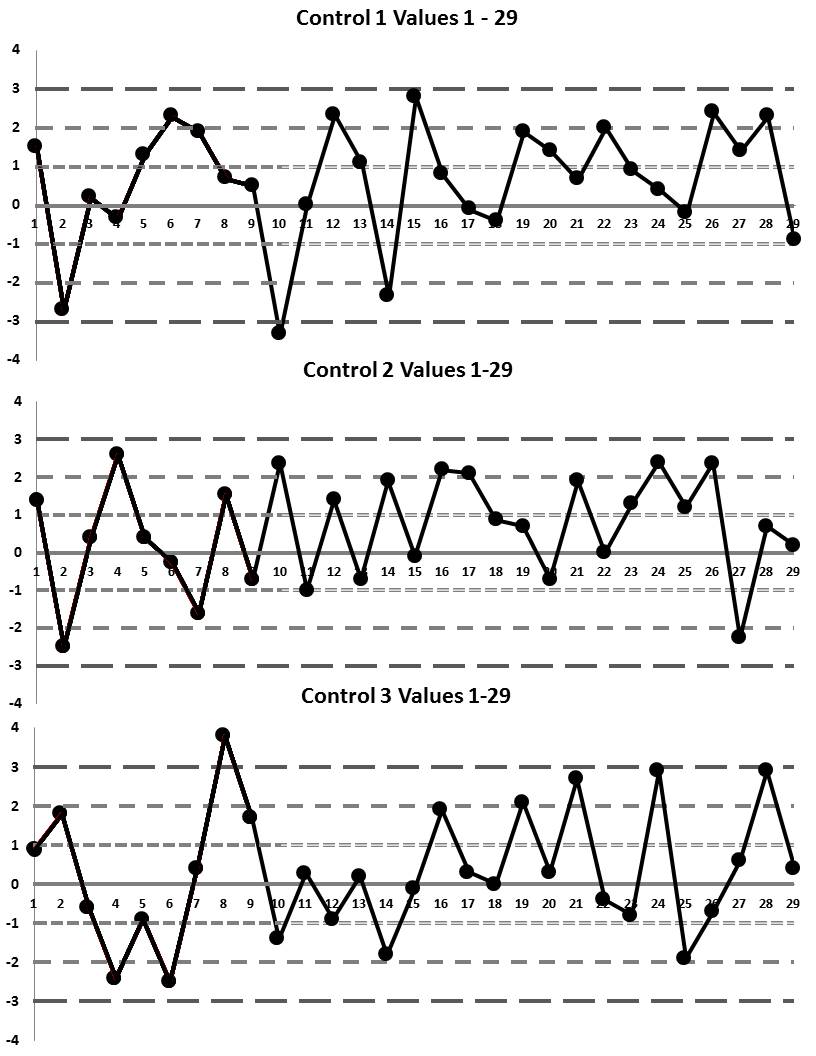
To make it a little easier to understand this data, here are the Levey-Jennings charts for these first 29 values (notice for each control, not only is the raw value given, but the z-score is shown as well - that's really useful):
|
Values |
Control 1 |
1-z |
Control 2 |
2-z |
Control 3 |
3 -z |
RULE |
|
Run 1 |
51.5 |
1.5 |
82.2 |
1.4 |
272.2 |
0.9 |
|
|
Run 2 |
38.9 |
-2.7 |
51 |
-2.5 |
288.4 |
1.8 |
|
|
Run 3 |
47.6 |
0.2 |
74.2 |
0.4 |
245.2 |
-0.6 |
|
|
Run 4 |
46 |
-0.33333 |
91.8 |
2.6 |
212.8 |
-2.4 |
|
|
Run 5 |
50.9 |
1.3 |
74.2 |
0.4 |
239.8 |
-0.9 |
|
|
Run 6 |
53.9 |
2.3 |
69 |
-0.25 |
211 |
-2.5 |
|
|
Run 7 |
52.7 |
1.9 |
58.2 |
-1.6 |
263.2 |
0.4 |
|
|
Run 8 |
49.1 |
0.7 |
83.3 |
1.54 |
324.4 |
3.8 |
|
|
Run 9 |
48.5 |
0.5 |
65.4 |
-0.7 |
286.6 |
1.7 |
|
|
Run 10 |
37 |
-3.33 |
90 |
2.375 |
230.8 |
-1.4 |
|
|
Run 11 |
47 |
0 |
63 |
-1 |
261.0 |
0.28 |
|
|
Run 12 |
54 |
2.333333 |
82.2 |
1.4 |
239.8 |
-0.9 |
|
|
Run 13 |
50.3 |
1.1 |
65.4 |
-0.7 |
259.6 |
0.2 |
|
|
Run 14 |
40 |
-2.33333 |
86.2 |
1.9 |
223.6 |
-1.8 |
|
|
Run 15 |
55.4 |
2.8 |
70.2 |
-0.1 |
254.2 |
-0.1 |
|
|
Run 16 |
49.4 |
0.8 |
88.6 |
2.2 |
290.2 |
1.9 |
|
|
Run 17 |
46.7 |
-0.1 |
87.8 |
2.1 |
261.4 |
0.3 |
|
|
Run 18 |
45.8 |
-0.4 |
78 |
0.875 |
256.0 |
0.0 |
|
|
Run 19 |
52.7 |
1.9 |
76.6 |
0.7 |
293.8 |
2.1 |
|
|
Run 20 |
51.2 |
1.4 |
65.4 |
-0.7 |
261.4 |
0.3 |
|
|
Run 21 |
49 |
0.667 |
86.2 |
1.9 |
304.6 |
2.7 |
|
|
Run 22 |
53 |
2 |
71 |
0 |
248.8 |
-0.4 |
|
|
Run 23 |
49.7 |
0.9 |
81.4 |
1.3 |
241.6 |
-0.8 |
|
|
Run 24 |
48.2 |
0.4 |
90.2 |
2.4 |
308.2 |
2.9 |
|
|
Run 25 |
46.4 |
-0.2 |
80.6 |
1.2 |
221.8 |
-1.9 |
|
|
Run 26 |
54.2 |
2.4 |
90 |
2.375 |
243.4 |
-0.7 |
|
|
Run 27 |
51.2 |
1.4 |
53 |
-2.25 |
266.8 |
0.6 |
|
|
Run 28 |
53.9 |
2.3 |
76.6 |
0.7 |
308.2 |
2.9 |
|
|
Run 29 |
44.3 |
-0.9 |
72.6 |
0.2 |
263.2 |
0.4 |
If the table is too hard to work with, here are the three Levey-Jennings charts (click on the graph to enlarge the figures):
Here is the second table of QC values for runs 30 through 59:
|
Values |
Control 1 |
1-z |
Control 2 |
2-z |
Control 3 |
3-z |
Rule Broken? |
|
30 |
48.5 |
0.5 |
84.6 |
1.7 |
279.4 |
1.3 |
|
|
31 |
48.8 |
0.6 |
79.8 |
1.1 |
254.2 |
-0.1 |
|
|
32 |
46.7 |
-0.1 |
82.2 |
1.4 |
250.6 |
-0.3 |
|
|
33 |
46.1 |
-0.3 |
83.8 |
1.6 |
265 |
0.5 |
|
|
34 |
49.7 |
0.9 |
72.6 |
0.2 |
279.4 |
1.3 |
|
|
35 |
53.9 |
2.3 |
63.8 |
-0.9 |
286.6 |
1.7 |
|
|
36 |
52.1 |
1.7 |
60.6 |
-1.3 |
284.8 |
1.6 |
|
|
37 |
48.2 |
0.4 |
62.2 |
-1.1 |
245.8 |
-0.6 |
|
|
38 |
52.1 |
1.7 |
71 |
0 |
286.6 |
1.7 |
|
|
39 |
50.6 |
1.2 |
69.4 |
-0.2 |
261.4 |
0.3 |
|
|
40 |
50.3 |
1.1 |
64.6 |
-0.8 |
245.2 |
-0.6 |
|
|
41 |
44.3 |
-0.9 |
87.8 |
2.1 |
263.2 |
0.4 |
|
|
42 |
51.8 |
1.6 |
79.8 |
1.1 |
281.2 |
1.4 |
|
|
43 |
41.9 |
-1.7 |
64.6 |
-0.8 |
284.8 |
1.6 |
|
|
44 |
49.4 |
0.8 |
63.8 |
-0.9 |
261.4 |
0.3 |
|
|
45 |
48.8 |
0.6 |
75.8 |
0.6 |
241.6 |
-0.8 |
|
|
46 |
49.9 |
0.97 |
66.2 |
-0.6 |
263.2 |
0.4 |
|
|
47 |
52.4 |
1.8 |
71 |
0 |
293.8 |
2.1 |
|
|
48 |
52.7 |
1.9 |
82.2 |
1.4 |
248.8 |
-0.4 |
|
|
49 |
49.1 |
0.7 |
56.6 |
-1.8 |
223.6 |
-1.8 |
|
|
50 |
44 |
-1 |
66.2 |
-0.6 |
229 |
-1.5 |
|
|
51 |
48.8 |
0.6 |
82.2 |
1.4 |
247 |
-0.5 |
|
|
52 |
50.6 |
1.2 |
77.4 |
0.8 |
266.8 |
0.6 |
|
|
53 |
43.7 |
-1.1 |
78.2 |
0.9 |
290.2 |
1.9 |
|
|
54 |
47.6 |
0.2 |
75 |
0.5 |
281.2 |
1.4 |
|
|
55 |
45.5 |
-0.5 |
85.4 |
1.8 |
245.2 |
-0.6 |
|
|
56 |
44.3 |
-0.9 |
86.2 |
1.9 |
261.4 |
0.3 |
|
|
57 |
52.4 |
1.8 |
55.8 |
-1.9 |
221.8 |
-1.9 |
|
|
58 |
53.9 |
2.3 |
65.4 |
-0.7 |
277.6 |
1.2 |
|
|
59 |
45.2 |
-0.6 |
83.8 |
1.6 |
284.8 |
1.6 |
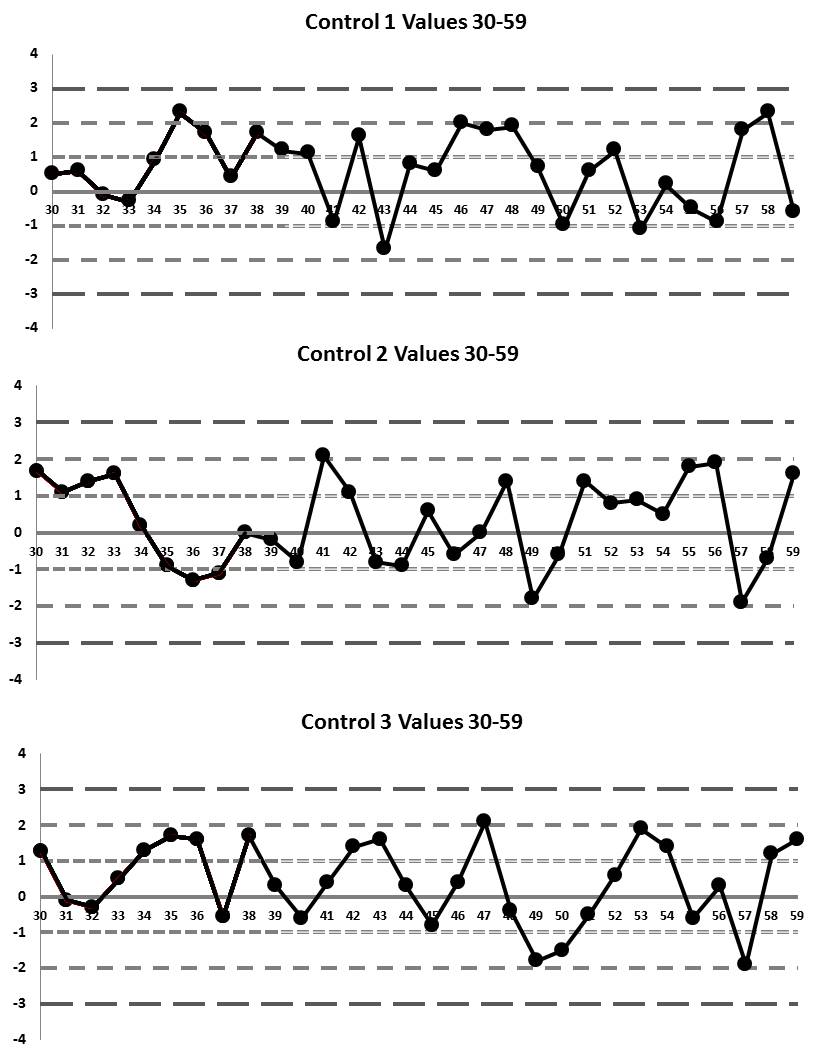
And now the Levey-Jennings charts for runs 3 through 59:
Next, we're ready to see the table of data for runs 60 through 89:
|
Values |
Control 1 |
z 1 |
Control 2 |
Z 2 |
Control 3 |
z 3 |
Rule |
|
60 |
45.8 |
-0.4 |
74.2 |
0.4 |
277.6 |
1.2 |
|
|
61 |
50.6 |
1.2 |
64.6 |
-0.8 |
284.8 |
1.6 |
|
|
62 |
48 |
0.3 |
83 |
1.5 |
266.8 |
0.6 |
|
|
63 |
49 |
0.7 |
83 |
1.5 |
259.6 |
0.2 |
|
|
64 |
46 |
-0.3 |
67.1 |
-0.49 |
260.1 |
0.23 |
|
|
65 |
53 |
2.0 |
74.2 |
0.4 |
281.2 |
1.4 |
|
|
66 |
48 |
0.3 |
80.6 |
1.2 |
241.6 |
-0.8 |
|
|
67 |
45.8 |
-0.4 |
71.8 |
0.1 |
272.2 |
0.9 |
|
|
68 |
48.2 |
0.4 |
69.4 |
-0.2 |
288.4 |
1.8 |
|
|
69 |
50.9 |
1.3 |
81.4 |
1.3 |
250.6 |
-0.3 |
|
|
70 |
48.2 |
0.4 |
65.4 |
-0.7 |
277.6 |
1.2 |
|
|
71 |
51.2 |
1.4 |
70 |
-0.125 |
221.8 |
-1.9 |
|
|
72 |
49.1 |
0.7 |
69 |
-0.25 |
263.2 |
0.4 |
|
|
73 |
51.5 |
1.5 |
66 |
-0.625 |
247 |
-0.5 |
|
|
74 |
47.9 |
0.3 |
68.6 |
-0.3 |
254.2 |
-0.1 |
|
|
75 |
48.5 |
0.5 |
86.2 |
1.9 |
261.4 |
0.3 |
|
|
76 |
50.9 |
1.3 |
59.8 |
-1.4 |
266.8 |
0.6 |
|
|
77 |
46.7 |
-0.1 |
67.8 |
-0.4 |
252.4 |
-0.2 |
|
|
78 |
47.8 |
0.3 |
86.2 |
1.9 |
236.2 |
-1.1 |
|
|
79 |
45.5 |
-0.5 |
72.6 |
0.2 |
250.6 |
-0.3 |
|
|
80 |
52 |
1.7 |
81.4 |
1.3 |
259.6 |
0.2 |
|
|
81 |
52 |
1.7 |
74.2 |
0.4 |
243.4 |
-0.7 |
|
|
82 |
48.5 |
0.5 |
80.6 |
1.2 |
275.8 |
1.1 |
|
|
83 |
44.3 |
-0.9 |
79.8 |
1.1 |
281.2 |
1.4 |
|
|
84 |
49.4 |
0.8 |
75 |
0.5 |
252.4 |
-0.2 |
|
|
85 |
46.7 |
-0.1 |
76.6 |
0.7 |
272.2 |
0.9 |
|
|
86 |
52.7 |
1.9 |
72.6 |
0.2 |
281.2 |
1.4 |
|
|
87 |
45.2 |
-0.6 |
55.8 |
-1.9 |
275.8 |
1.1 |
|
|
88 |
48.8 |
0.6 |
79 |
1 |
256 |
0 |
|
|
89 |
46.4 |
-0.2 |
70.2 |
-0.1 |
236.2 |
-1.1 |
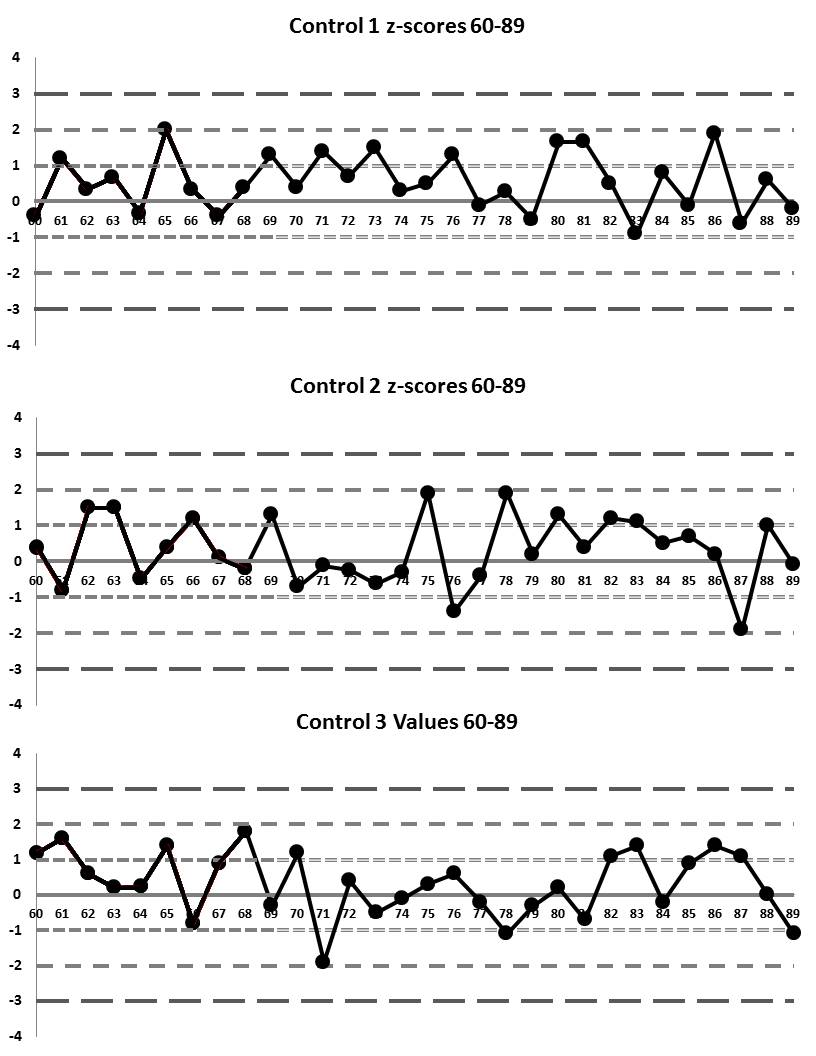
Now there are some Levey-Jennings charts for those runs 60 through 89:
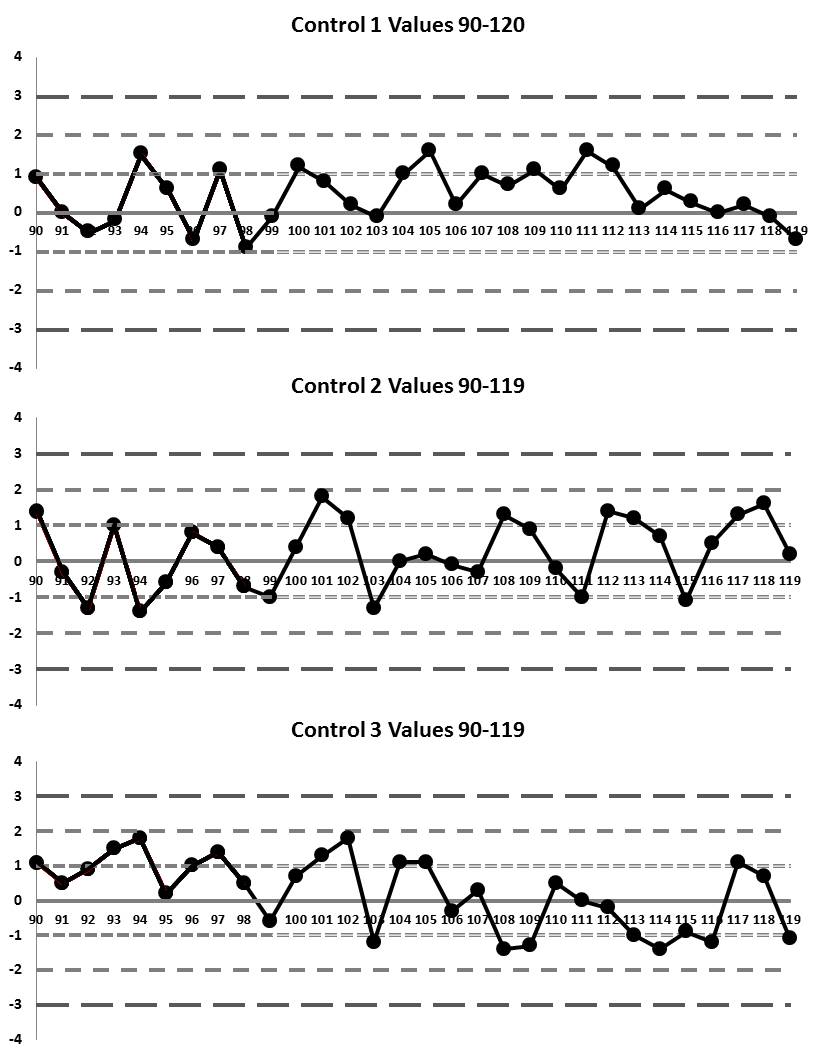
Now the data table for runs 90 through 119:
|
Values |
Control 1 |
Z 1 |
Control 2 |
Z 2 |
Control 3 |
Z 3 |
Rules |
|
90 |
49.7 |
0.9 |
82.2 |
1.4 |
275.8 |
1.1 |
|
|
91 |
47 |
0 |
68.6 |
-0.3 |
265 |
0.5 |
|
|
92 |
45.5 |
-0.5 |
60.6 |
-1.3 |
272.2 |
0.9 |
|
|
93 |
46.4 |
-0.2 |
79 |
1 |
283 |
1.5 |
|
|
94 |
51.5 |
1.5 |
59.8 |
-1.4 |
288.4 |
1.8 |
|
|
95 |
48.8 |
0.6 |
66.2 |
-0.6 |
259.6 |
0.2 |
|
|
96 |
44.9 |
-0.7 |
77.4 |
0.8 |
274 |
1 |
|
|
97 |
50.3 |
1.1 |
74.2 |
0.4 |
281.2 |
1.4 |
|
|
98 |
44.3 |
-0.9 |
65.4 |
-0.7 |
265 |
0.5 |
|
|
99 |
46.7 |
-0.1 |
63 |
-1 |
245.2 |
-0.6 |
|
|
100 |
50.6 |
1.2 |
74.2 |
0.4 |
268.6 |
0.7 |
|
|
101 |
49.4 |
0.8 |
85.4 |
1.8 |
279.4 |
1.3 |
|
|
102 |
47.6 |
0.2 |
80.6 |
1.2 |
288.4 |
1.8 |
|
|
103 |
46.7 |
-0.1 |
60.6 |
-1.3 |
234.4 |
-1.2 |
|
|
104 |
50 |
1 |
71 |
0 |
275.8 |
1.1 |
|
|
105 |
51.8 |
1.6 |
72.6 |
0.2 |
275.8 |
1.1 |
|
|
106 |
47.6 |
0.2 |
70.2 |
-0.1 |
250.6 |
-0.3 |
|
|
107 |
50 |
1 |
68.6 |
-0.3 |
261.4 |
0.3 |
|
|
108 |
49.1 |
0.7 |
81.4 |
1.3 |
230.8 |
-1.4 |
|
|
109 |
50.3 |
1.1 |
78.2 |
0.9 |
232.6 |
-1.3 |
|
|
110 |
48.8 |
0.6 |
69.4 |
-0.2 |
265 |
0.5 |
|
|
111 |
51.8 |
1.6 |
63 |
-1 |
256 |
0 |
|
|
112 |
50.6 |
1.2 |
82.2 |
1.4 |
252.4 |
-0.2 |
|
|
113 |
47.3 |
0.1 |
80.6 |
1.2 |
238 |
-1 |
|
|
114 |
48.8 |
0.6 |
76.6 |
0.7 |
230.8 |
-1.4 |
|
|
115 |
47.8 |
0.3 |
62.2 |
-1.1 |
239.8 |
-0.9 |
|
|
116 |
47 |
0 |
75 |
0.5 |
234.4 |
-1.2 |
|
|
117 |
47.6 |
0.2 |
81.4 |
1.3 |
275.8 |
1.1 |
|
|
118 |
46.7 |
-0.1 |
83.8 |
1.6 |
268.6 |
0.7 |
|
|
119 |
44.9 |
-0.7 |
72.6 |
0.2 |
236.2 |
-1.1 |
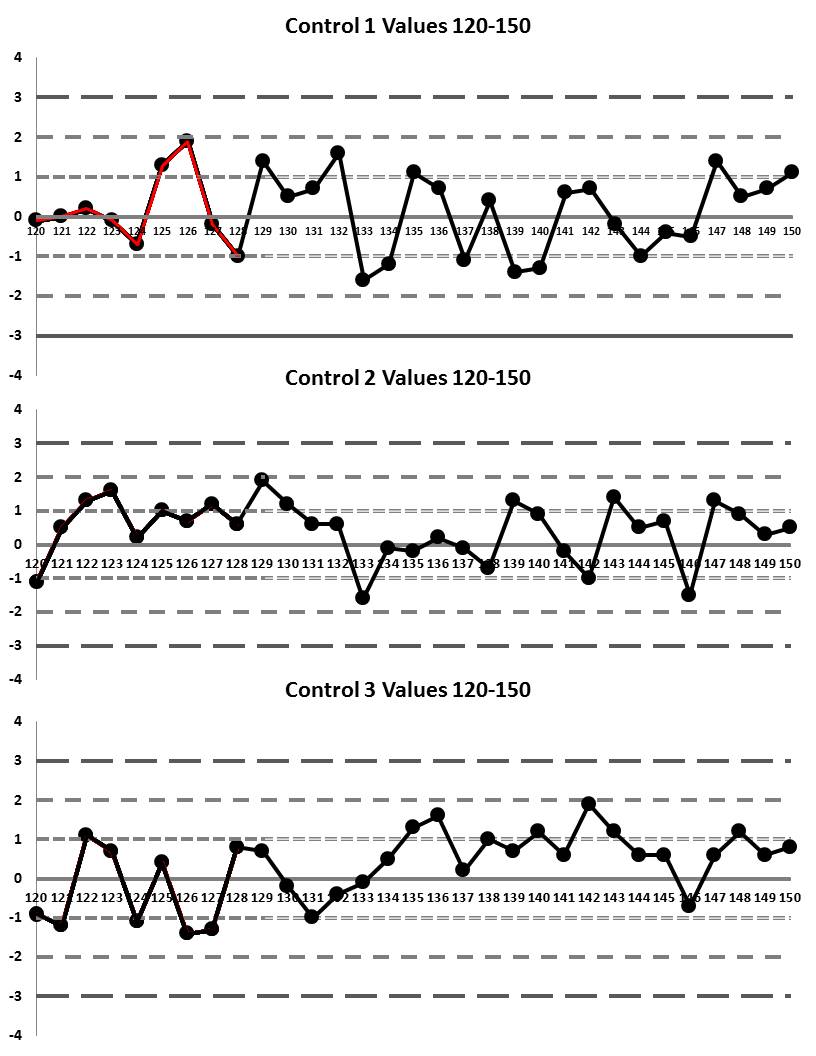
Here's our final table of data, with values 120 through 150. We're just looking for the 12:x violation now:
|
Values |
Control 1 |
Z 1 |
Control 2 |
Z 2 |
Control 3 |
Z 3 |
Rules |
|
120 |
46.7 |
-0.1 |
62.2 |
-1.1 |
239.8 |
-0.9 |
|
|
121 |
47 |
0 |
75 |
0.5 |
234.4 |
-1.2 |
|
|
122 |
47.6 |
0.2 |
81.4 |
1.3 |
275.8 |
1.1 |
|
|
123 |
46.7 |
-0.1 |
83.8 |
1.6 |
268.6 |
0.7 |
|
|
124 |
44.9 |
-0.7 |
72.6 |
0.2 |
236.2 |
-1.1 |
|
|
125 |
50.9 |
1.3 |
79 |
1 |
263.2 |
0.4 |
|
|
126 |
52.7 |
1.9 |
76.6 |
0.7 |
230.8 |
-1.4 |
|
|
127 |
46.4 |
-0.2 |
80.6 |
1.2 |
232.6 |
-1.3 |
|
|
128 |
44 |
-1 |
75.8 |
0.6 |
270.4 |
0.8 |
|
|
129 |
51.2 |
1.4 |
86.2 |
1.9 |
268.6 |
0.7 |
|
|
130 |
48.5 |
0.5 |
80.6 |
1.2 |
252.4 |
-0.2 |
|
|
131 |
49.1 |
0.7 |
75.8 |
0.6 |
238 |
-1 |
|
|
132 |
51.8 |
1.6 |
75.8 |
0.6 |
248.8 |
-0.4 |
|
|
133 |
42.2 |
-1.6 |
58.2 |
-1.6 |
254.2 |
-0.1 |
|
|
134 |
43.4 |
-1.2 |
70.2 |
-0.1 |
265 |
0.5 |
|
|
135 |
50.3 |
1.1 |
69.4 |
-0.2 |
279.4 |
1.3 |
|
|
136 |
49.1 |
0.7 |
72.6 |
0.2 |
284.8 |
1.6 |
|
|
137 |
43.7 |
-1.1 |
70.2 |
-0.1 |
259.6 |
0.2 |
|
|
138 |
48.2 |
0.4 |
65.4 |
-0.7 |
274 |
1 |
|
|
139 |
42.8 |
-1.4 |
81.4 |
1.3 |
268.6 |
0.7 |
|
|
140 |
43.1 |
-1.3 |
78.2 |
0.9 |
277.6 |
1.2 |
|
|
141 |
48.8 |
0.6 |
69.4 |
-0.2 |
266.8 |
0.6 |
|
|
142 |
49.1 |
0.7 |
63 |
-1 |
290.2 |
1.9 |
|
|
143 |
46.4 |
-0.2 |
82.2 |
1.4 |
277.6 |
1.2 |
|
|
144 |
44 |
-1 |
75 |
0.5 |
266.8 |
0.6 |
|
|
145 |
45.8 |
-0.4 |
76.6 |
0.7 |
266.8 |
0.6 |
|
|
146 |
45.5 |
-0.5 |
59 |
-1.5 |
243.4 |
-0.7 |
|
|
147 |
51.2 |
1.4 |
81.4 |
1.3 |
266.8 |
0.6 |
|
|
148 |
48.5 |
0.5 |
78.2 |
0.9 |
277.6 |
1.2 |
|
|
149 |
49.1 |
0.7 |
73.4 |
0.3 |
266.8 |
0.6 |
|
|
150 |
50.3 |
1.1 |
75 |
0.5 |
270.4 |
0.8 |
Here are our last graphs of those runs:
That should be enough data to keep you out of trouble. And the number of outliers you find in this dataset should be equivalent to a year's worth of outliers that you see normally in your own lab data.
Finally, I'm going to add the following conditions:
- We are running THREE controls per run; assume each trio of values represents one run
- We're NOT going to look for 2s violations. Let's break that habit right now. In any case, I didn't generate these data points randomly, so we should not expect to see a certain number of "natural false rejections" in the form of 2s outliers
- We ARE going to try to find outliers of the following "Westgard Rules": 1:3s/2of3:2s/R:4s/3:1s/6:x (and later in the exercise, we switch to 9:x and12:x)
- We're NOT going to sink into the swamp that is the repeating of controls. So don't assume anything you see is a repeated control - just stick with "in" or "out"
So, at the end of this, can you answer the following questions?
- How many rule violations were there?
- Which rules were violated and how many times?
- What would be different if I told you that only the "Westgard Rules" 1:3s/2of3:2s/R:4s were necessary?
- What would be different if I told you that only the 1:3s control rule was necessary?
These answers, and more, in a few weeks...
[Don't submit this exercise for grading. You'll get to compare your answers to the answer set in a few weeks. But feel free to share this with your colleagues and see if you can all reach the same conclusions and interpretations.]