Basic QC Practices
A Downside of Negative Controls for SARS-COV-2 Testing?
Fighting the pandemic is hard enough. Do we have to struggle with the QC on negative controls for SARS-COV-2 assays too?
A Downside of Negative Controls for SARS-COV-2 Testing?
Sten Westgard, MS
September 2021
No matter how challenging the crisis, laboratory regulations demand that you must still run QC on your tests. Even an EUA'd serology method must still run QC.
A laboratory reached out to us recently for help with a crippling problem: they had multiple "Westgard Rule" failures on the negative control of their SARS-COV-2 antibody test. In the data submitted to us, out of 64 control measurements made in an approximately 5 week period, 51 of them were excluded (79.7%). The laboratory was applying the complete "Westgard Rules" and recording 28 QC violations (43.75%). Frankly, shocking.
For the purposes of this article, however, there is no need to blame a manufacturer, instrument, or reagent lot. The root cause for most of these struggles lies in the ranges and structure of the Levey-Jennings chart. This goes deeper than the use or misuse of "Westgard Rules." This is about the fundamentals of building a control chart.
We're going to take a look at around 60 data points from July and August of 2020.
First look: The "Target" Range
The Target mean is 0.399 and the Target SD is 0.2. Using those on the LJ chart, this is what we see (30 data points per chart).
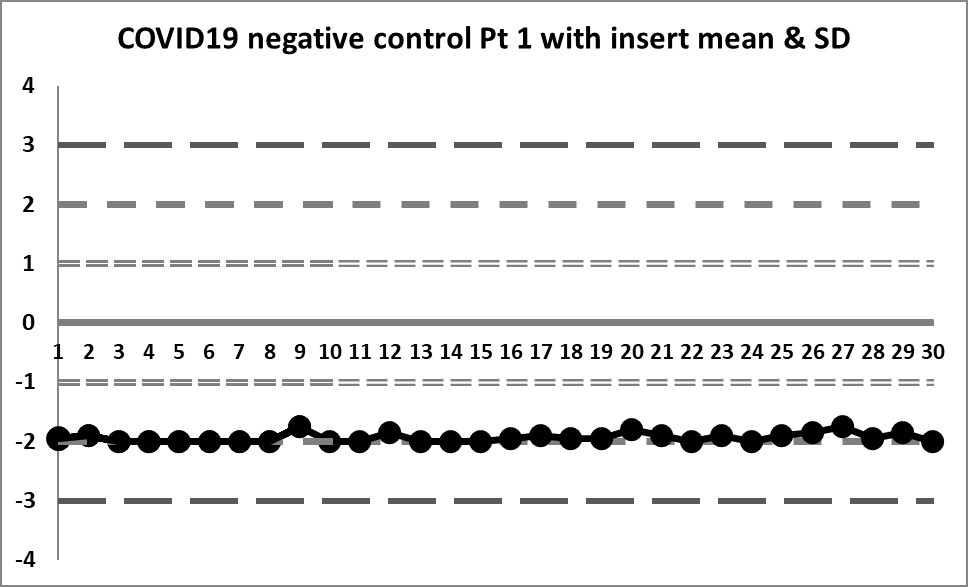
Pretty much this range is making this control chart look like a flatline. Are we sure this control is still alive? Because of the target mean, however, every data point is almost 2 SD below the mean, therefore any implementation of the complete "Westgard Rules" will trigger a constant stream of 1:4s and/or 10:x errors. There are just a very small number of points that fall on the mean and only one point above the mean.
Clearly this target range is not right and building the control chart this way is CAUSING errors, not catching them.
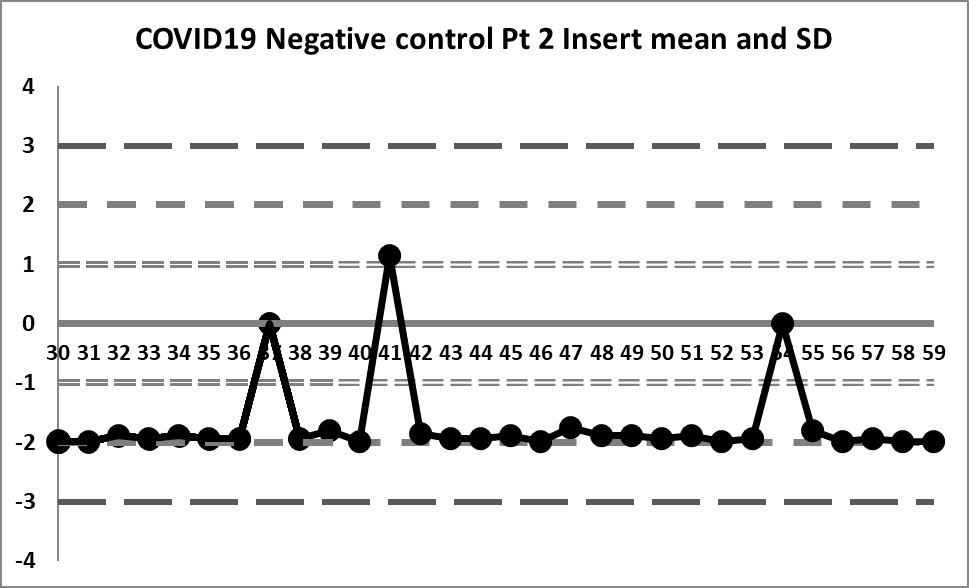
Second look: A calculated mean and SD
This next set of data is built on the actual performance of the laboratory. It generates a mean of 0.0785 and an SD of 0.143. It's a huge difference in mean, and a significant _increase_ in the imprecision CV. But it doesn't solve all our problems.
So some of the previous errors have been corrected - by centering the data on a calculated mean, the data isn't so far off, and the 4:1s rule is no longer being violated constantly. However, if the 10:x rule of the "Westgard Rules" is being implemented, that will still be going off all the time.
The previous three outliers are now more glaring in this new control chart, one of them being out more than 3 SD. When the target range was used, those three points were just above the mean, but not violating any rules. Now we see that the reverse is true. What previously looked like data points that were not a problem are in fact the _real_ problems of this data set.
However, looking at this data, it becomes clear that the three data points "above" the mean were included in the calculation of the mean and SD, therefore the calculations are still skewed incorrectly. Because the three data points fell "within" the target range, they weren't excluded from calculation of mean and SD. We need to exclude those outliers now and re-calculate.
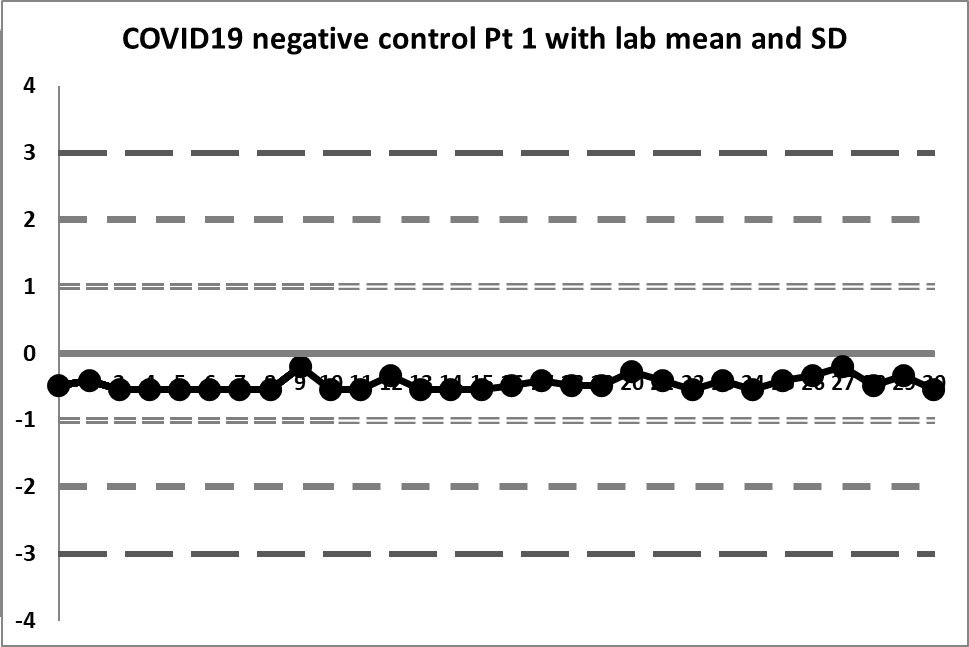
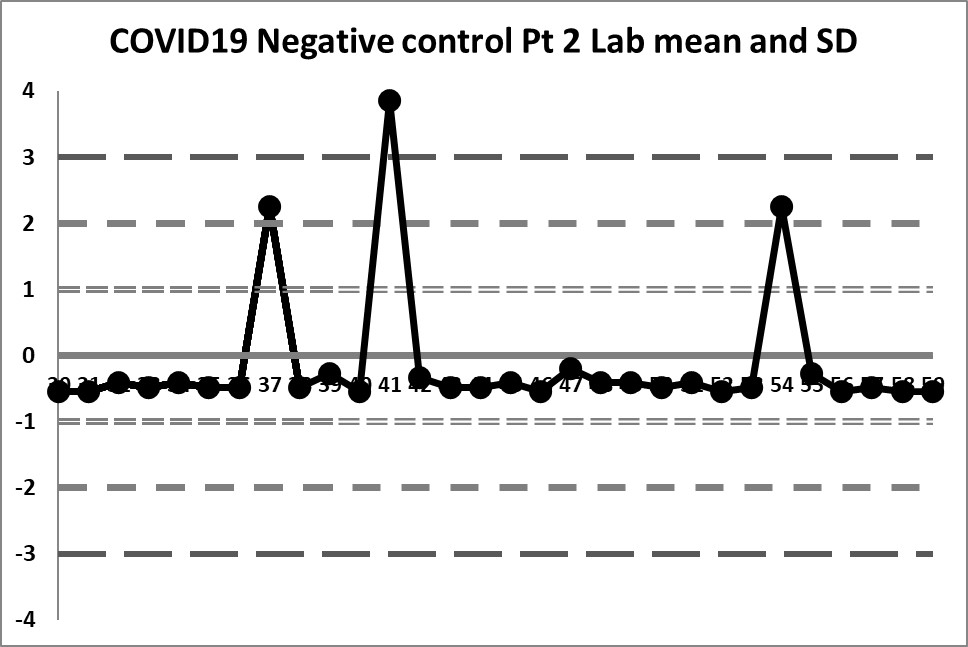
Final look: revised and corrected mean and SD
When the three extreme values are eliminated, we find a mean of 0.01293 and an SD of 0.014384
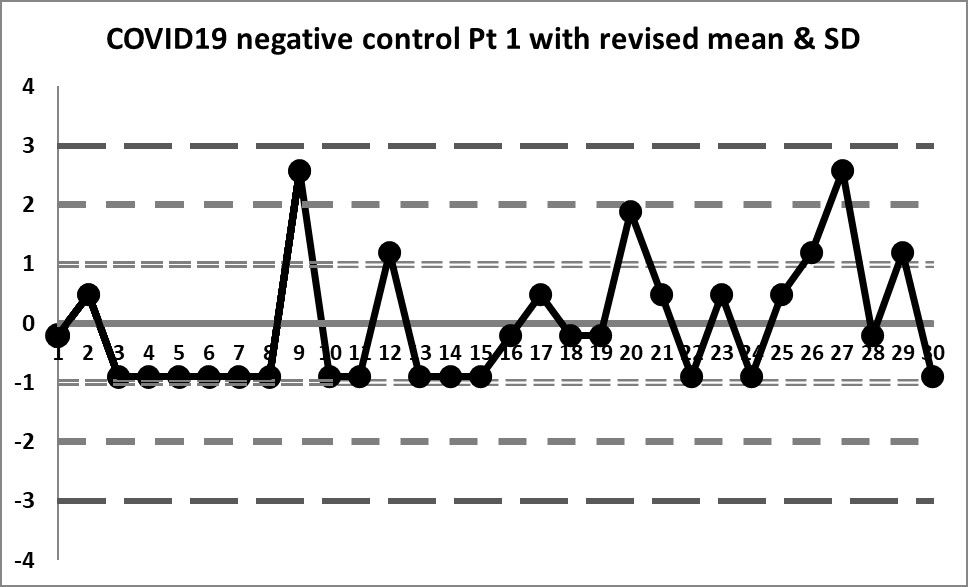
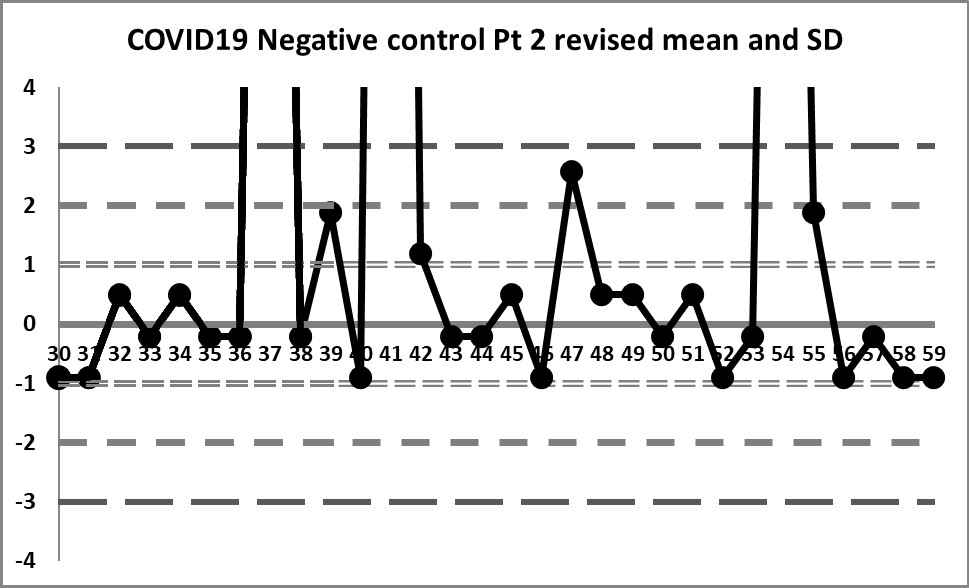
We're seeing something we haven't before: actual variation above and below the mean. In fact, there are no more 10:x rule violations (the closest we get is 6:x) or 4:1s violations. Also, the 3 outliers are now literally "off the chart", the values are so extreme.
Is any of this unique to SARS-COV-2 controls?
The problems in these charts are not caused by the novelty of new SARS-COV-2 antibody assays. The problems aren't even caused by the problem of a negative control in a serology context. Once you calculate the data correctly, you can see the variation that approaches normality and you can discern problems that are real and you aren't seeing problems that are simply self-generated.
This problem of the incorrect construction of Levey-Jennings charts happens not just with SARS-COV-2 assays, not just with serology assays, not just with negative controls. This is a "universal" problem across all testing areas. The temptation of a laboratory is to adopt the insert ranges or manufacturer- or vendor-supplied means and SDs. But failing to put in the work to determine your own mean and SD will bite you in the end - you will see errors that aren't real, and you will simultaneously be missing some errors that are real, but get lost in your ranges.
Labs have to do the work. There are countless recommendations in the regulations and guidance documents and international standards. They are there for a reason.
The good news is that QC can be saved on this assay - the assay itself has some outliers but doesn't appear to be systematically in error or plagued by random errors. Appropriate adjustments to QC will help the laboratory release appropriate results and prevent erroneous results from being released.
Taking the Question one step further: What rules are necessary for a negative control?
It's worth examining another assumption in this QC scenario. The laboratory believed that applying all the "Westgard Rules" was appropriate for the negative control. Was that correct?
As many regular readers know, the most modern version of multirule QC is called the "Westgard Sigma Rules", and adjusts the number of rules to the analytical Sigma-metric. In many cases with biochemistry and immunoassay tests, the full "Westgard Rules" are now overkill. Is the same true for SARS-COV-2 antibody tests, or, for that matter, serology assays in general?
The challenge with antibody testing and any tests that use a signal-to-cutoff ratio (S/CO) is that an allowable total error has not really been specified. It's hard to know how good you're doing if you don't even have an idea of the target to hit.
In the crudest sense, the negative control needs to stay away from 1.0. If you have a negative value that jumps above 1.0, that's a false positive. In some screening infectious disease applications, you might not mind a false positive, because you assume some type of confirmatory testing will catch and correct the issue. In our present circumstances, if you're testing "positive" for SARS-COV-2 antibodies when you actually have none, that's a rather scary problem.
If we take the mean of the negative control as 0.01293, the distance from the mean to the 1.0 is 0.987. You can set that as an allowable total error. The 1.0 is a huge number of SDs away. If we characterized this on the Six Sigma scale, this is performing better than 6 Sigma, and therefore only the 1:3s control rule would be needed to monitor the method, not all the "Westgard Rules". That would still catch those three extreme outliers but anything else in the data set would be considered insignificant.
This area of QC has been neglected for years. But it bears further scrutiny. Antibody, serology testing is overdue for a QC overhaul.