Basic QC Practices
The 2017 Great Global QC Survey Results
The 2017 Great Global QC Survey reached over 900 laboratory professionals from more than 105 countries. Learn what we discovered about the world's QC.
The Great Global QC Survey 2017
Sten Westgard, MS
June 2017
From April through June of 2017, Westgard QC conducted a survey that reached out to the more than 25,000 laboratory professionals that subscribe to the Westgard Web e-newsletter, as well more than 20,000 LinkedIn laboratory professionals that connect with the Westgards, to gather a comprehensive view of the Quality Control Practices of the world.
For a free copy of these graphs, go to our download section.
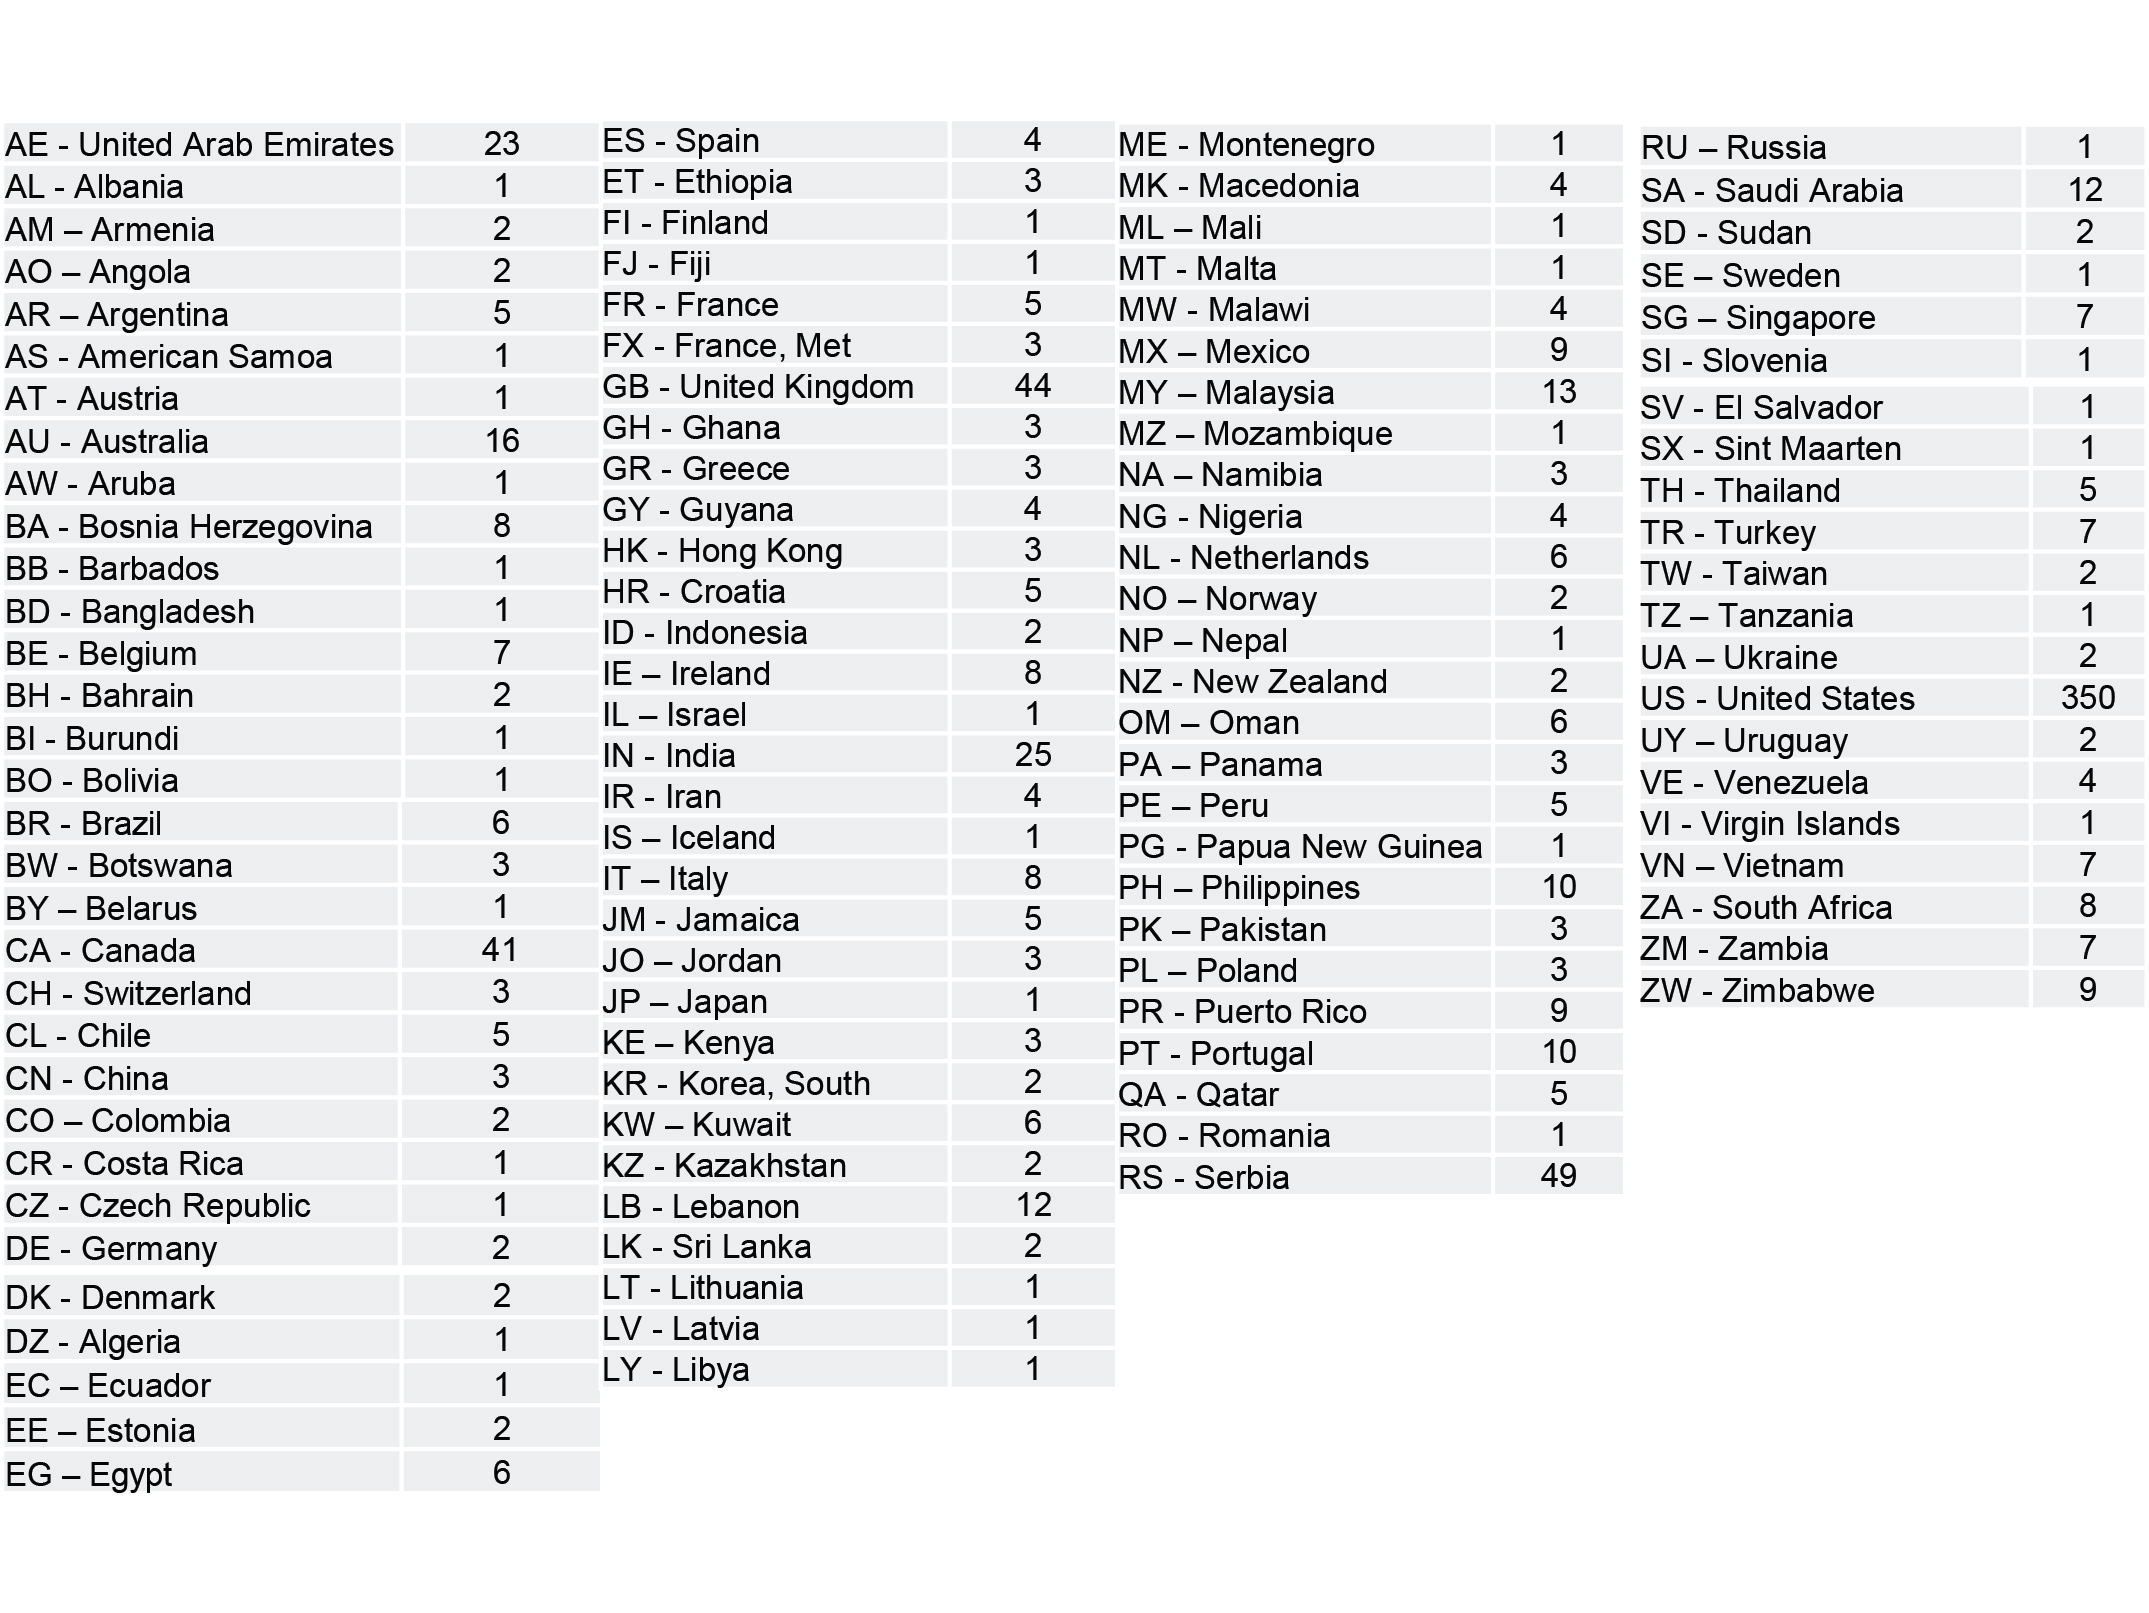
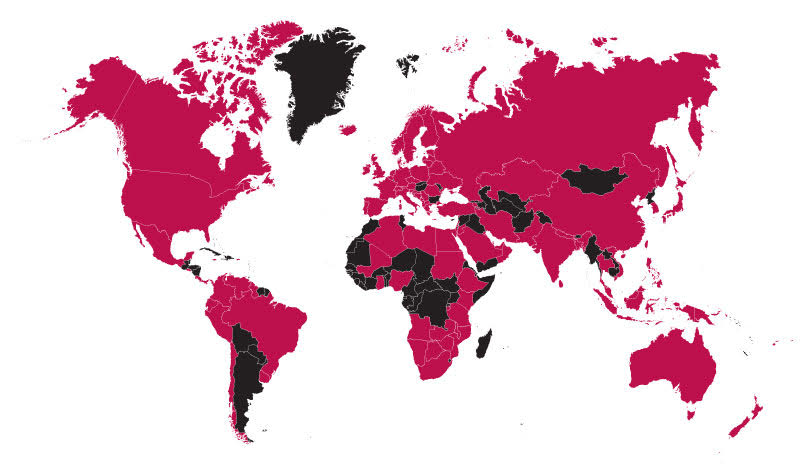
The majority of responses came from outside the US, but the US participation rate was just under 40%. The top countries who responded were the USA, Serbia, United Kingdom, Canada, and the United Arab Emirates. There's no way to claim this is a perfect statistical representation of all the world's laboratories, but it is one of the largest surveys that have been conducted and shared with the public.
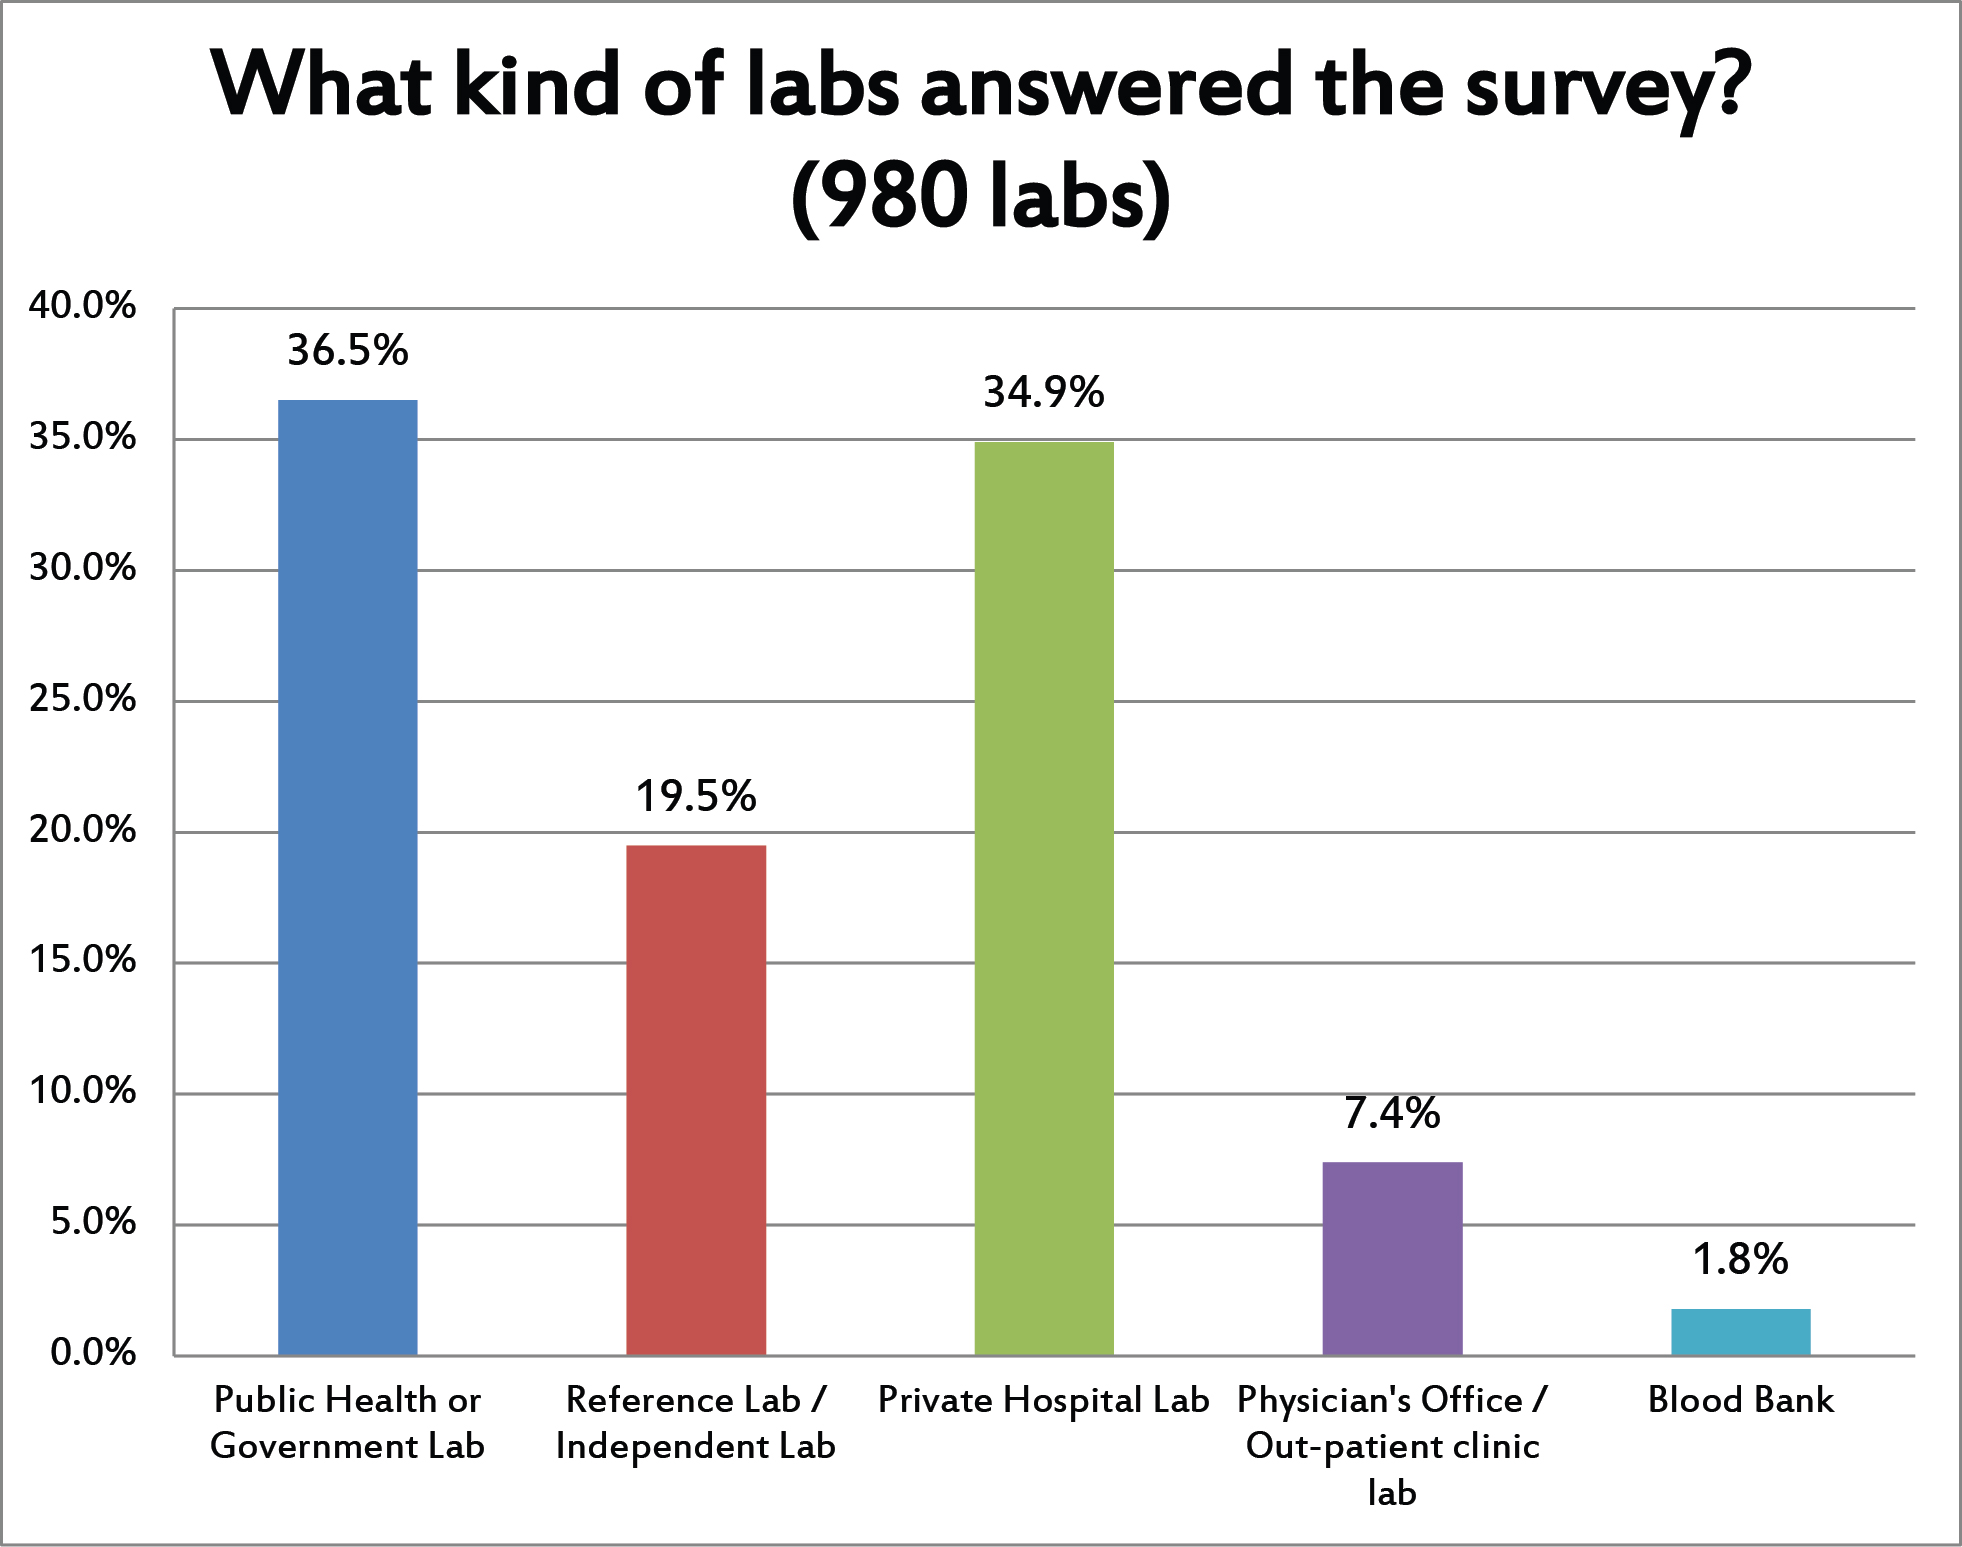
Most of the reponses came from public, government, or private hospital laboratories.
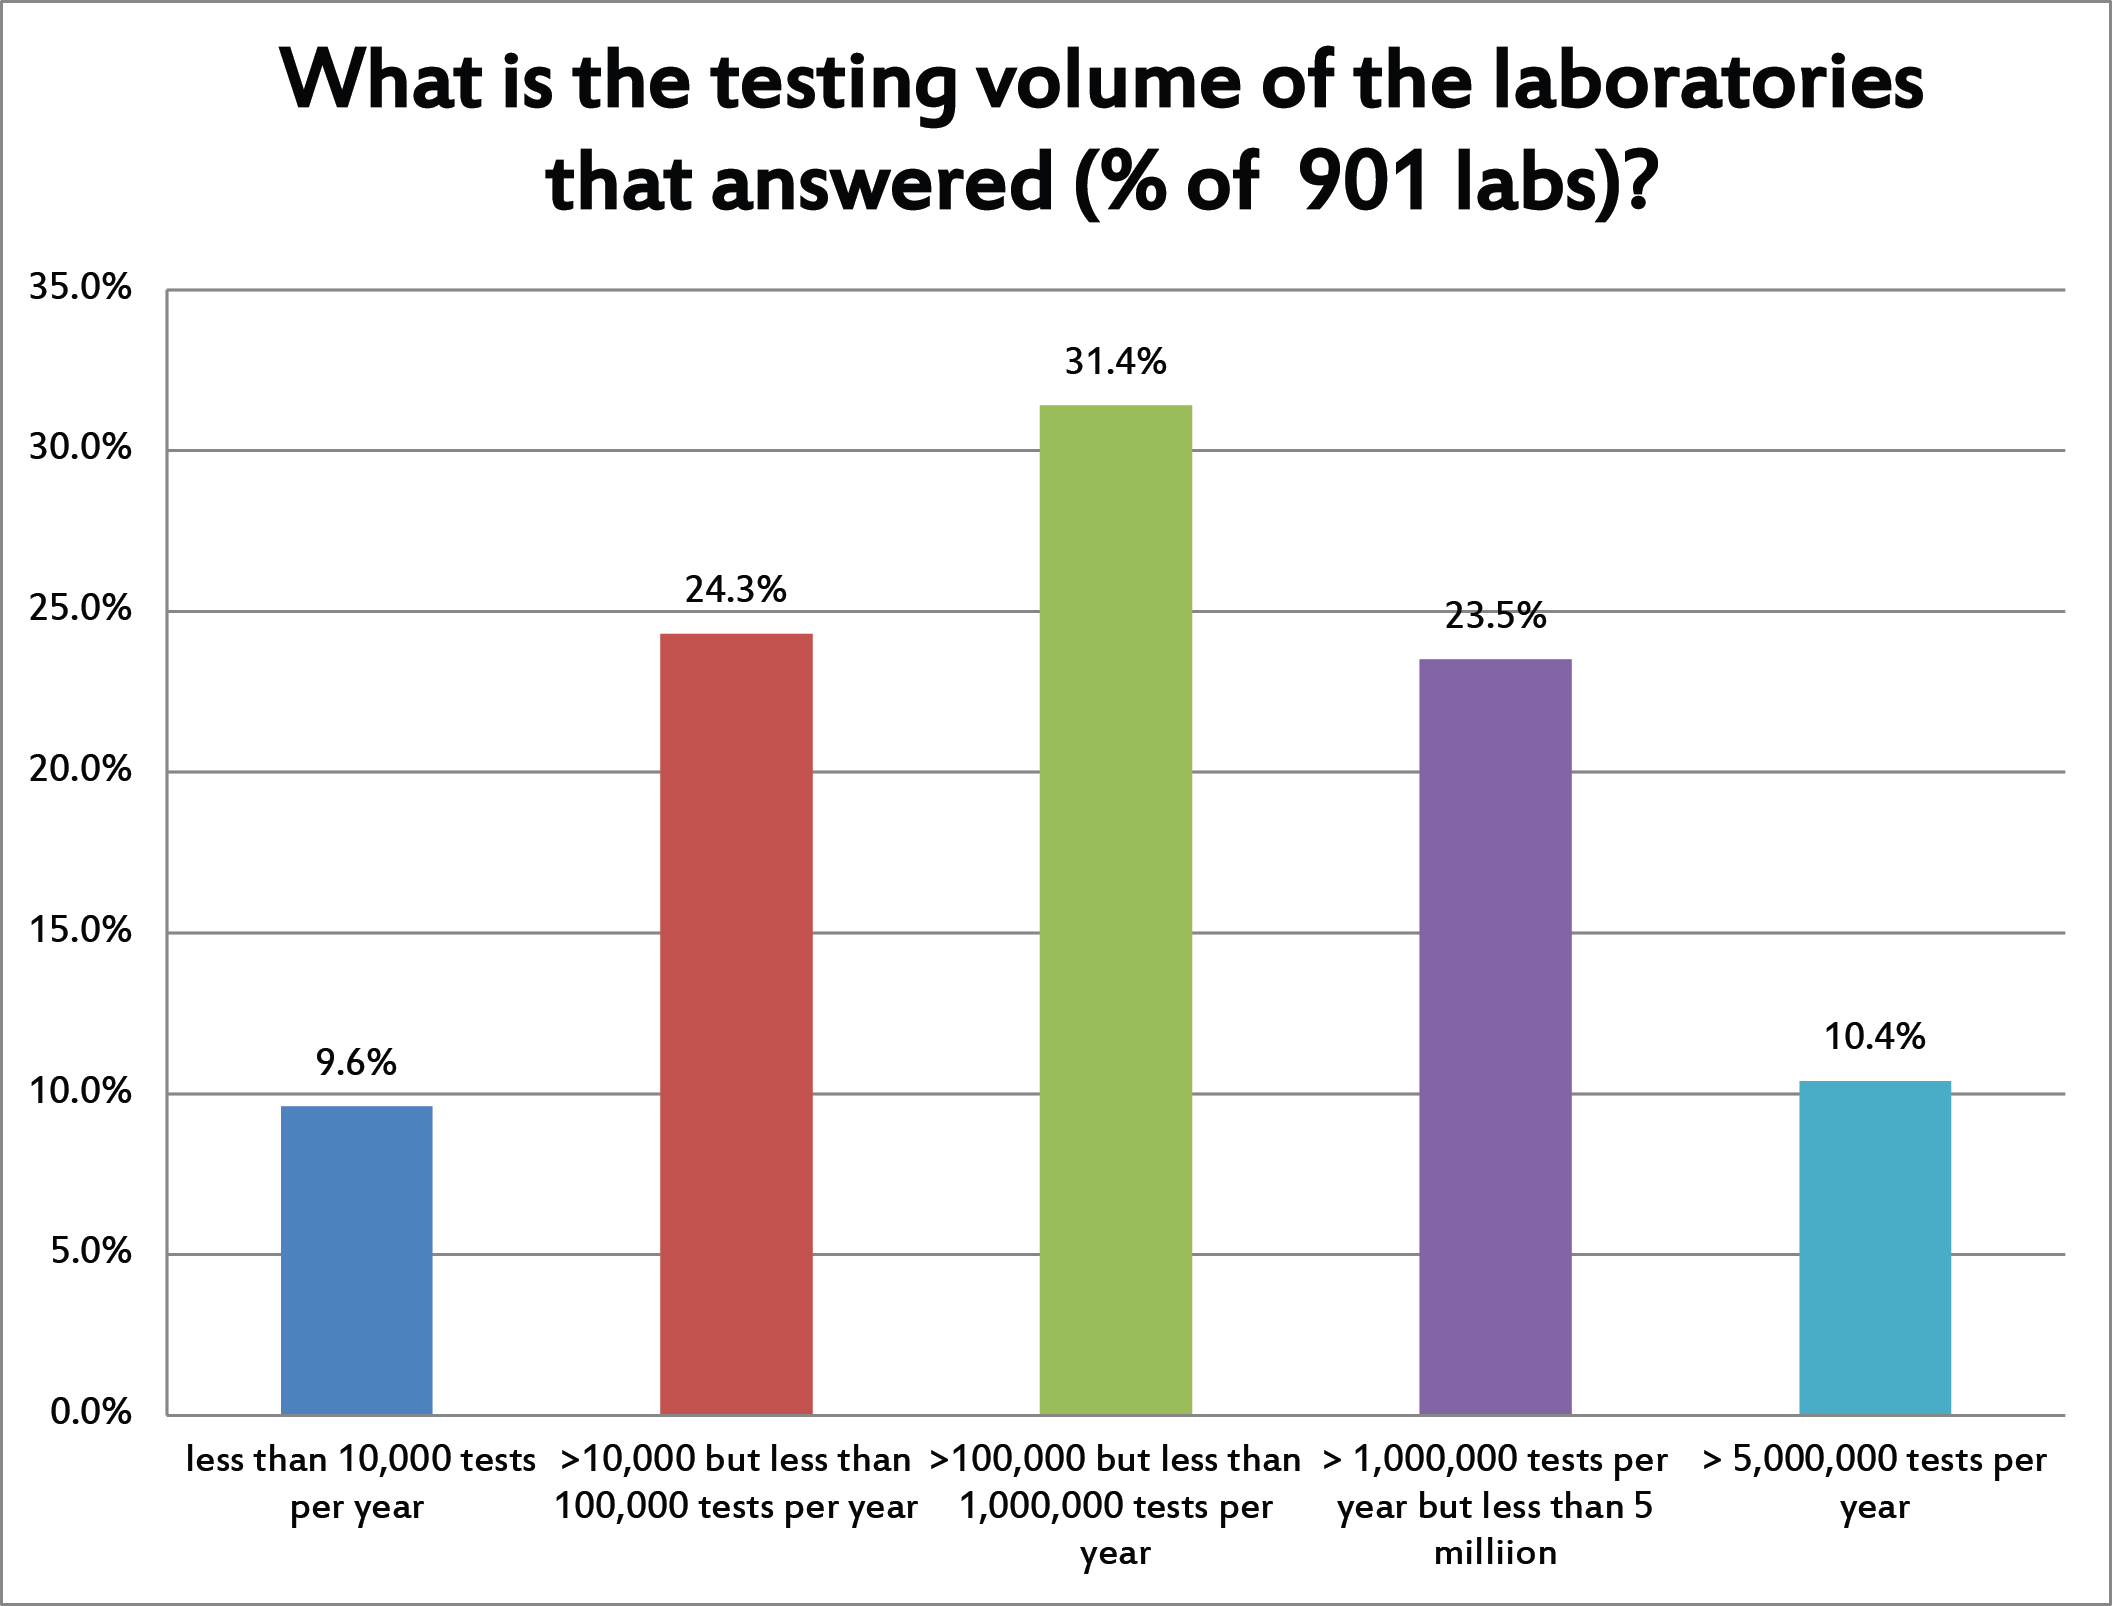
We had a nice distribution of laboratories in the survey responses. The most answers came from labs that were running more than 100,000 tests but less than 1 million tests per year. But a third of the labs were high volume and a third of the labs were low volume.
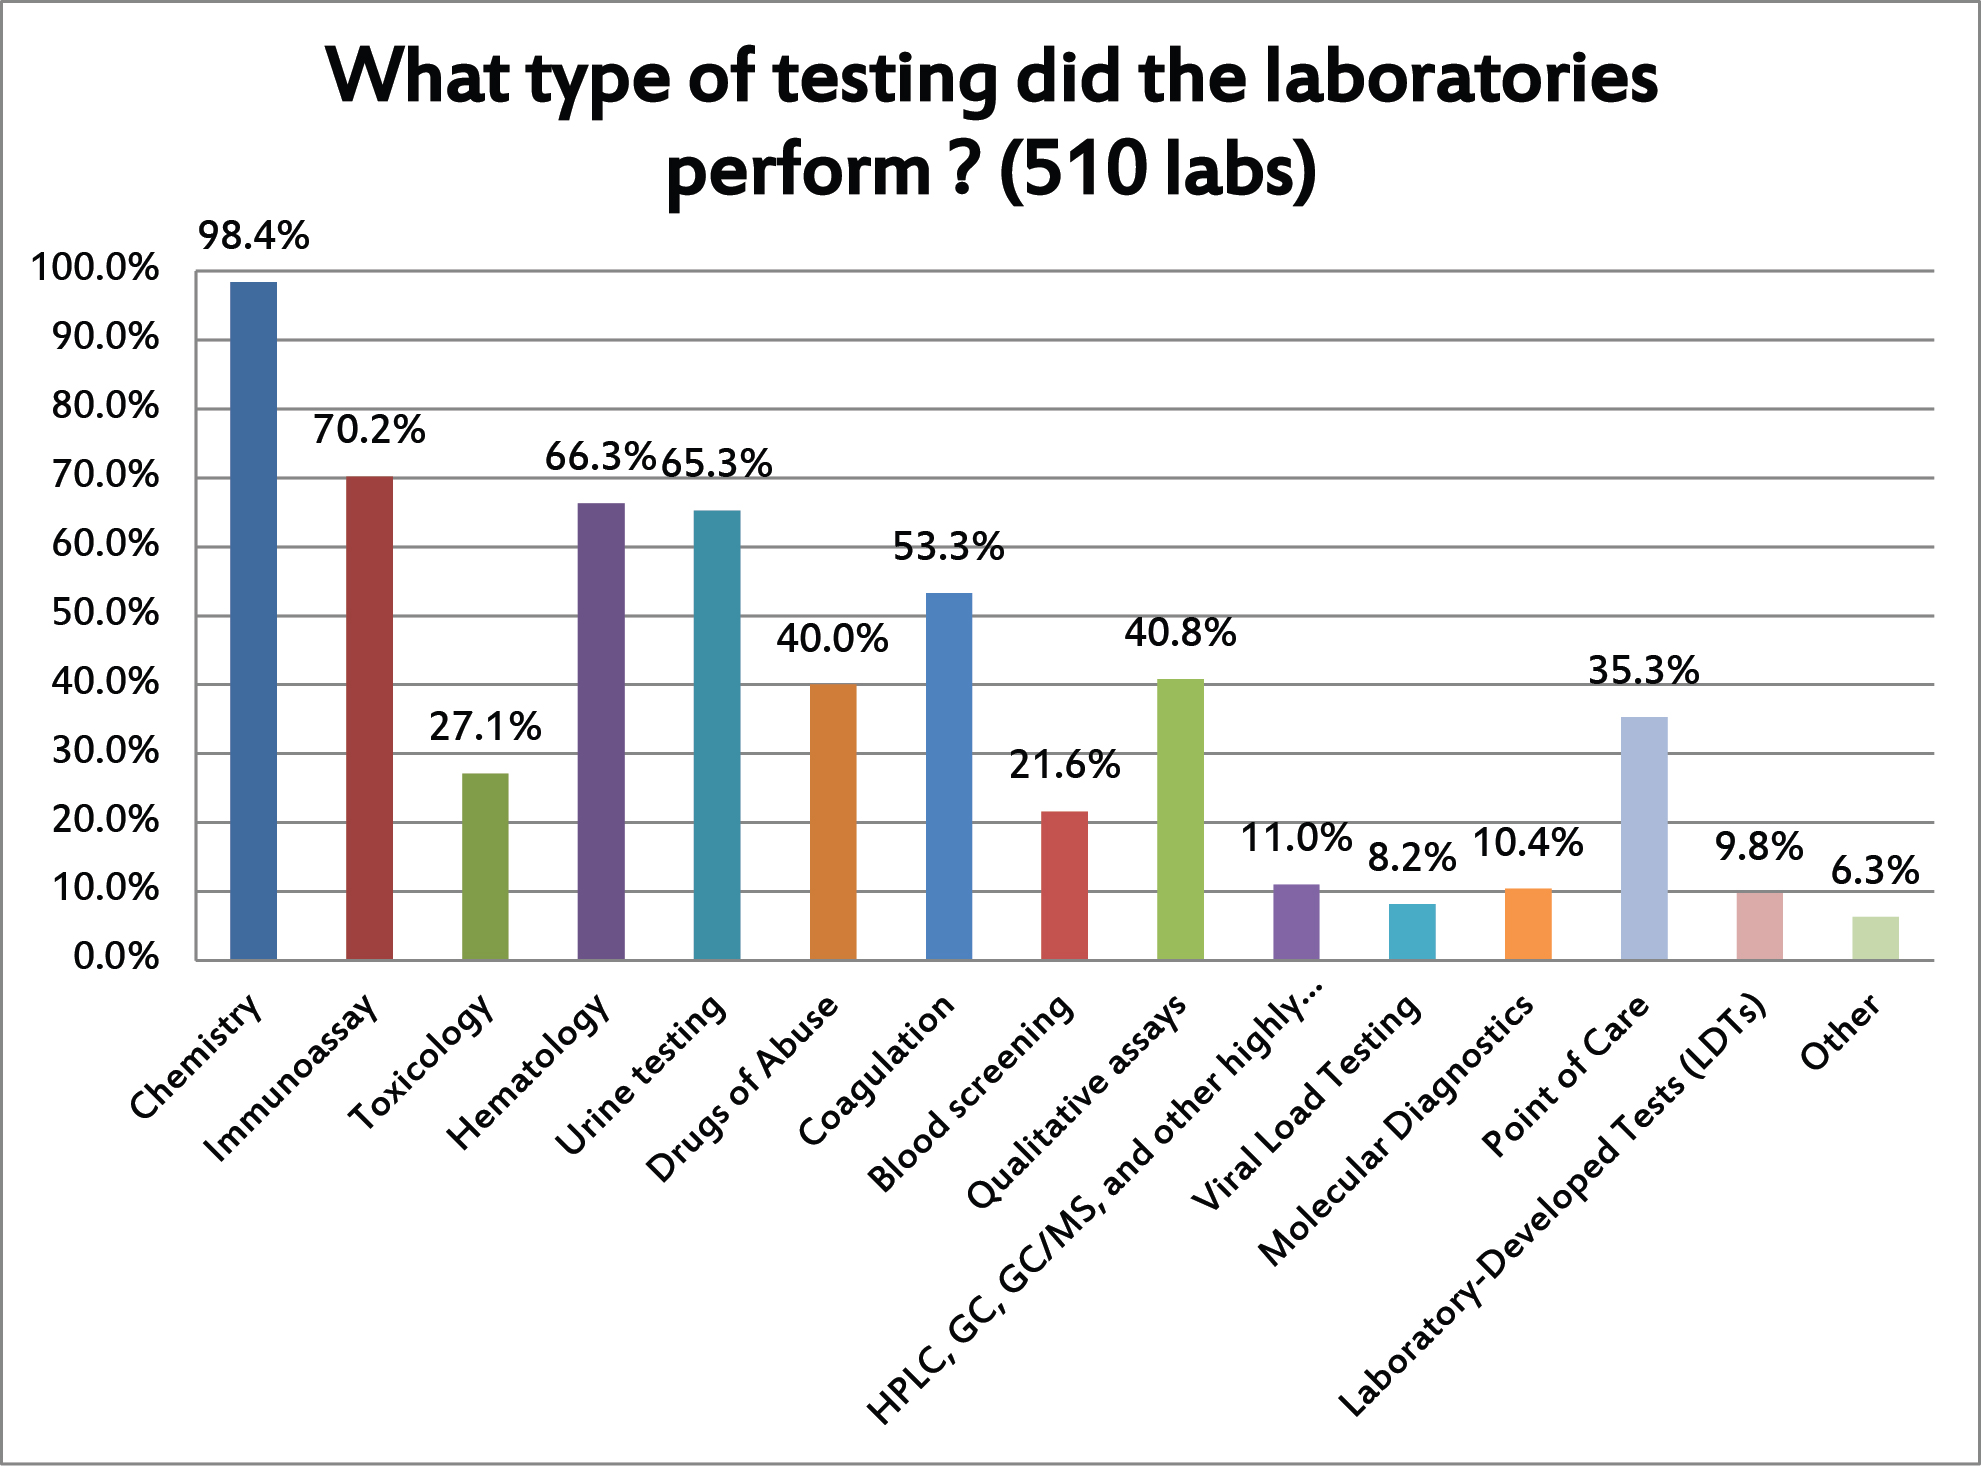
The labs that responded run nearly all kinds of testing. But the primary type of testing that the responding labs were running is chemistry. Given the fact that the Westgard website and "Westgard Rules" are best known in the chemistry world, that's not surprising.
We first asked the laboratories about all the different kinds of testing they perform. Then we asked them to concentrate on just answering questions on their quality control practices for just one type of testing.
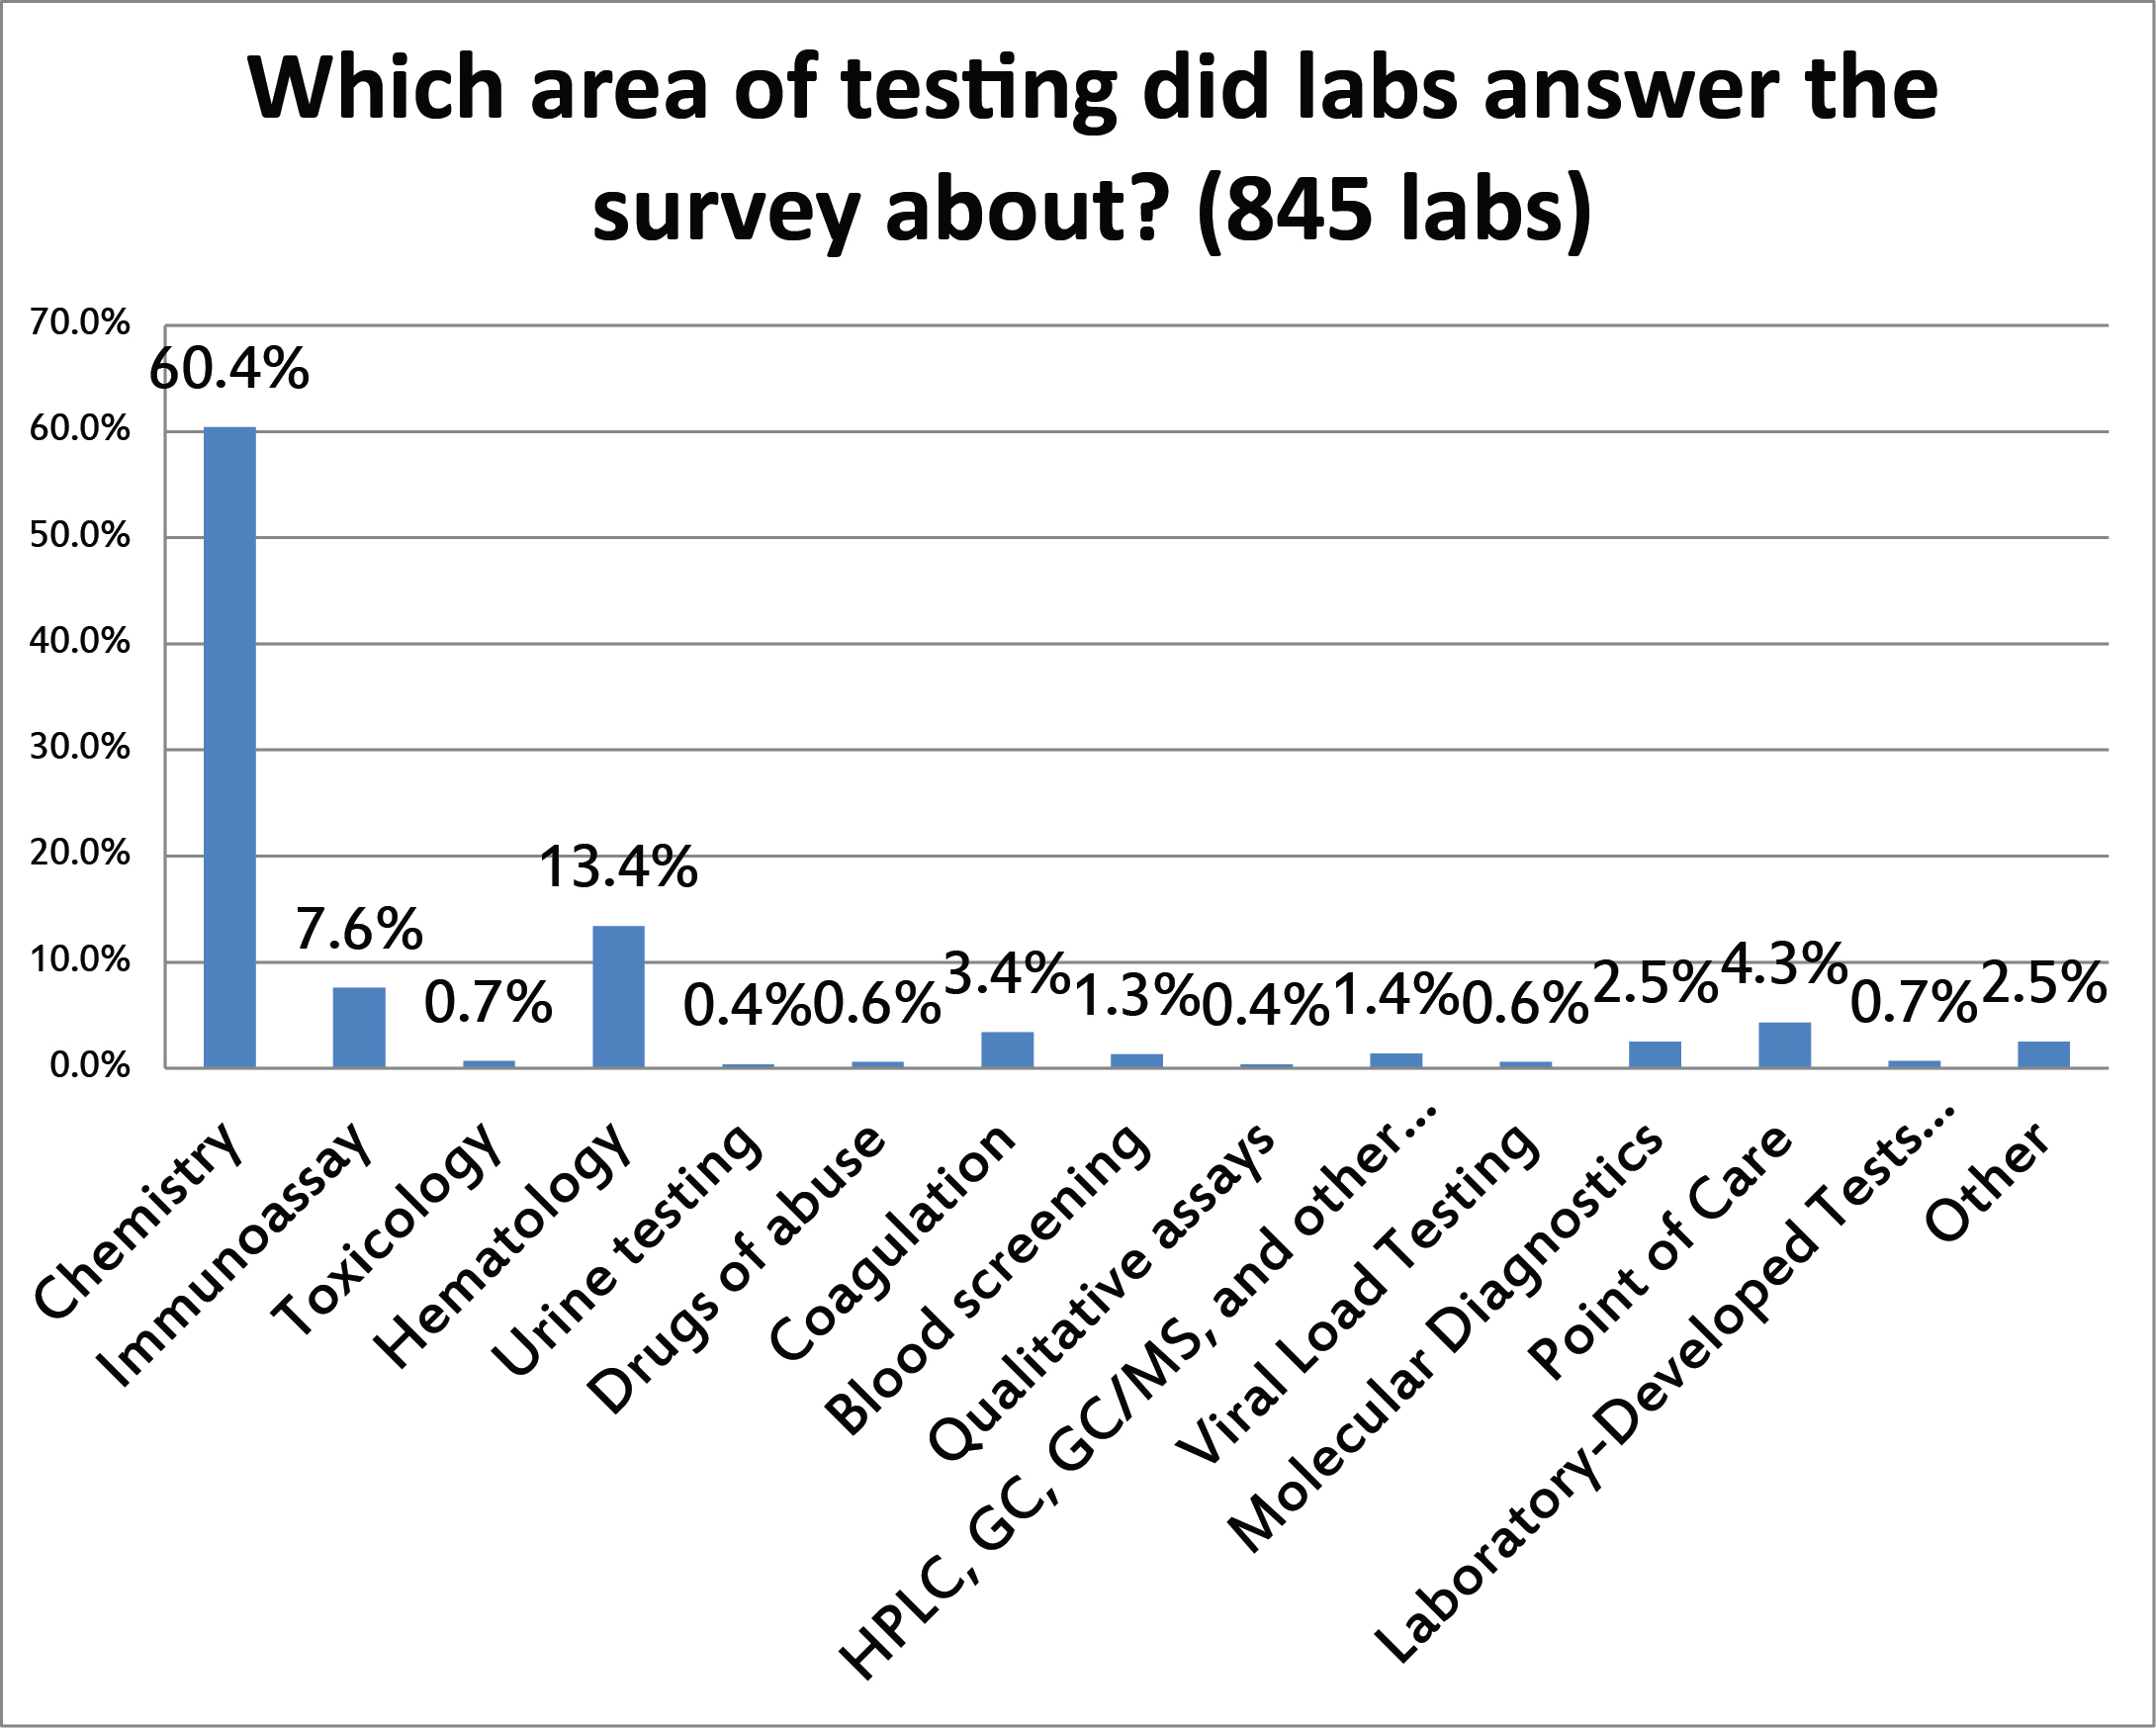
Similarly to the previous question, the vast majority of the responses reflect the QC being implemented on chemistry testing.
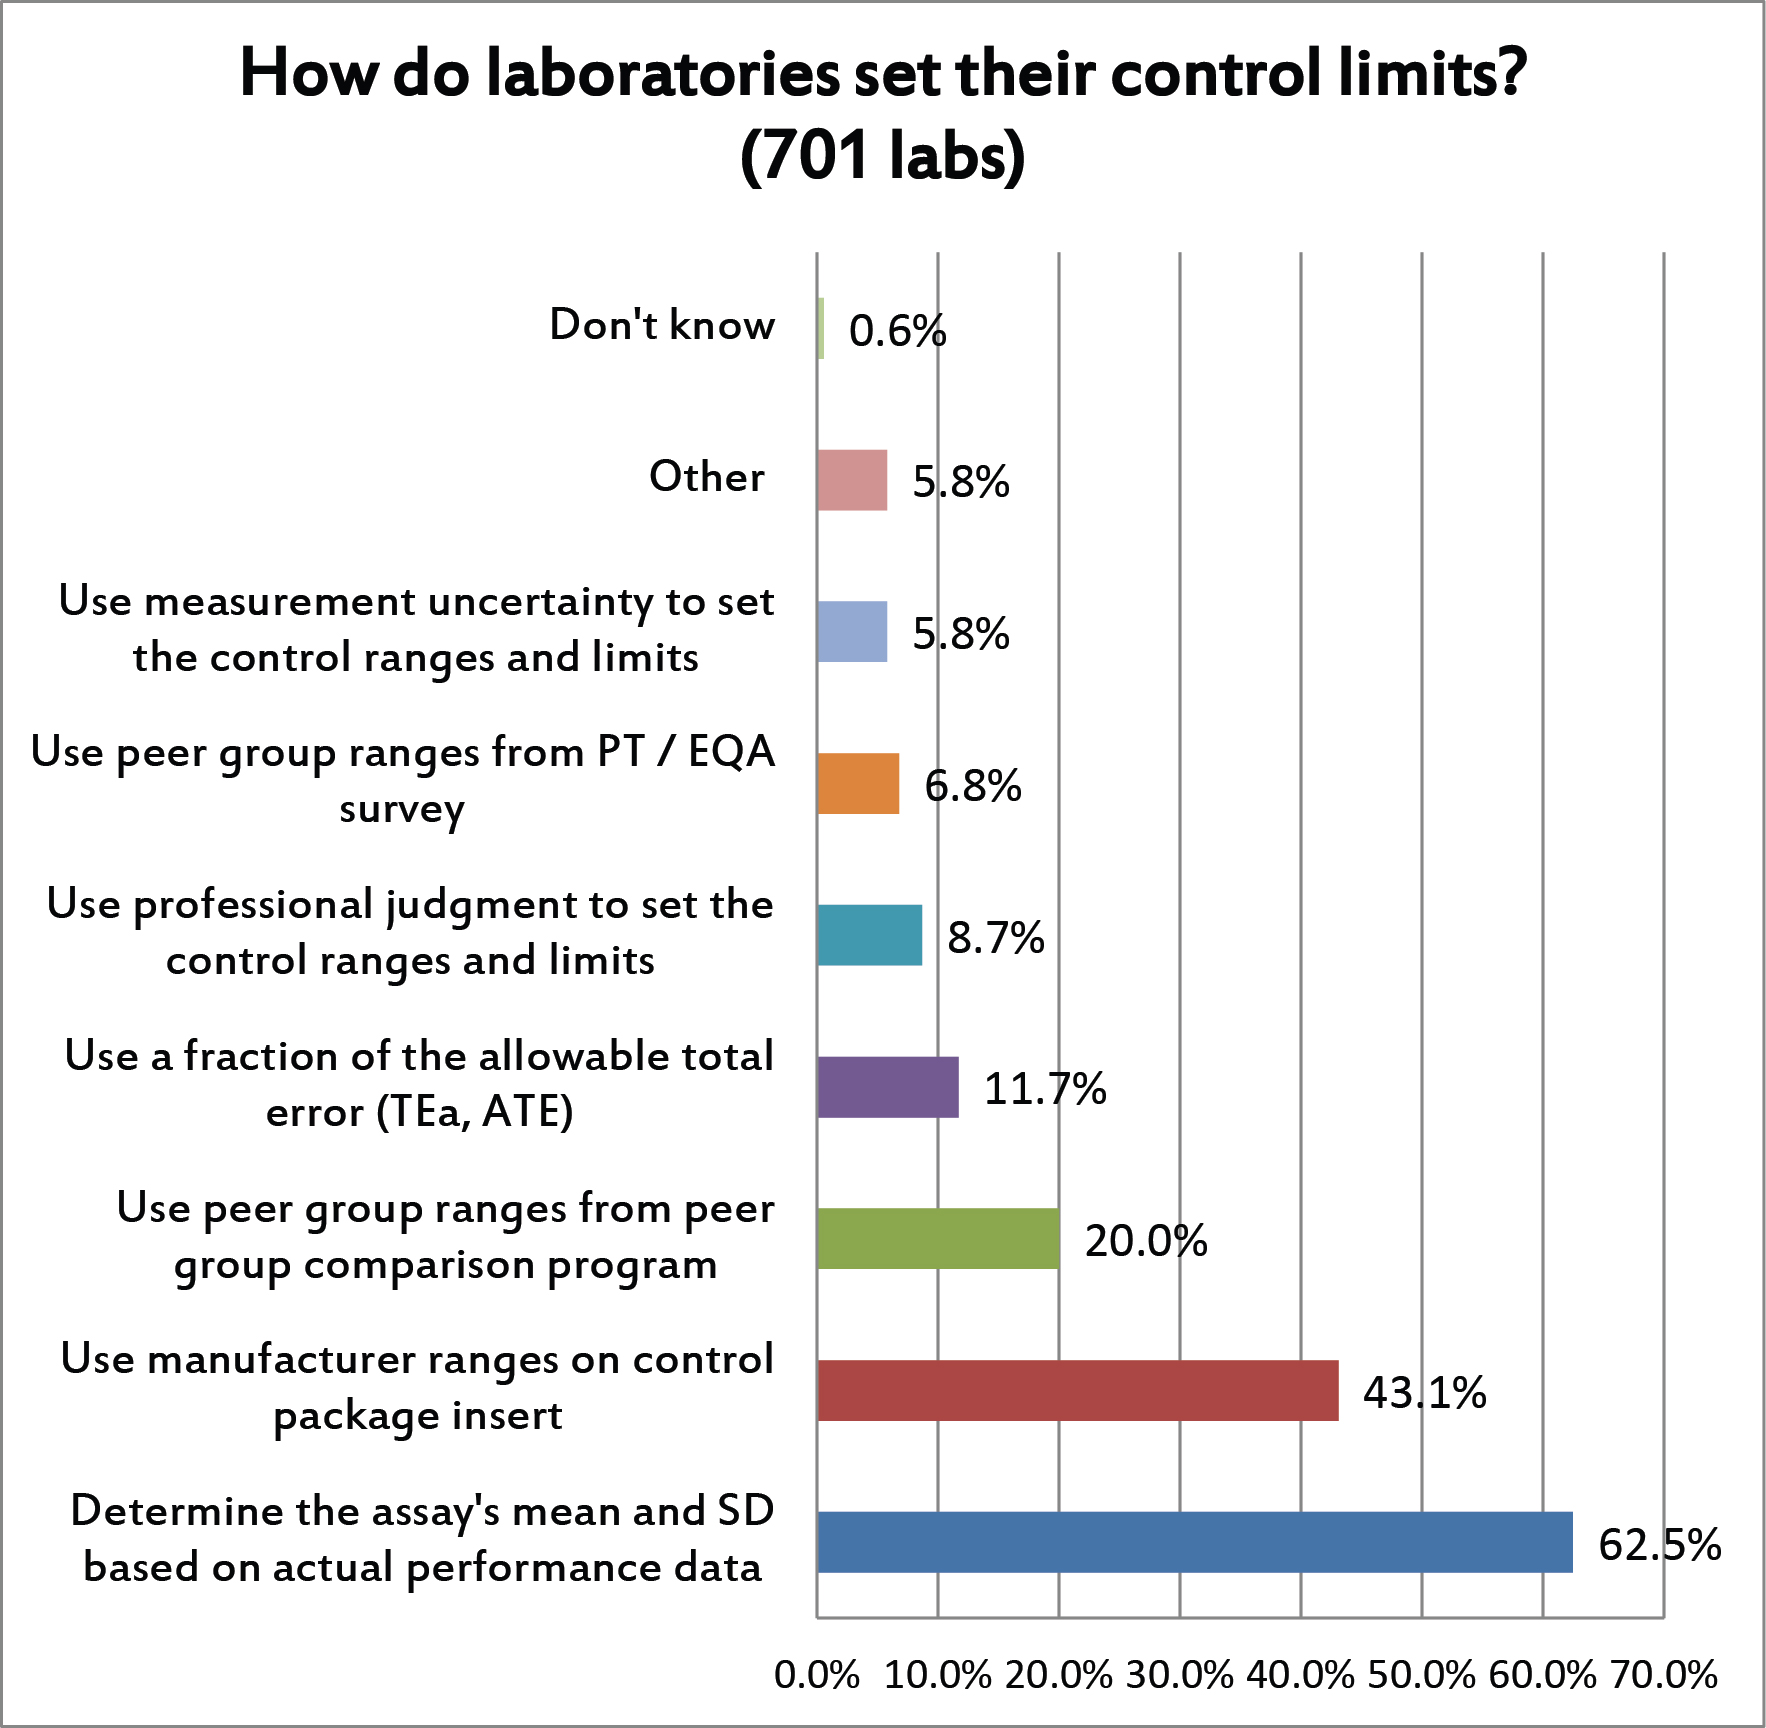
For this question, multiple answers were allowed. But the majority of laboratories are using their actual performance to set their mean and SD. This is encouraging. Less encouraging, however, is the percentage of labs that are using manufacturer's ranges, peer group ranges, and other non-individual sources for SD. Those ranges will typically be set too wide, much wider than they would be if the ranges were based on their actual mean and SD. This is when labs end up being "in control" and compliant but in reality they may be releasing patient results that are wrong.
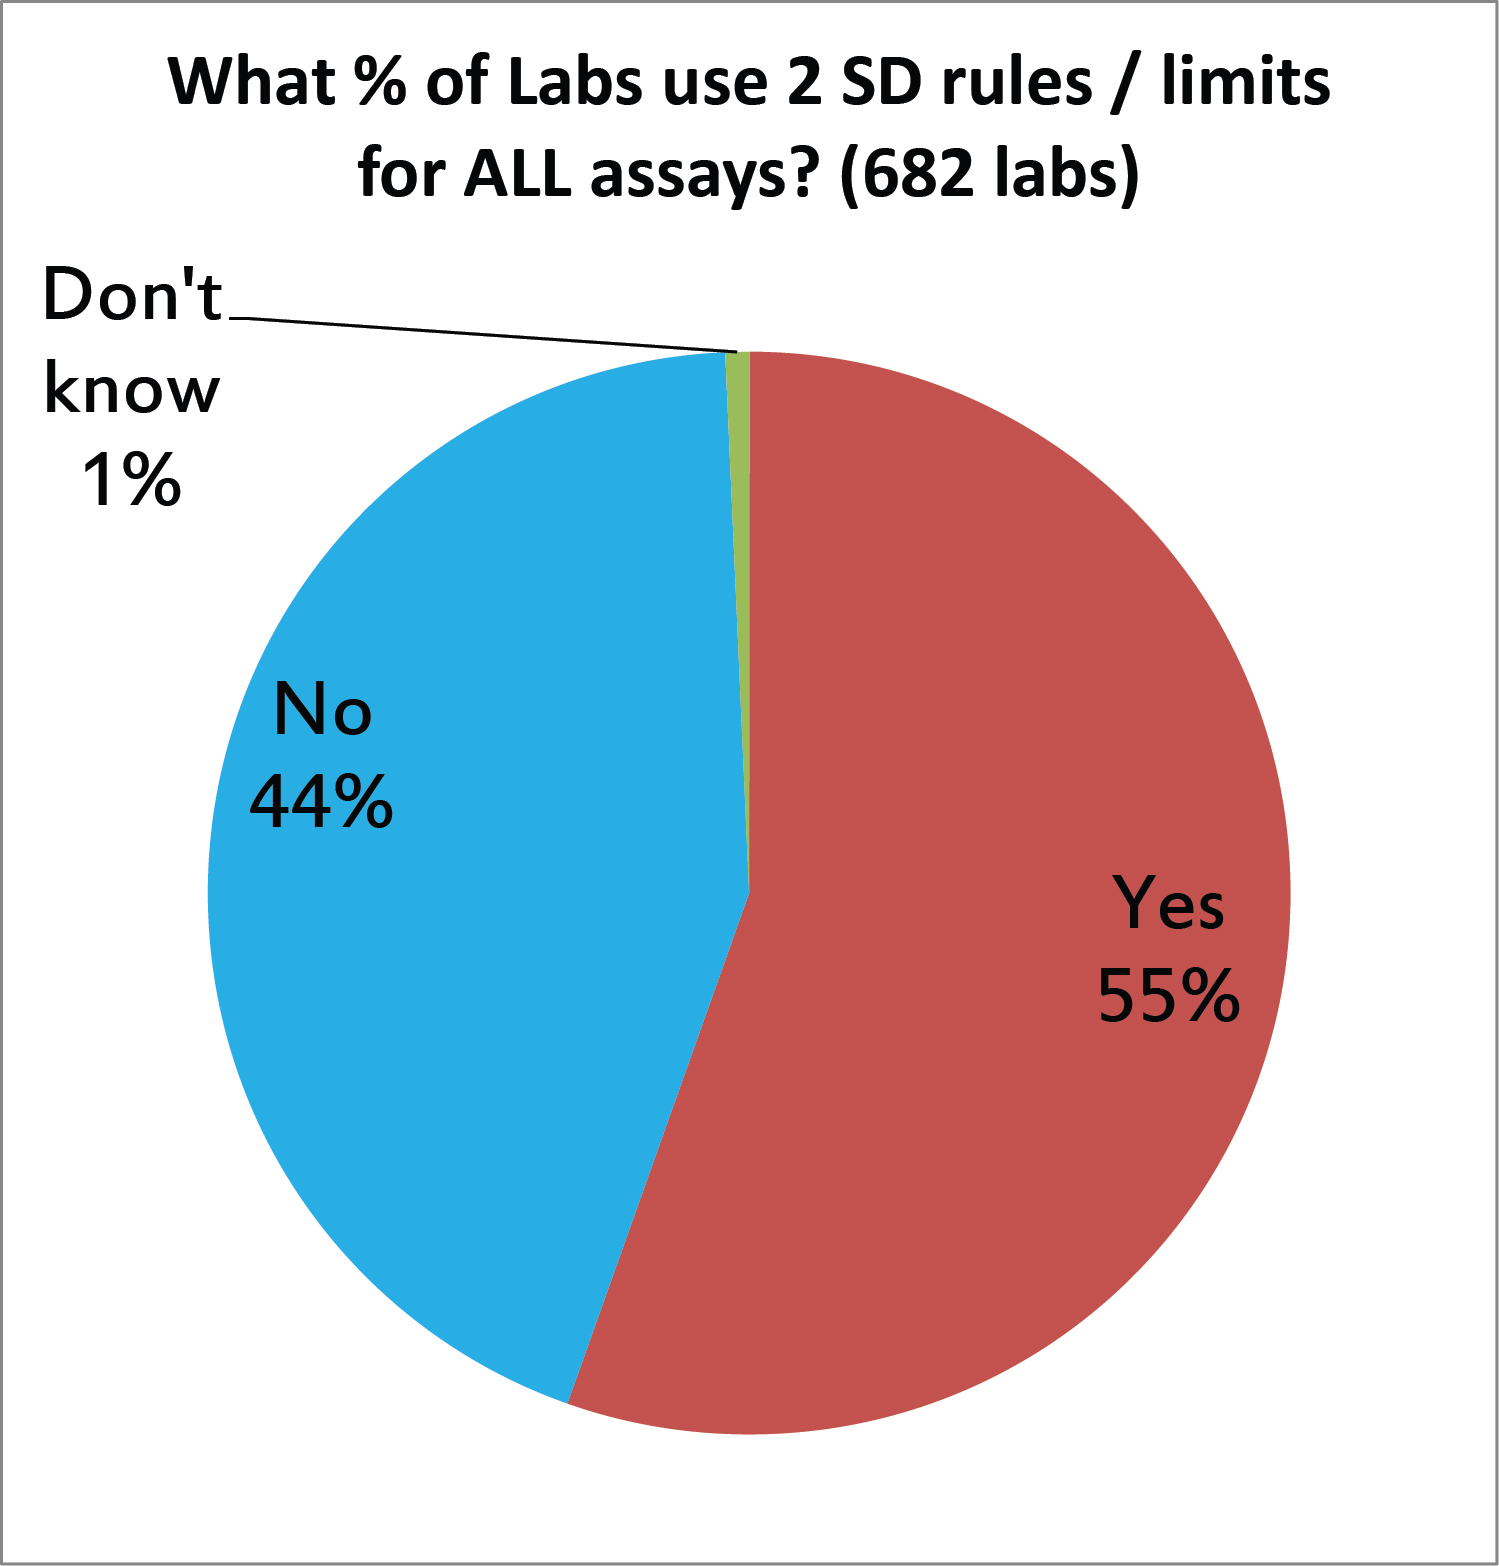
We asked laboratories if they are using 2 SD control limits on all their tests, but probably we just got the answer if they use 2 SD limits on any tests. And sadly, the majority of labs are still using 2 SD limits somewhere in their labs. This is unfortunate, since the strict application of 2 SD will generate high false rejection rates (Pfr of 9% for 2 controls, higher for 3 controls, etc.). Either these labs are drowning in out-of-control events, or they are using some type of trick to push those limits wider (see above, the manufacturer range, peer group SD, etc.), which means their 2 SD isn't really 2 SD. [When we look back at the UK QC survey of 2011, we see this practice is unchanged. About half of labs were using 2 SD limtis back then, too]
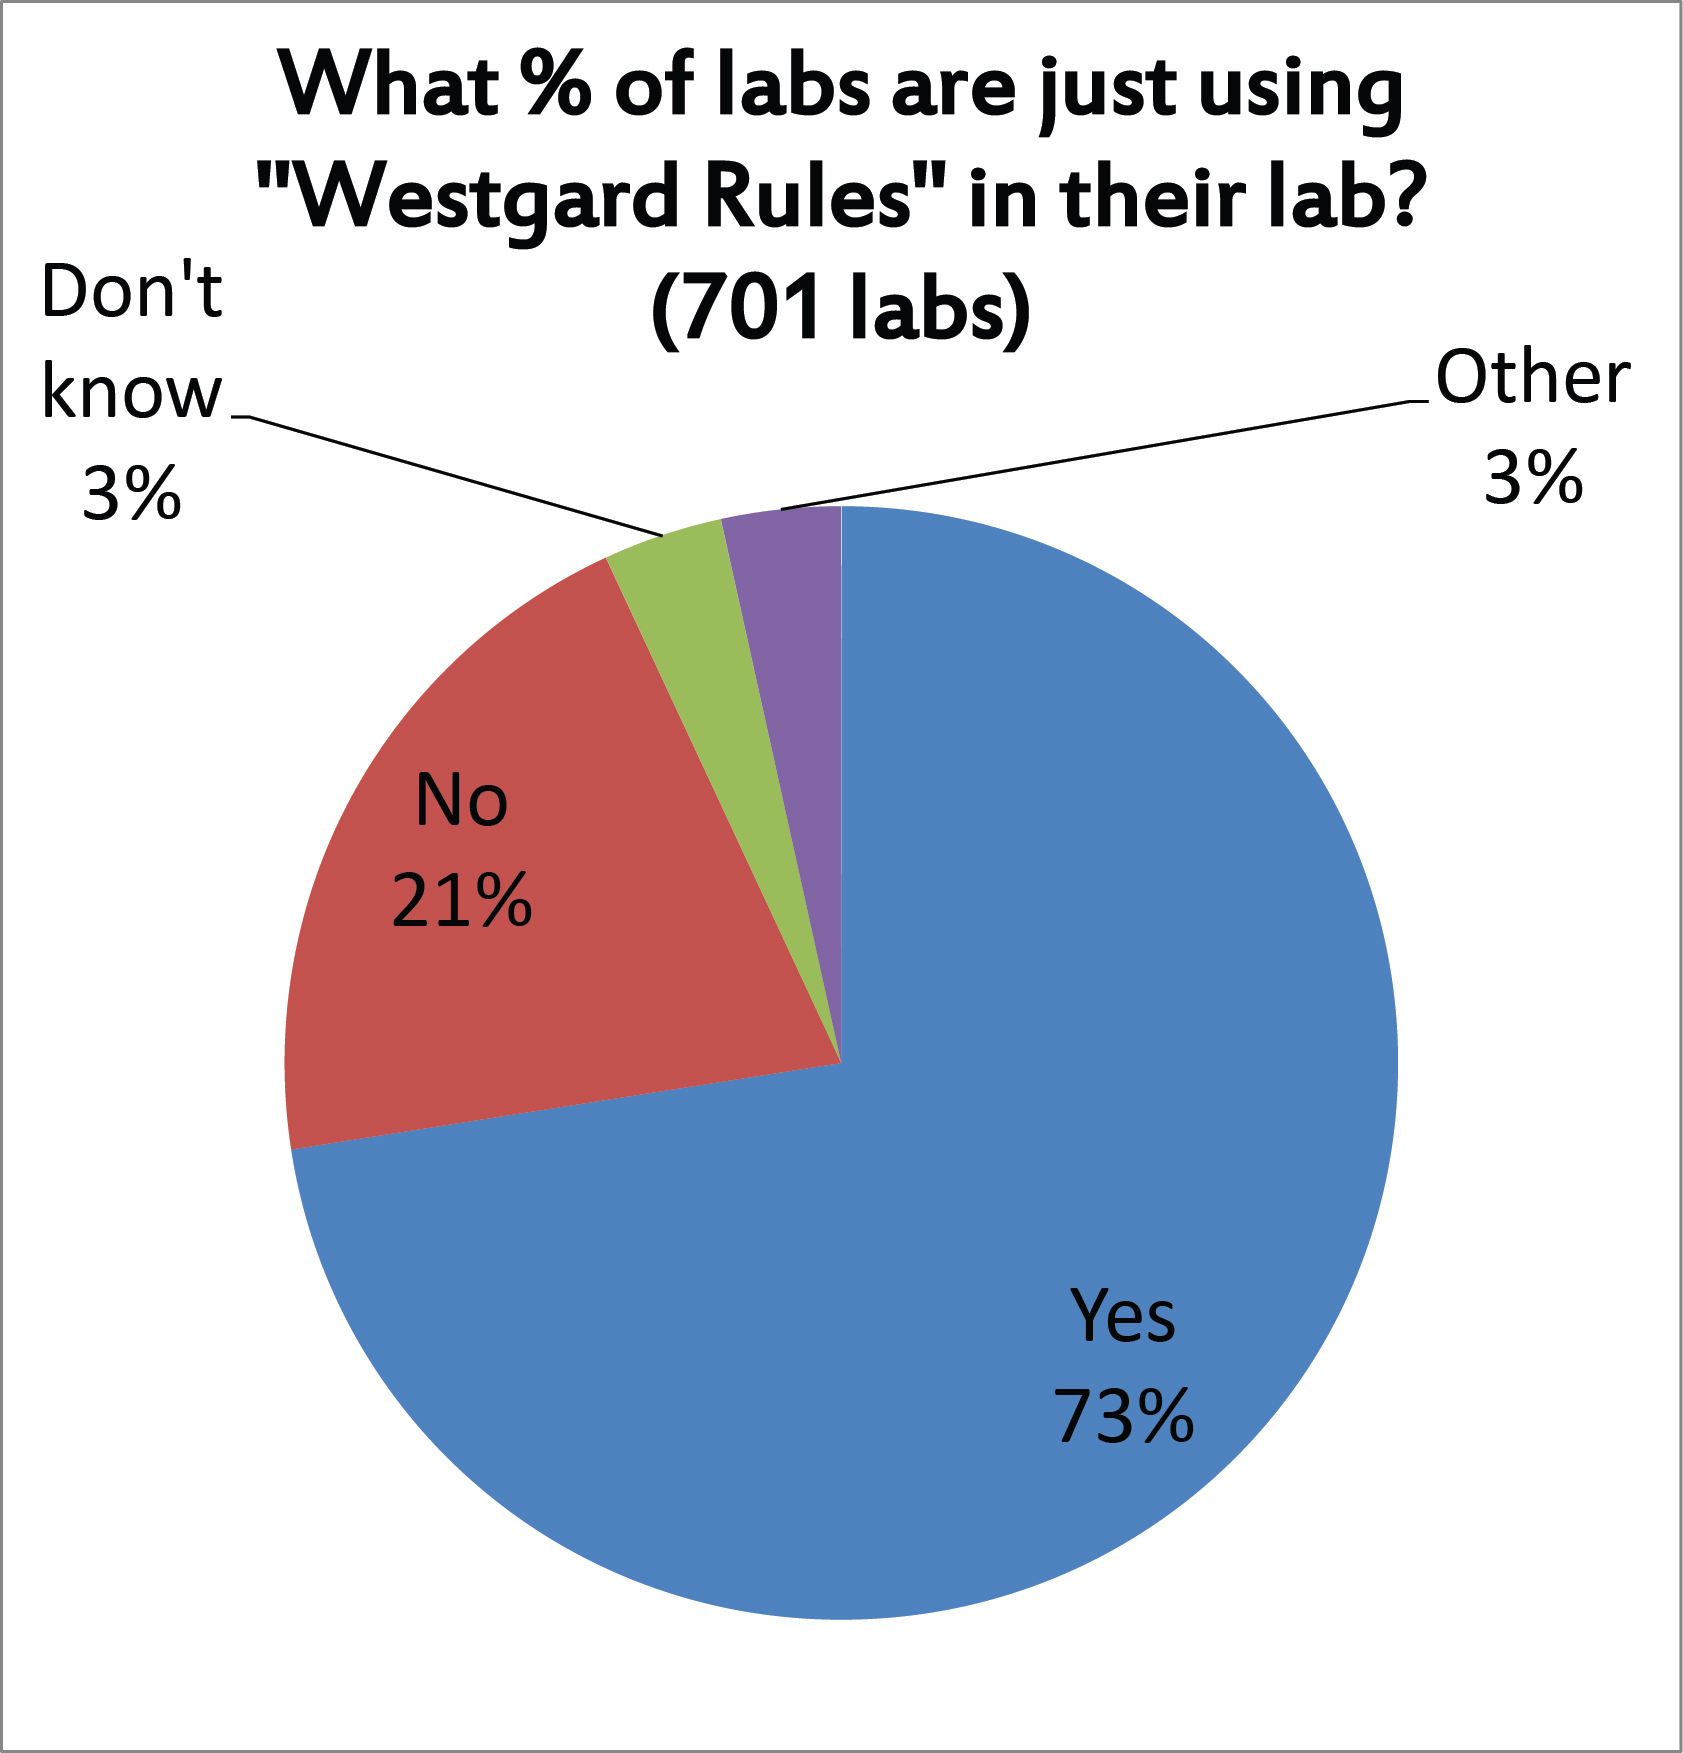
Nearly three out of four laboratories report that they use "Westgard Rules", we suspect not on ALL their tests, but on many tests. Should we take this as an encouraging sign? It's definitely better than using 2 SD control limits. But there are many different ways we have seen laboratories implement the "Westgard Rules" (not all of them productive) so even this finding may not be an unalloyed good. Indeed, there is also the possibility that some very good methods are being "over-QC'd" and over-controlled by a blanket application of "Westgard Rules." We've said it before: there are times when "Westgard Rules" are overkill.
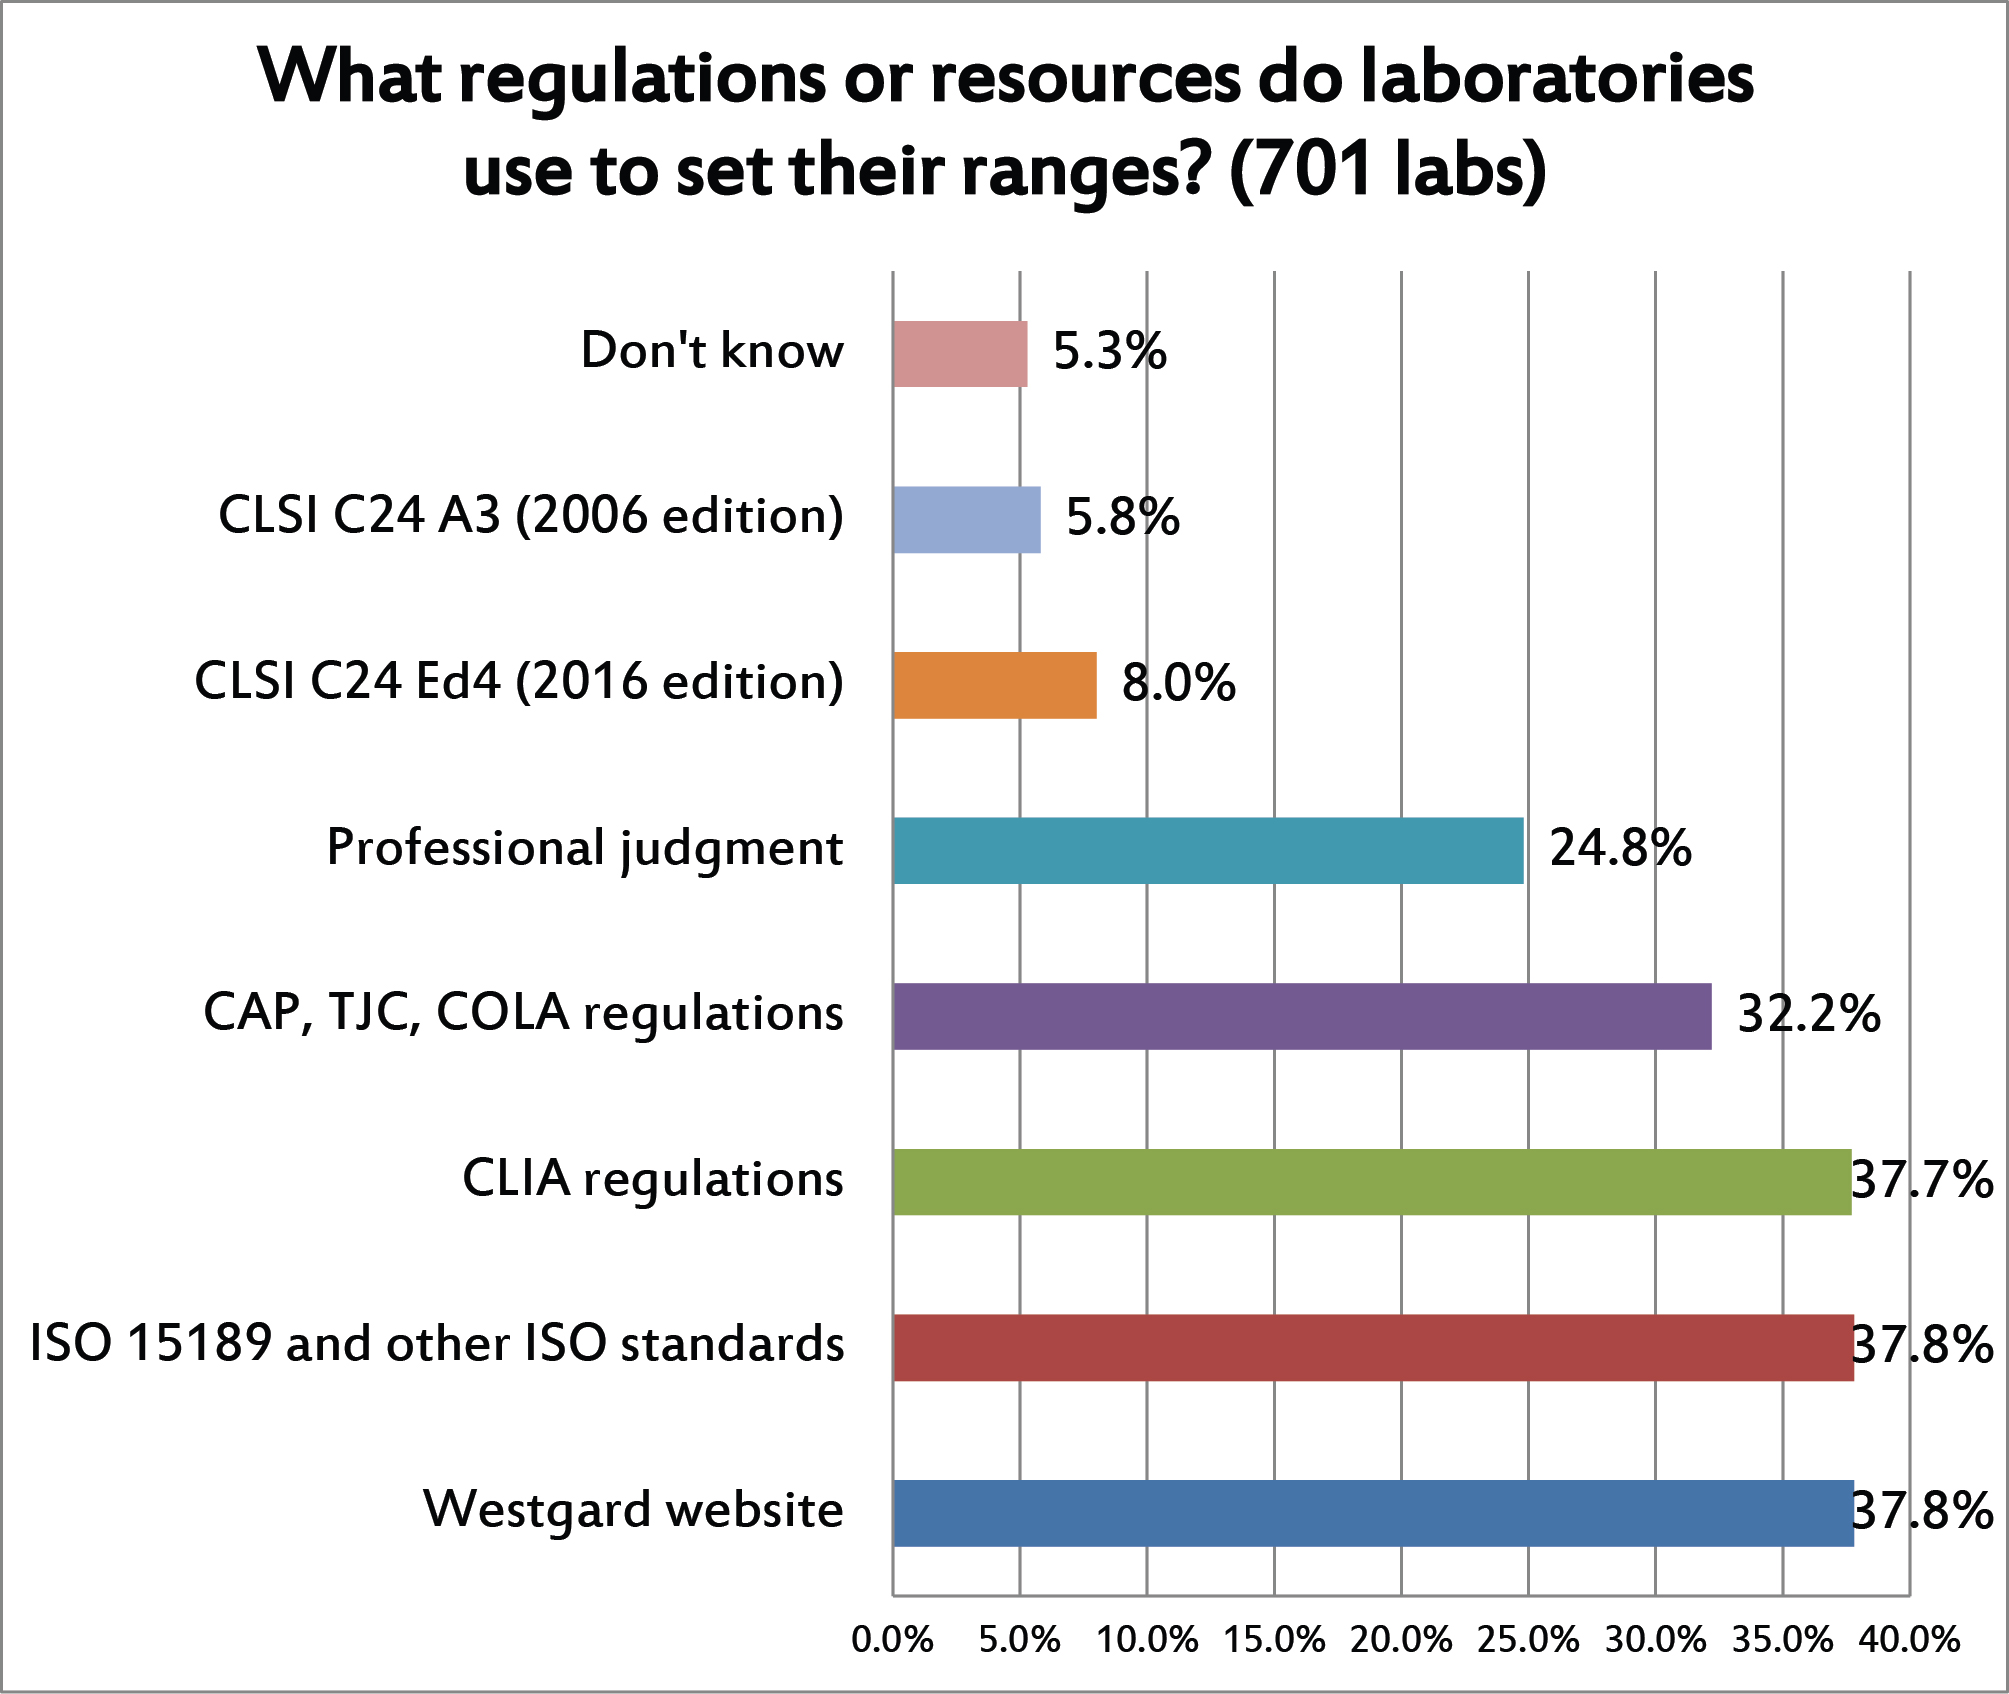
This is a question where multiple answers were allowed. You can see that the choice of control limits is heavily driven by regulations and accreditation requirements. Far fewer labs follow the CLSI C24 best practice guidelines for QC. Nearly 1 in 4 labs also relies on their own professional judgement for choosing their control limits, which you can interpret variously as a sign of experience or possibly a tendency to value to tradition over science.
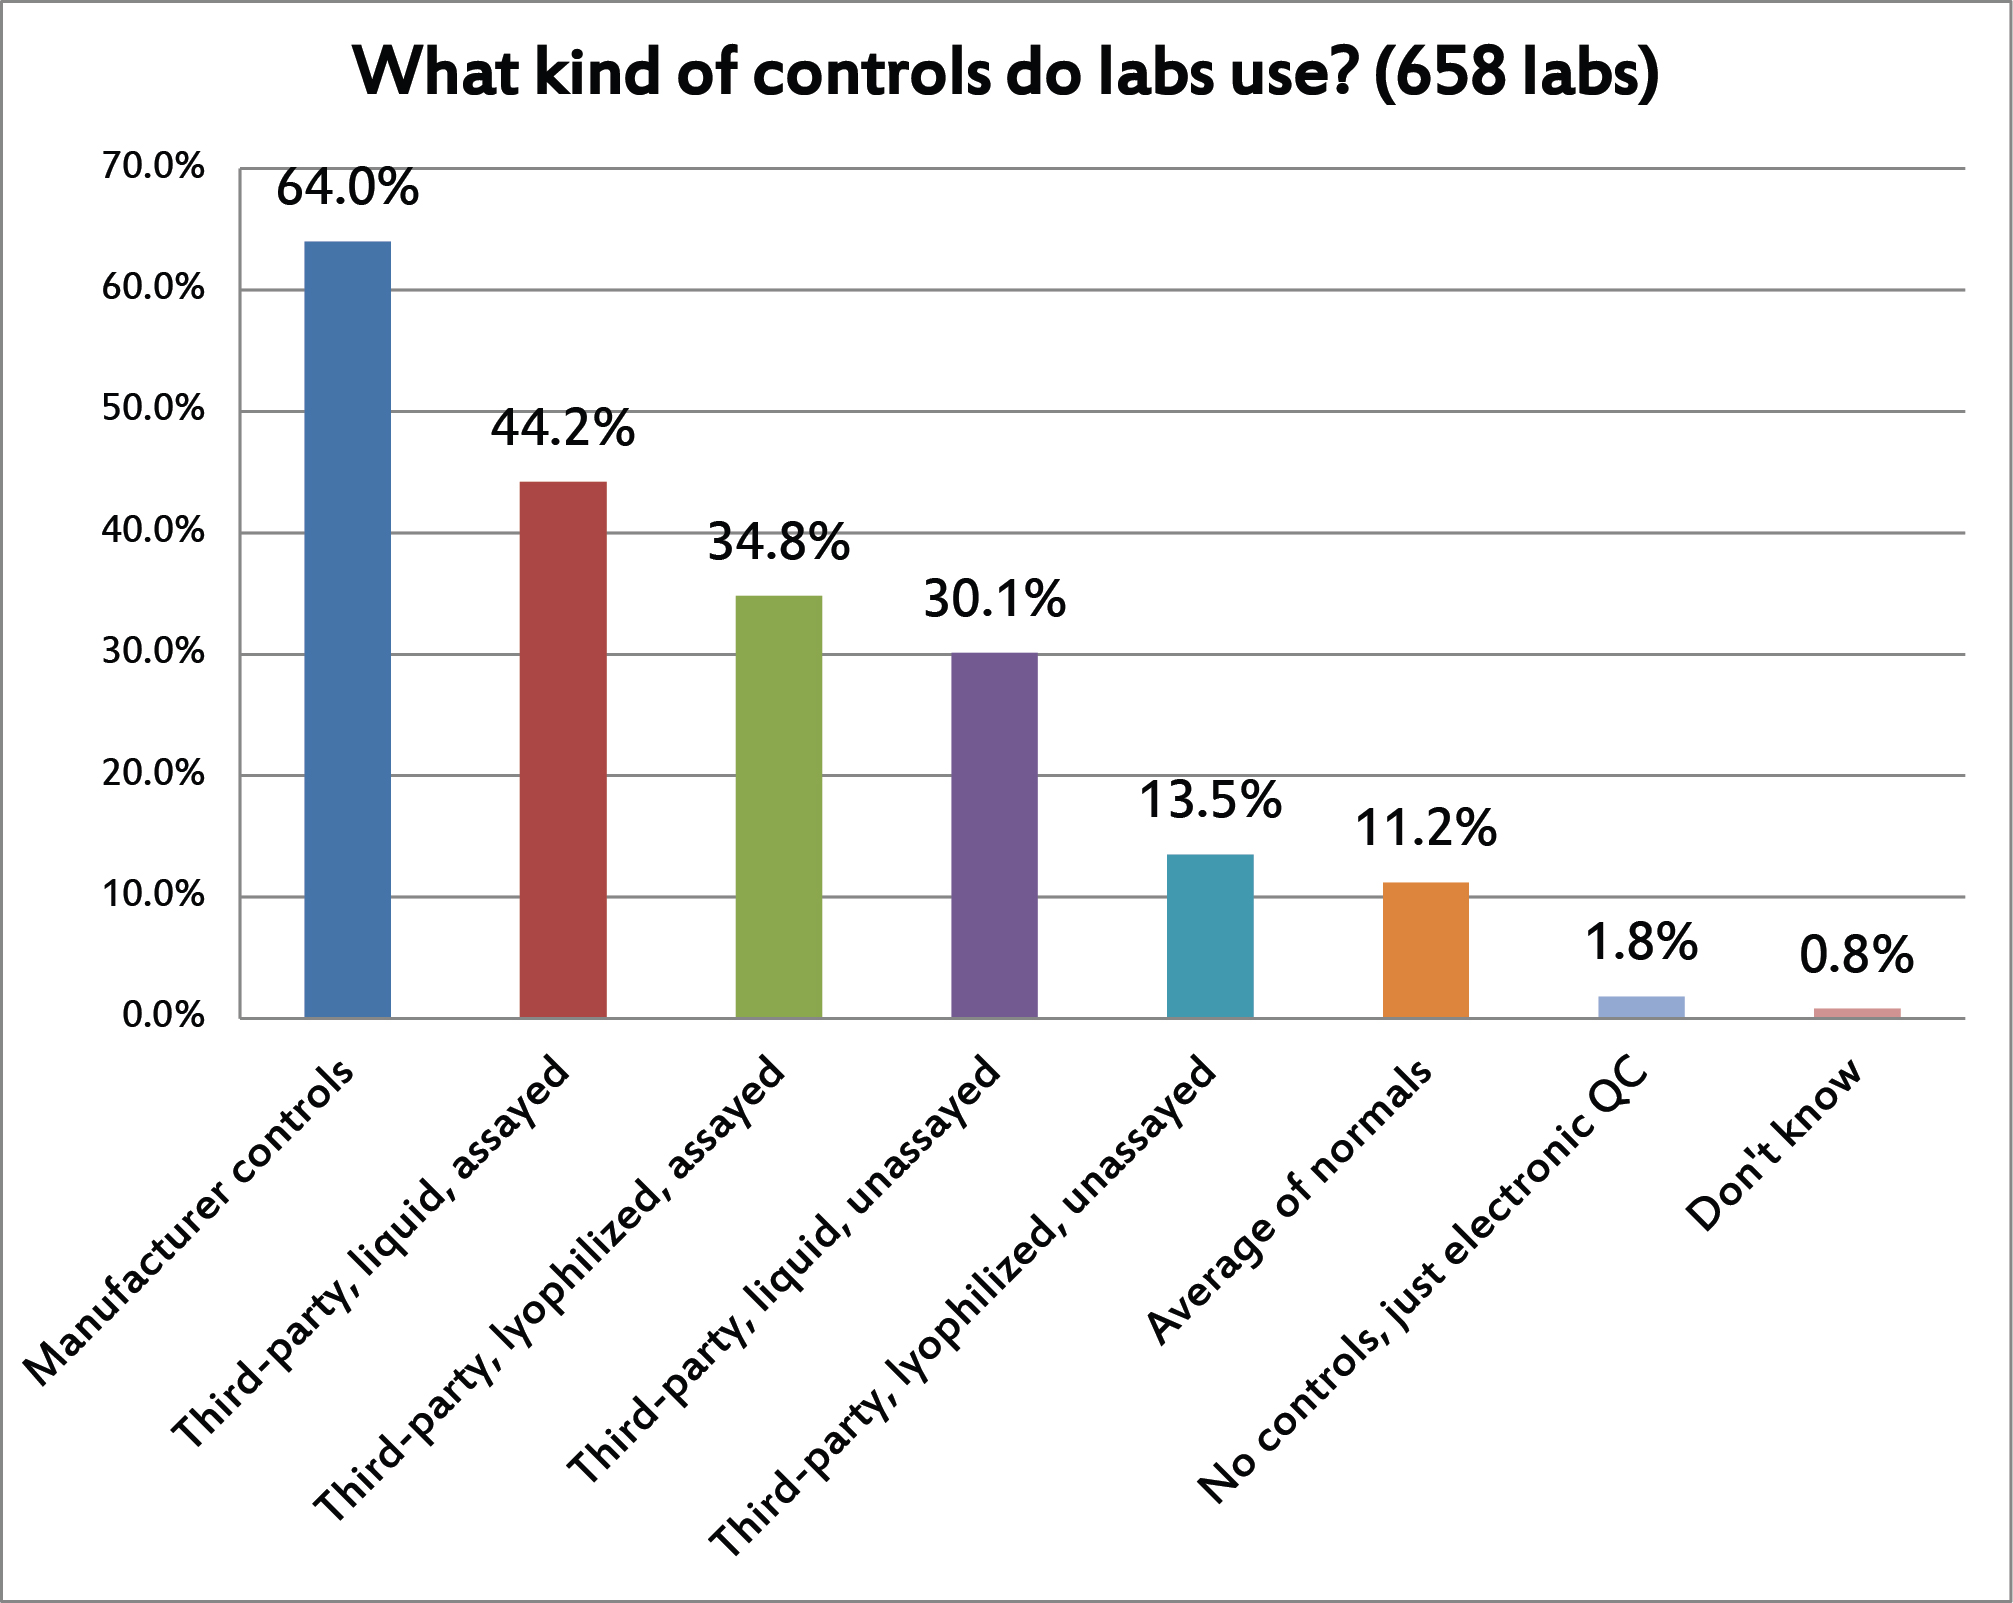
[Again, this was a question where multiple answers were allowed] A bit of a surprising finding in this one. More than 60% of laboratories are using manufacturer controls. The drawbacks of manufacturer controls are so well known that even the latest ISO standards strongly encourage the use of independent / third-party controls. (I speculate that this will become a mandatory requirement in the next version of ISO 15189.) Of the various types of third-party controls, liquid assayed controls are most common, while lyophilized unassayed controls are least popular. With average of normals, it's also surprising to see such a low adoption rate. This technique has been around for decades, is well known and commonly applied in hematology, and its utility has been demonstrated many times, but in the "real world" it still seems out of reach. There have been major informatics advances to make the average of normals easier to implement, but the hurdles are stlil sufficiently high, the complexity still sufficiently deep, that the vast majority of laboratories simply don't do it.
You can also see that, while IQCP and EP23 was all the rage in the US, there has been very little shifting of QC into the electronic realm. Only the POC market has been embracing these non-traditional QC techniques, and then probably only because the small devices are just not well designed to perform traditional QC.
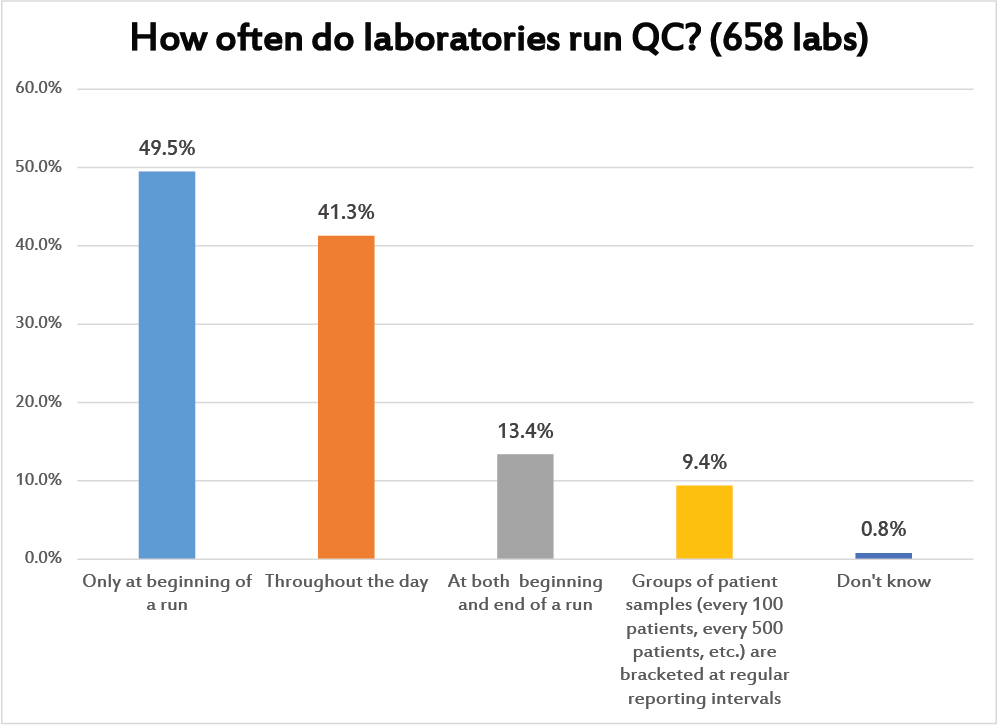
This is a question where multiple answers were allowed. This is a conceptual question about how laboratories schedule their QC. Nearly a majority place their controls only at the beginning of a run. The next most popular QC schedule is to run controls throughout the day. A much smaller portion of labs are performing a kind of "bracket QC", placing controls at both the beginning and the end of the run. Even fewer laboratories are spacing the controls out based on the testing volume. This last option, of course, is the most scientific approach: to determine how many patient samples can be run in-between controls without raising the risk of reporting a bad result to an unacceptable level. This is also the option that is informed by the ground-breaking work of Curt Parvin.
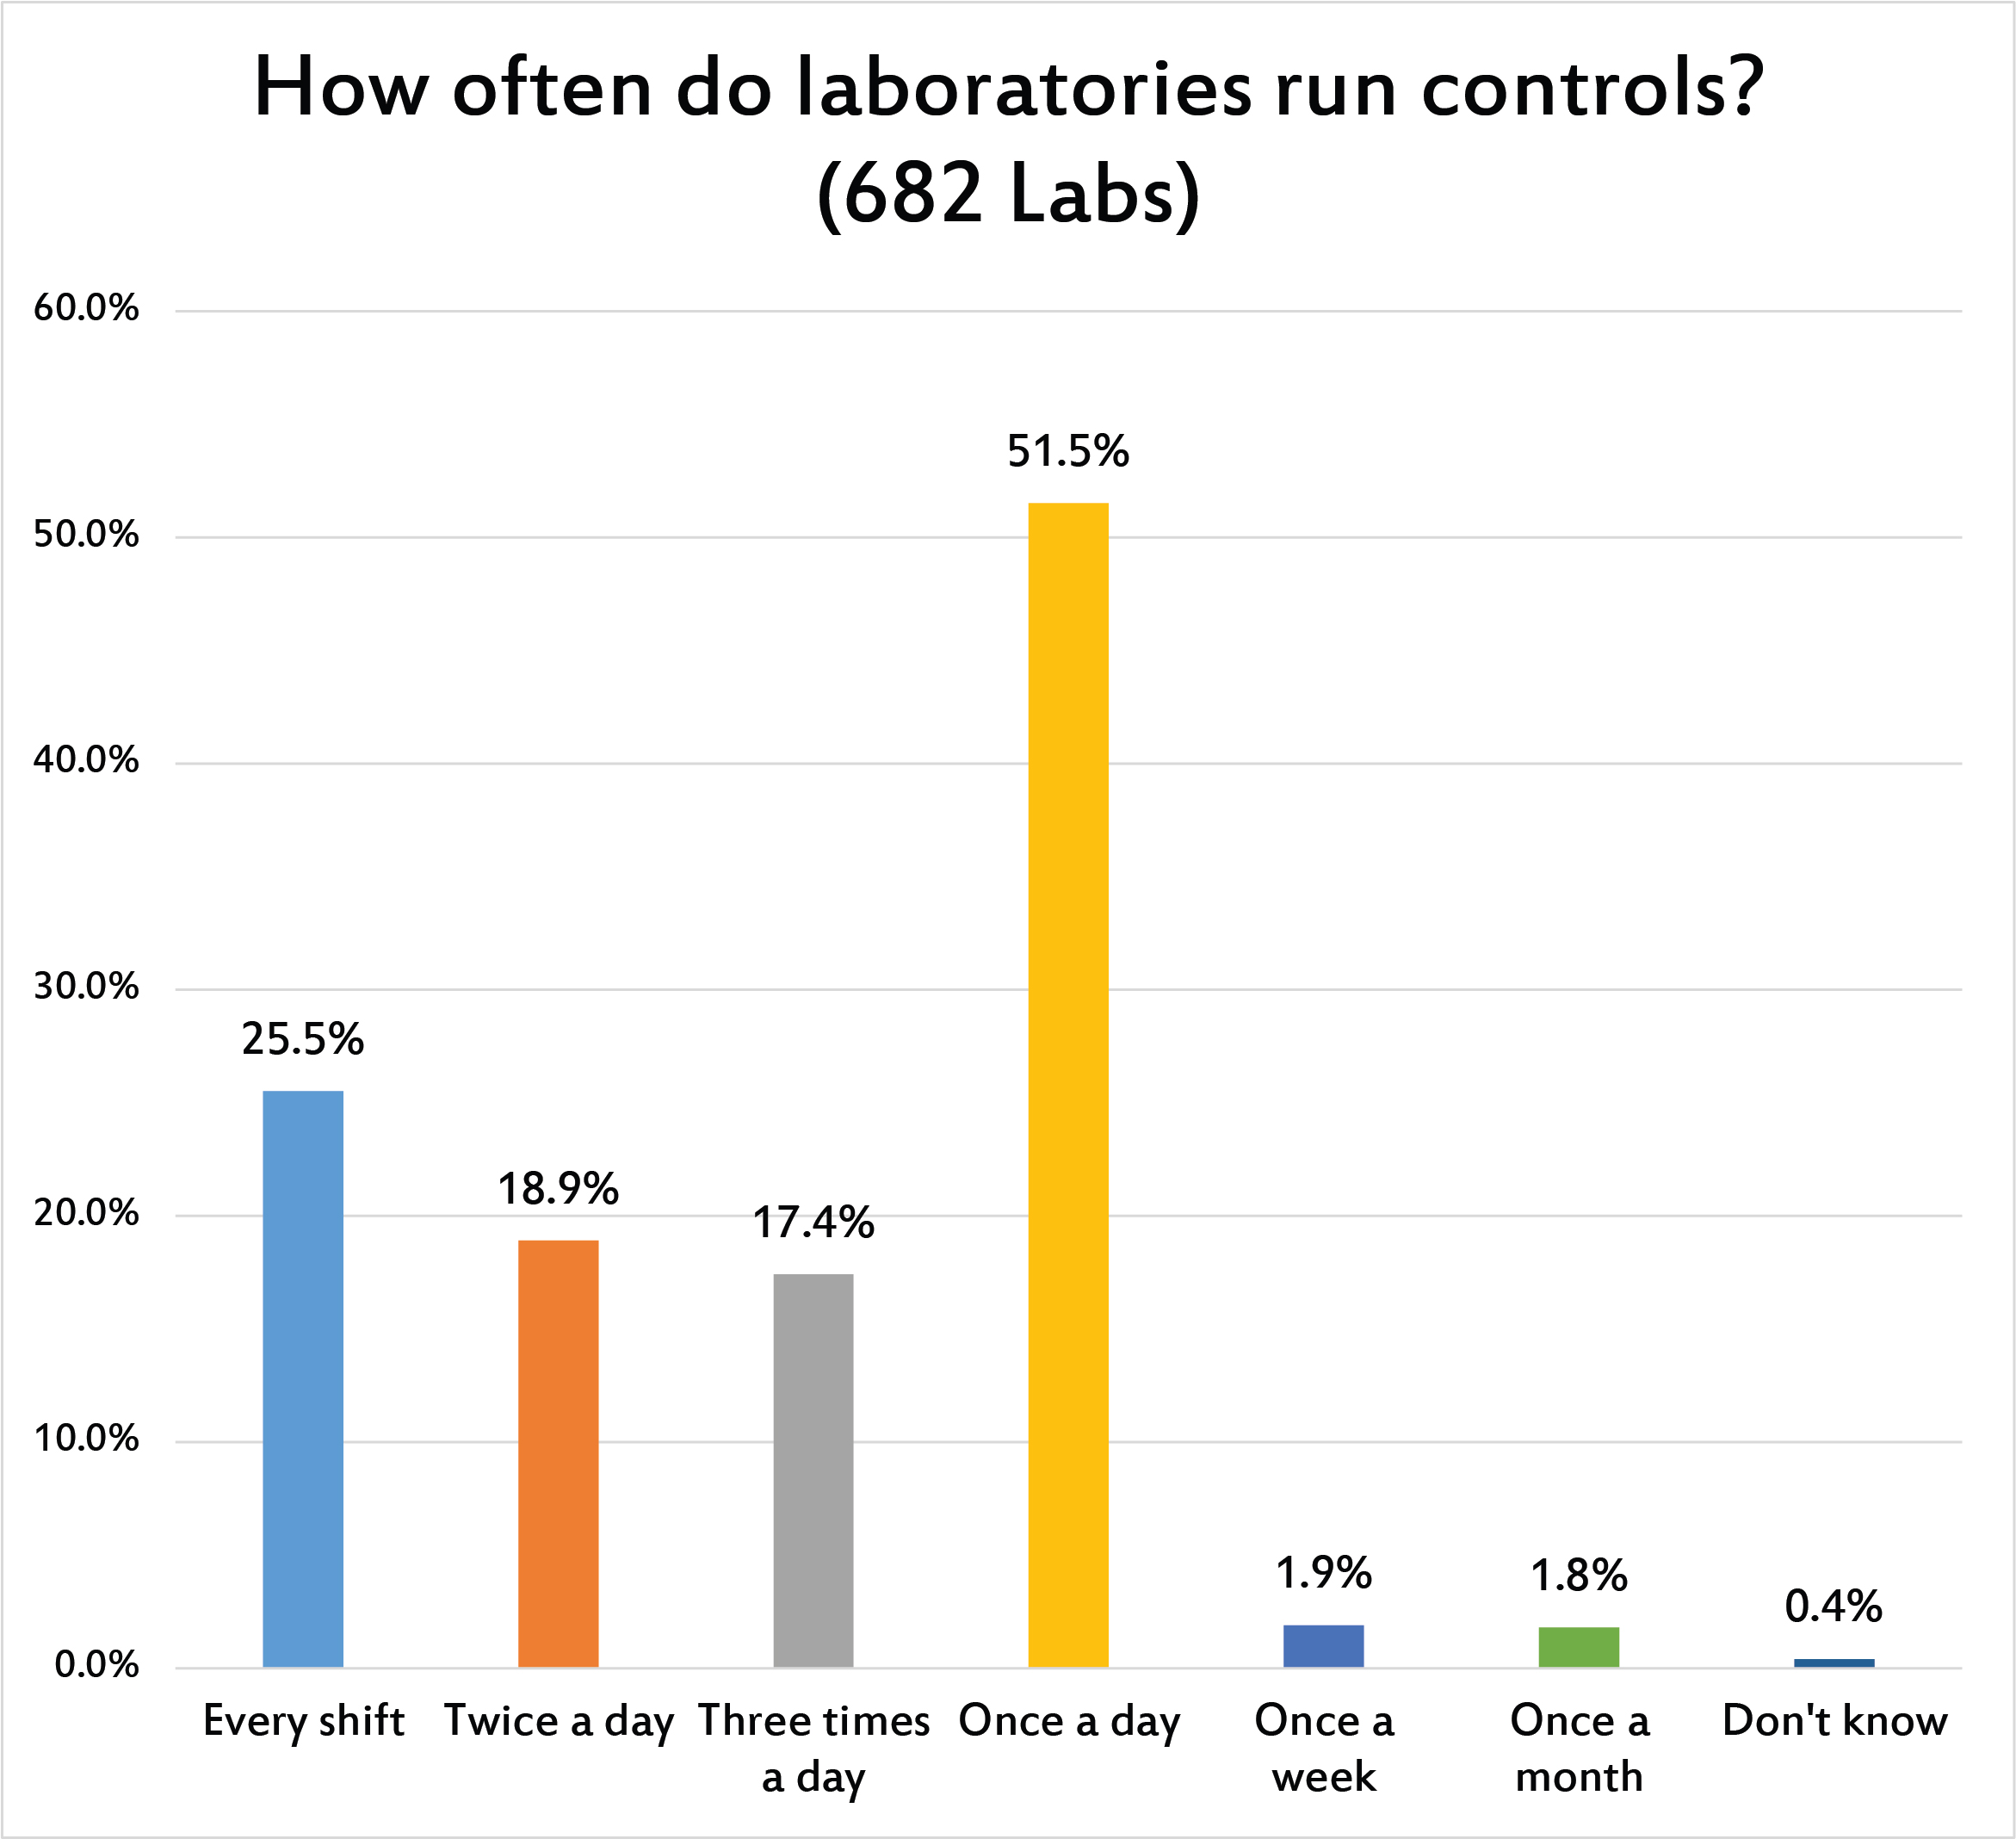
While the previous question asked about the placement of controls within a run, this question asked more directly about how many controls were run within a day. Most of the labs around the world are meeting the "minimum standard" from CLIA and other regulations: once a day. QC frequency remains primarily based on the rotational speed of the earth, not driven by needs of the clinician and patient.
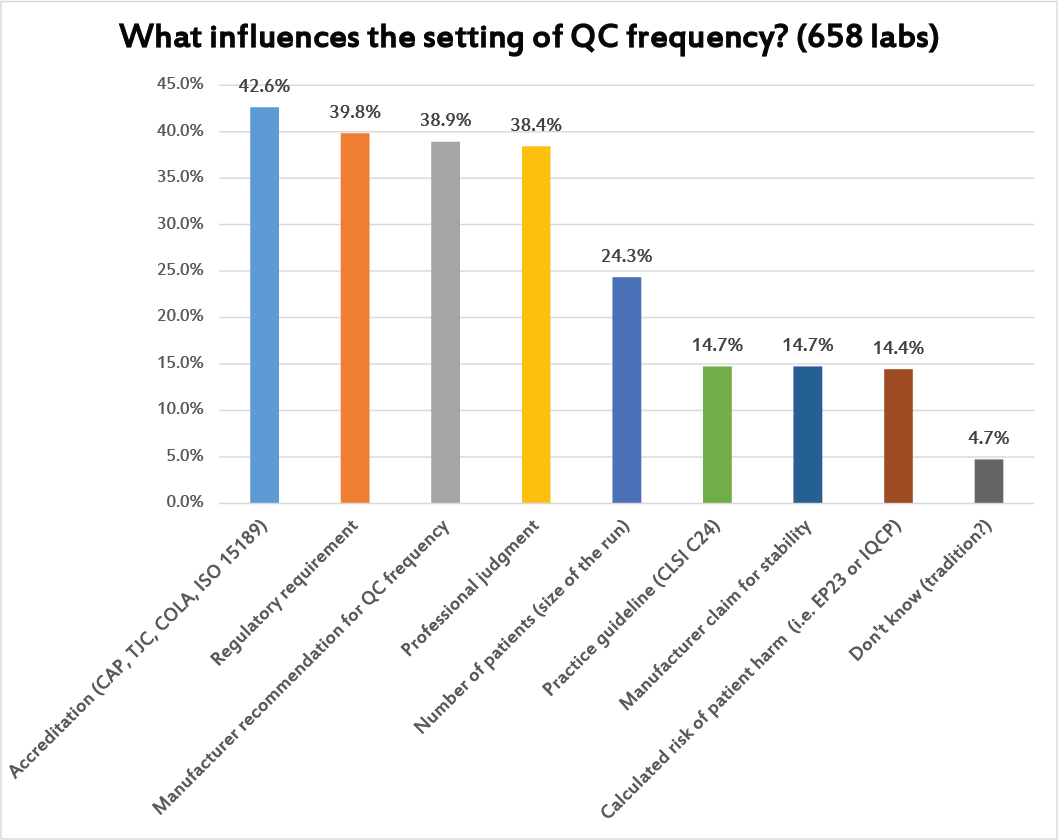
Again, this is a question where multiple answers were allowed. The most common reason used to set the frequency of QC are the regulatory and accreditation requirements. But the manufacturer QC recommendations and professional judgment play almost equally important roles.
Only about 1 in 4 laboratories are using the actual volume of testing to guide their QC frequency. And only about 1 in 6 are using either EP23 or IQCP as the rationale for setting QC frequency.
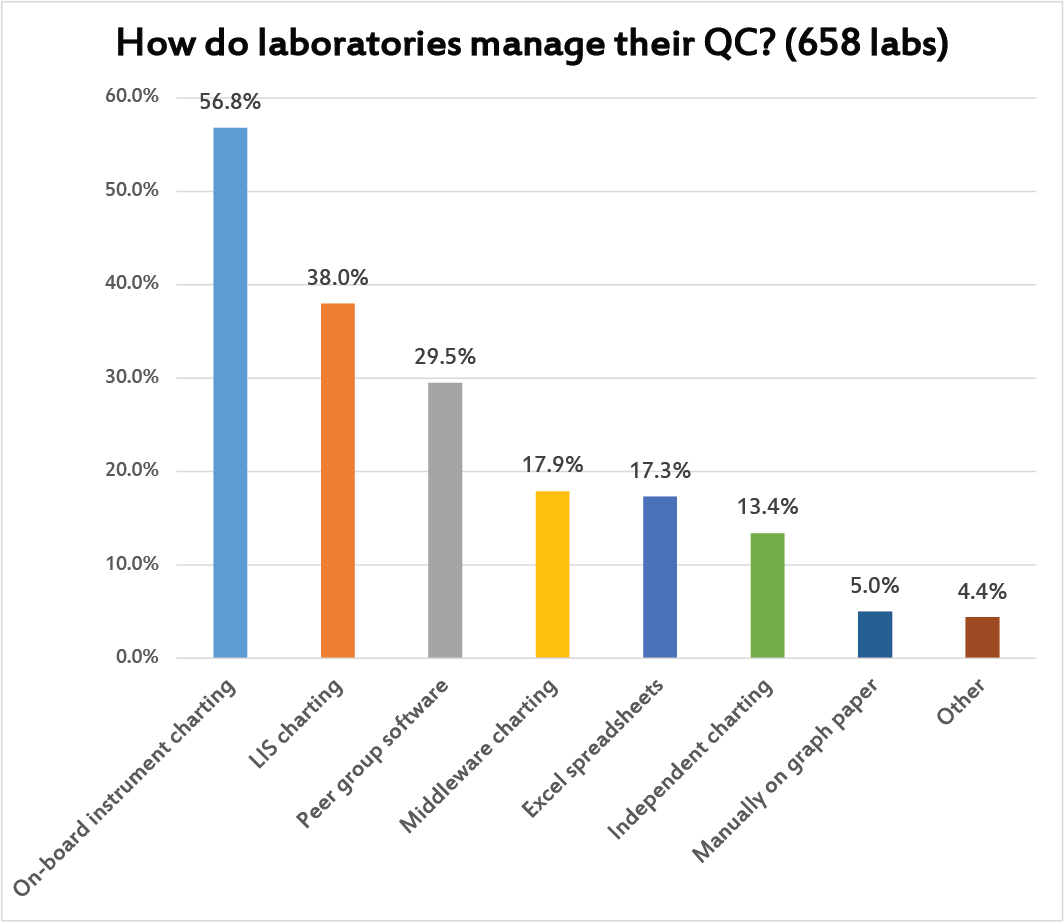
Multiple answers were allowed to this question. Most laboratories use the on-board instrument informatics to support their QC charting. After that, labs find LIS charting programs and peer group software most practical. Less than 1 in 5 laboratories are handling their charting at the middleware level (even though a lot of the middleware I see has the most advanced features for QC).
It's significant to see how many labs are using Excel spreadsheets as their primary QC tool, or standalone QC programs, or even using good old paper and pen. That may be a reflection of the variety of informatics capabilities around the world. In the US and Europe, informatics is overwhelmingly available and the resources are also available to pay for it. Elsewhere, neither of those conditions may be true.
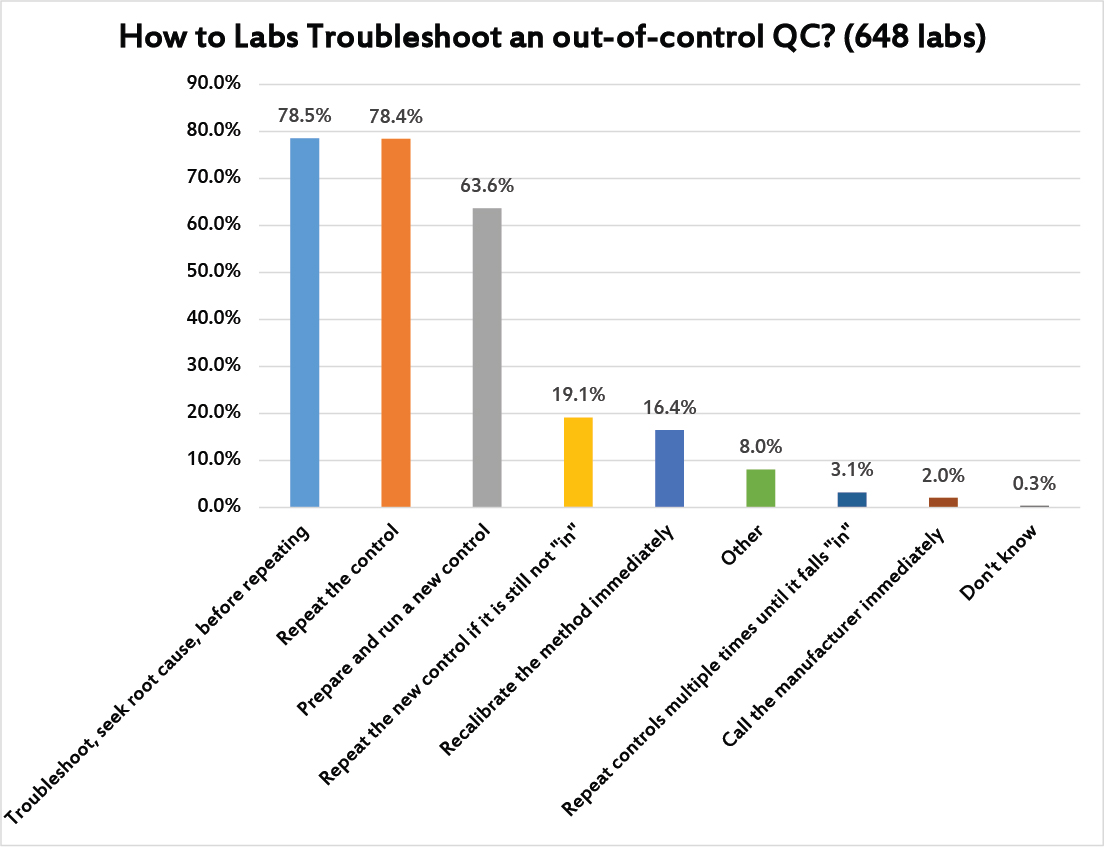
Here's one of those moments of truth. Multiple answers were allowed. The good news is the most common response (nearly 3 in 4 laboratories) was that laboratories troubleshoot first, seeking out the root cause of the problem, before they repeat any controls. However, not far behind is the simple knee-jerk response of the repeating the control (again, about 3 of 4 labs). This is followed by more than 60% of labs willing to run a new control. Then nearly 1 in 5 labs will repeat the new control to try and get it "in." It's striking that 3% of laboratories were honest enough to admit that they simple repeat the control enough times until it falls back "in," defeating the entire purpose of running controls. About 1 in 6 laboratories also have a bad habit of reflexively recalibrating the method before doing any trouble-shooting, a practice which pads the profit margins of the companies making calibrators, but not necessarily providing any real solution to instrument problems (recalibrating without troubleshooting first may mean you are recalibrating when the error was simply random, or when the error was a false rejection).
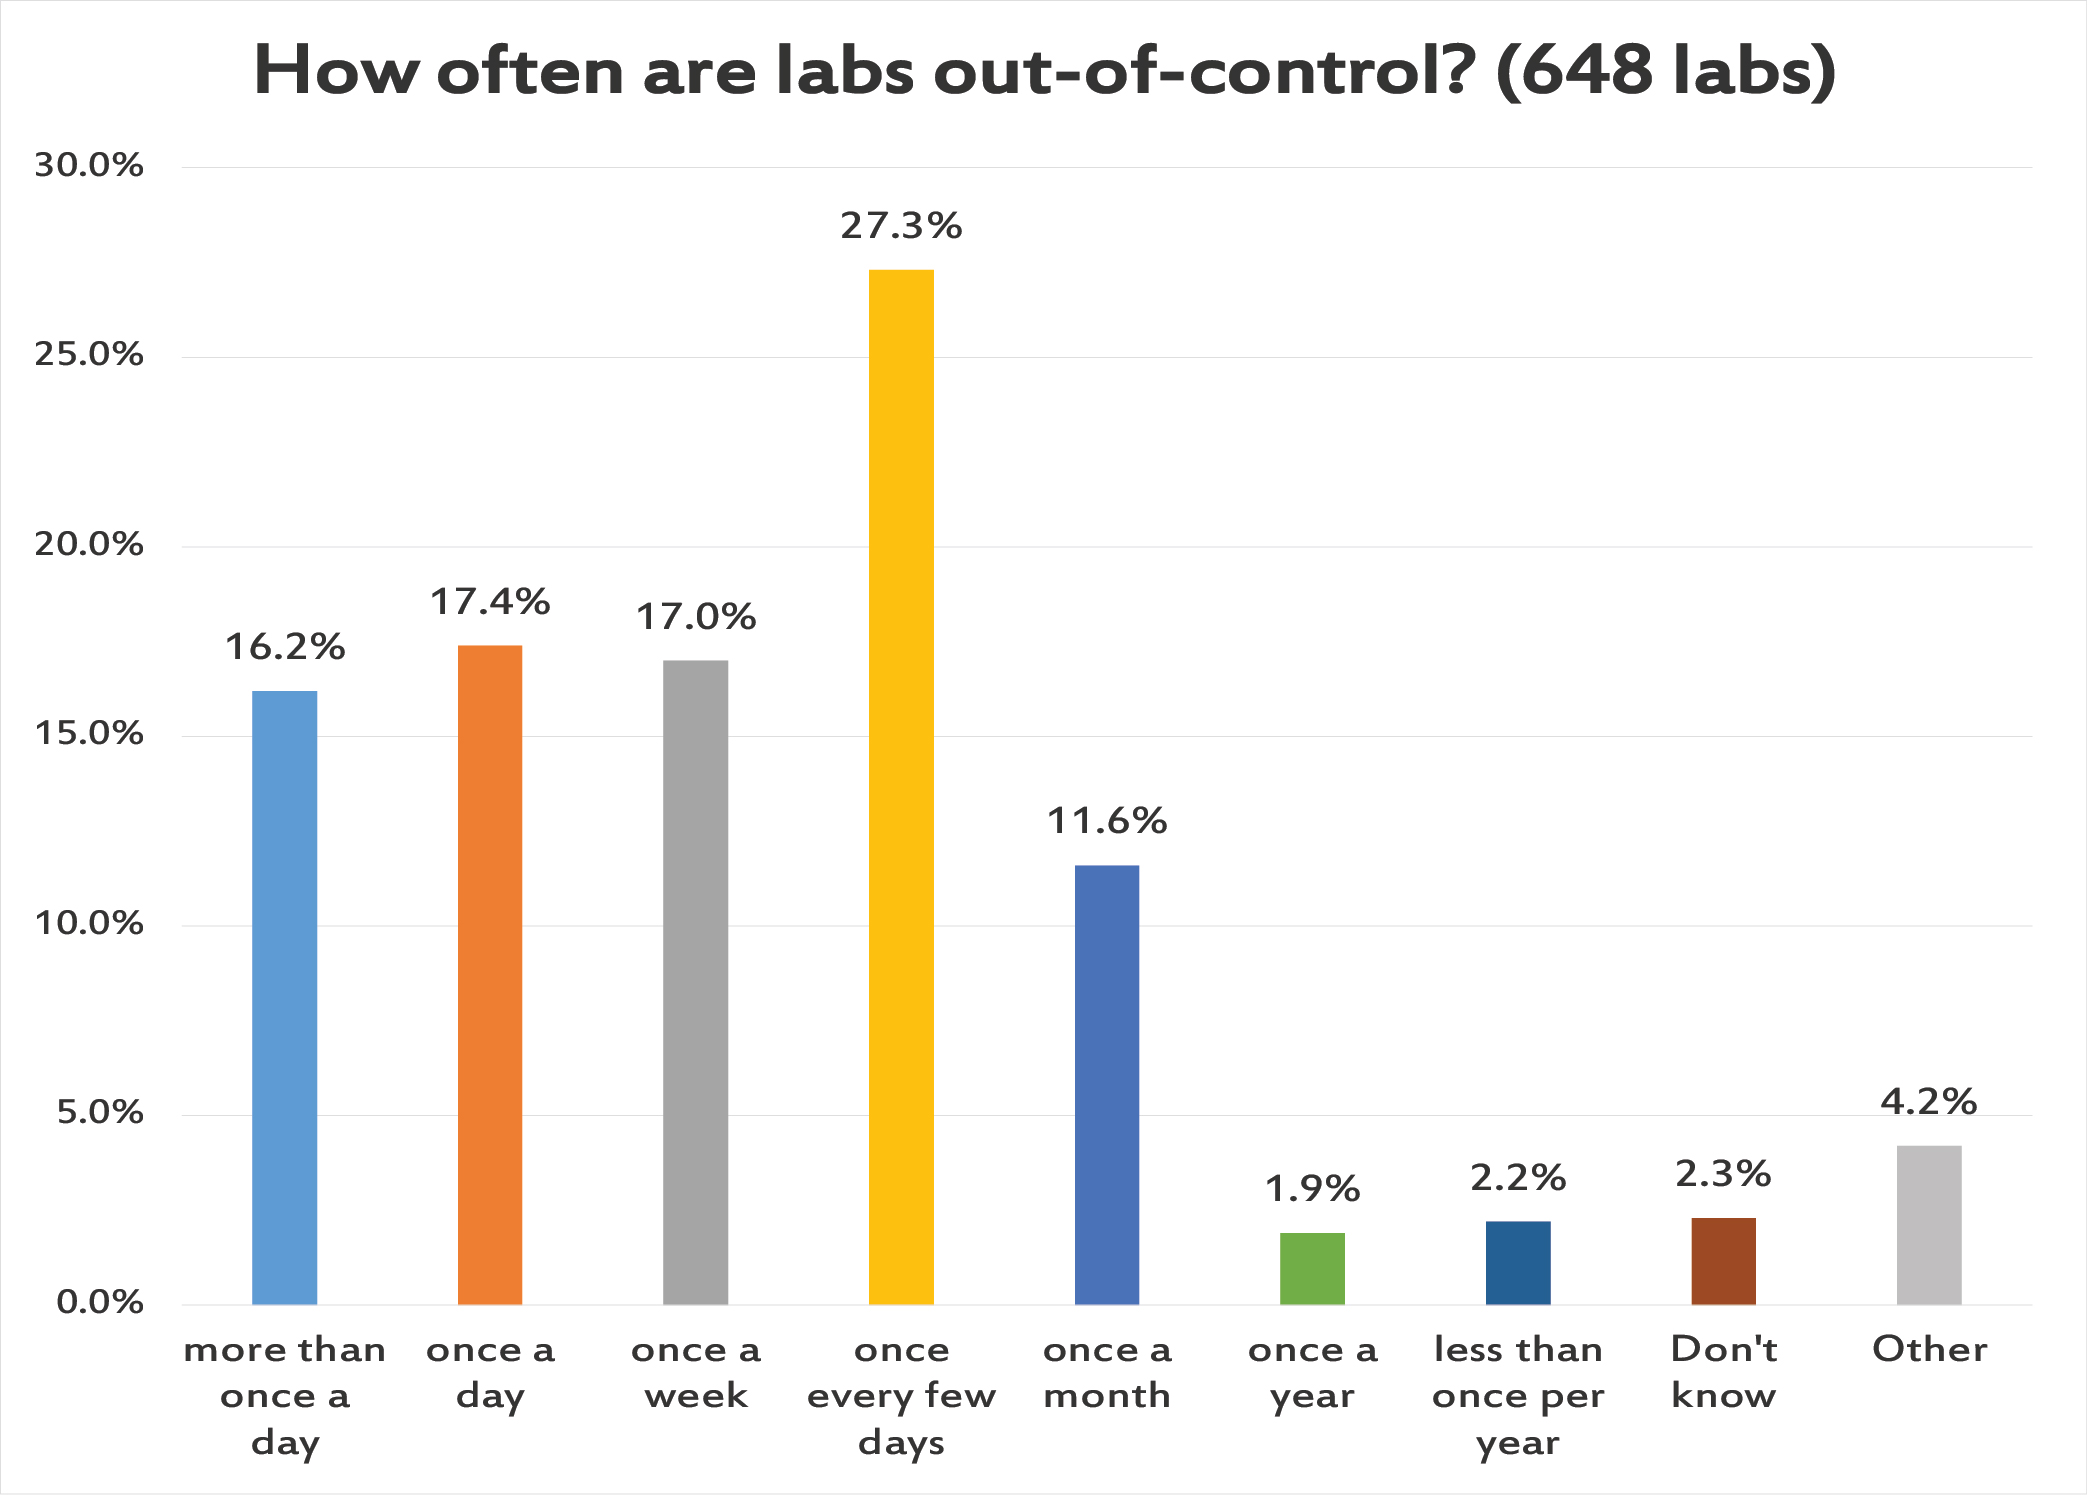
Another moment of truth. More than 1 in 6 labs has multiple out-of-control flag several times a day. Another roughly 1 in 6 labs has an out-of-control event every day. More than a quarter of laboratories have an out-of-control flag every few days. And then another roughly 1 in 6 labs has just one QC flag per week. A tiny number of labs report having very few and very rare QC flags, and we will detail later how many of those labs are just reporting on their POC and IQCPs.
The stark fact is that a third of laboratories are out-of-control every day. Now we can rationalize this by realizing that there are hundreds of tests being run in these labs, with so many controls being run every day, that false rejections are inevitable. In that way, we can tell ourselves that the constant failure isn't something that's impacting the patients, but is simply the product of our hyper-sensitive QC process. But even that reasoning has a depressing end - if we're really drowning ourselves in out-of-control flags that don't reflect any impact to patient results, this is going to generate a type of alert fatigue, where we grow deaf to the controls and stop troubleshooting and maybe even feel the impulse to ignore the QC flags completely.
A constant din of alarms going off is not something to be proud of, is not proof that you're doing QC correctly. It's probably evidence that you are over-controlling, or mis-interpreting QC. And if all those flags are driving repeats, new controls, and recalibations, this is a practice that is draining the resources and effort of the laboratory, and padding the profit margins of the control and calibrator vendors without improving patient care one iota.
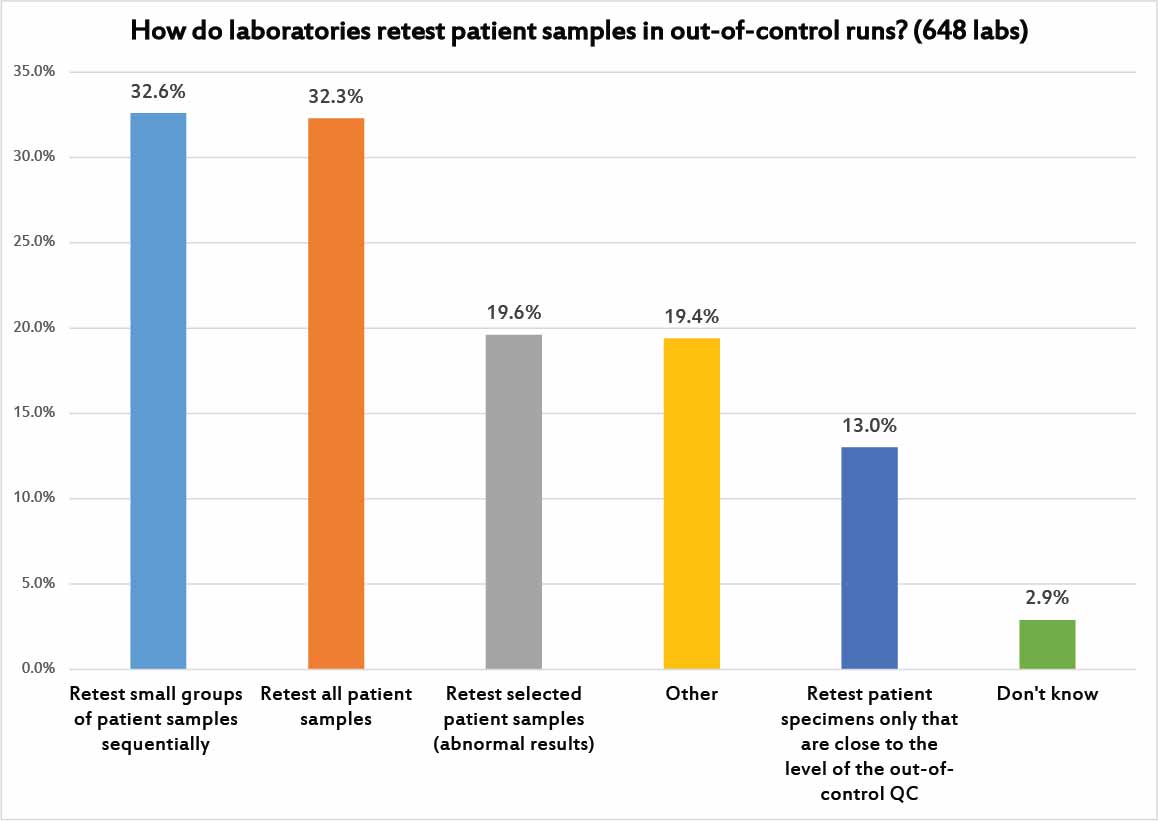
Given the chorus of alarms, it makes sense to ask how laboratories implement their patient sample retesting.
About a third of laboratories will only retest small groups of patients in sequence, for example checking to see if the most recent 10 patient samples are the same before and after the QC problem was fixed, and if there is a significant difference, testing the next 10 patient samples, and so on until they find a batch of samples where retesting shows no significant difference between the previous run and the corrected run.
Another third of laboratories adopt the standard approach: retest all patient samples from the previous run. This is how it used to be done in the old days, when run sizes were small. Most large volume laboratories don't even have the capacity to try that kind of retesting.
Less than 1 in 5 laboratories narrow their retesting even further, by either focusing only on patient results that were abnormal, or results that were near the same level as the control that was "out."
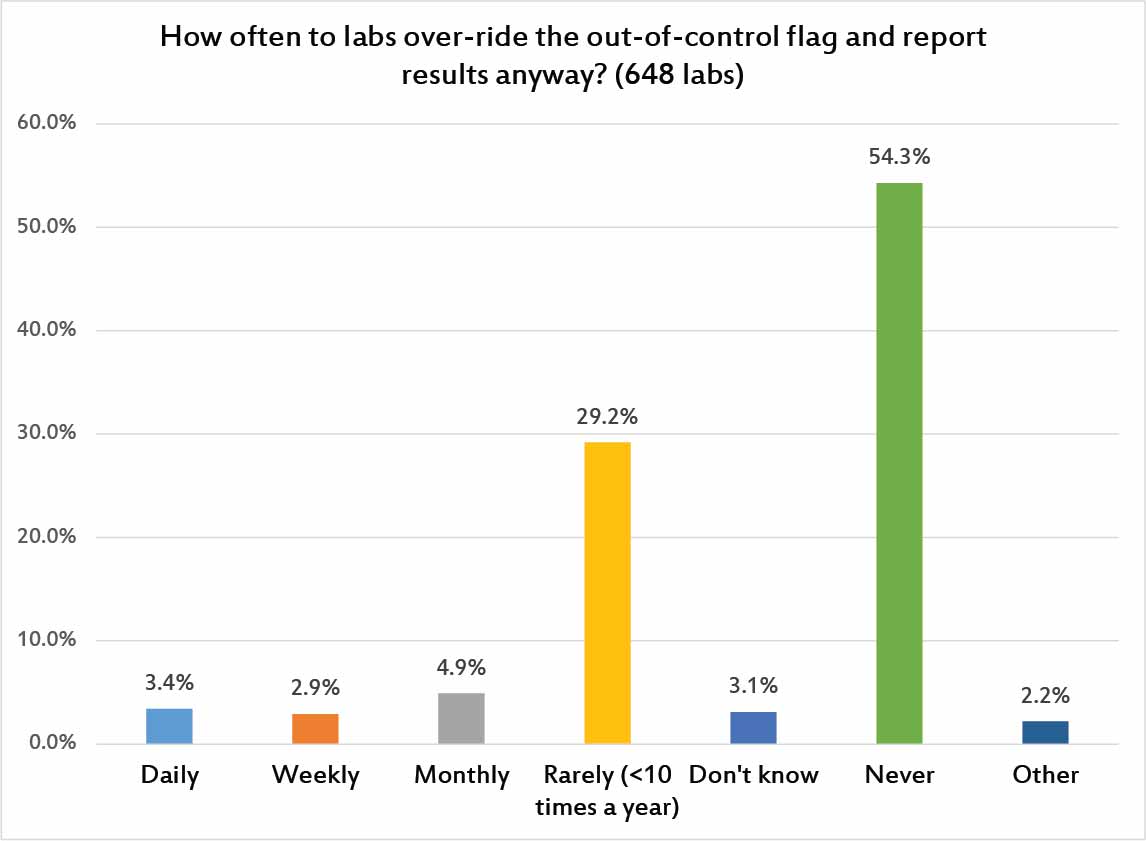
Here's the problem with all of the poor control-limit-settting and control-repeating-and-repeating habits and never-ending out-of-control flags: they corrode our trust in our own QC. Ultimately, laboratories begin to distrust their own QC flags and start releasing results despite out-of-control flags. 1 in 10 laboratories are releasing patient results at least once a month, once a wek, or once a day, in defiance of the QC signals. It's sad to think all that QC effort is being expended, only to be ignored. Thankfully, there are a majority of laboratories that report they NEVER do this, and another nearly third of laboratories that do it rarely.
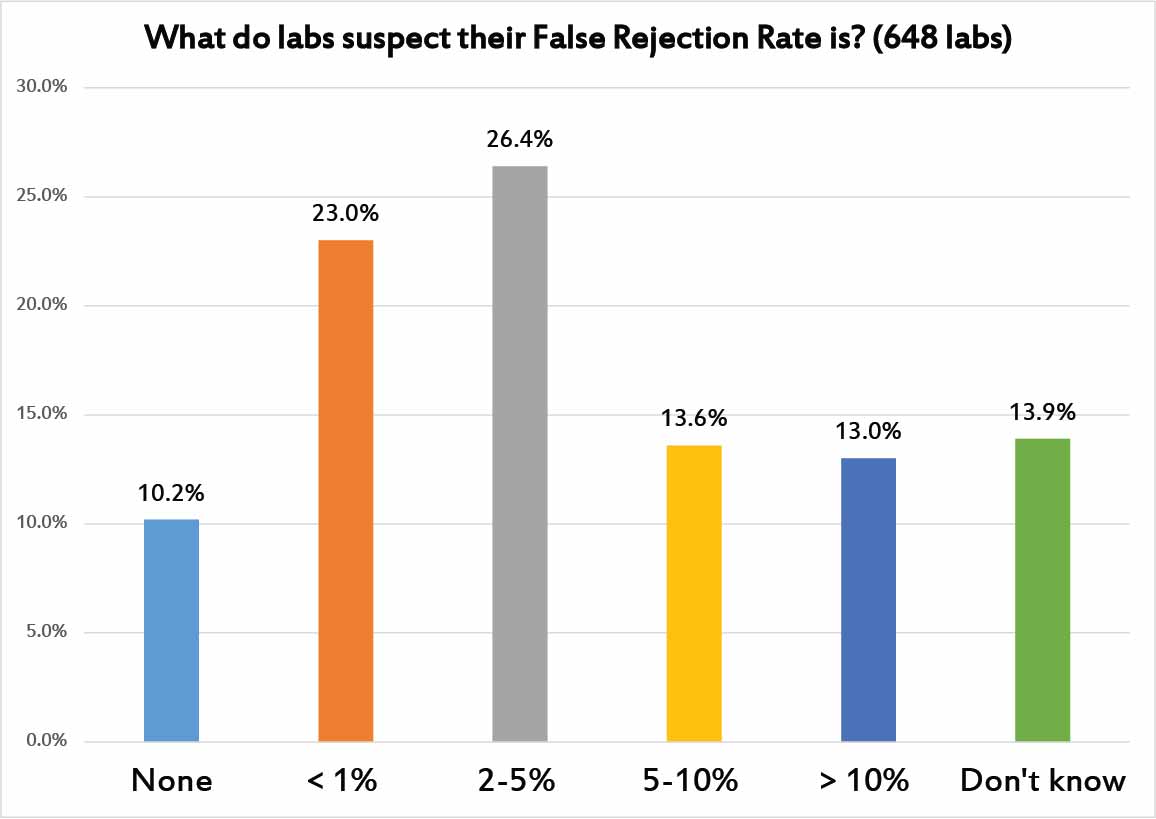
Out of curiousity, we decided to ask laboratories what they suspect is the rate of false rejection in their control results. That is, how many of their controls do they believe are false flags? There are 10% of laboratories that believe there are no false rejections - that is sweet but untrue. Another near-quarter of laboratories think that false rejection rate is below 1%. Also entirely too optimistic.
Another quarter of laboratories have a more realistic sense of false rejection: between 2 and 5%, which is probably where we should hope our false rejection rates should be. But another quarter of laboraties think the false rejection rates are 5%, 10%, or even higher. If this is true, those laboratories should be taking action to try and save themselves from this tidal wave of false rejections. Any process that has a built-in false rejection rate higher than 5% or 10% is consuming a huge amount of your time with self-inflicted, non-value-added waste. Chasing down all these false rejections is an expense that no laboratory can afford to indulge.
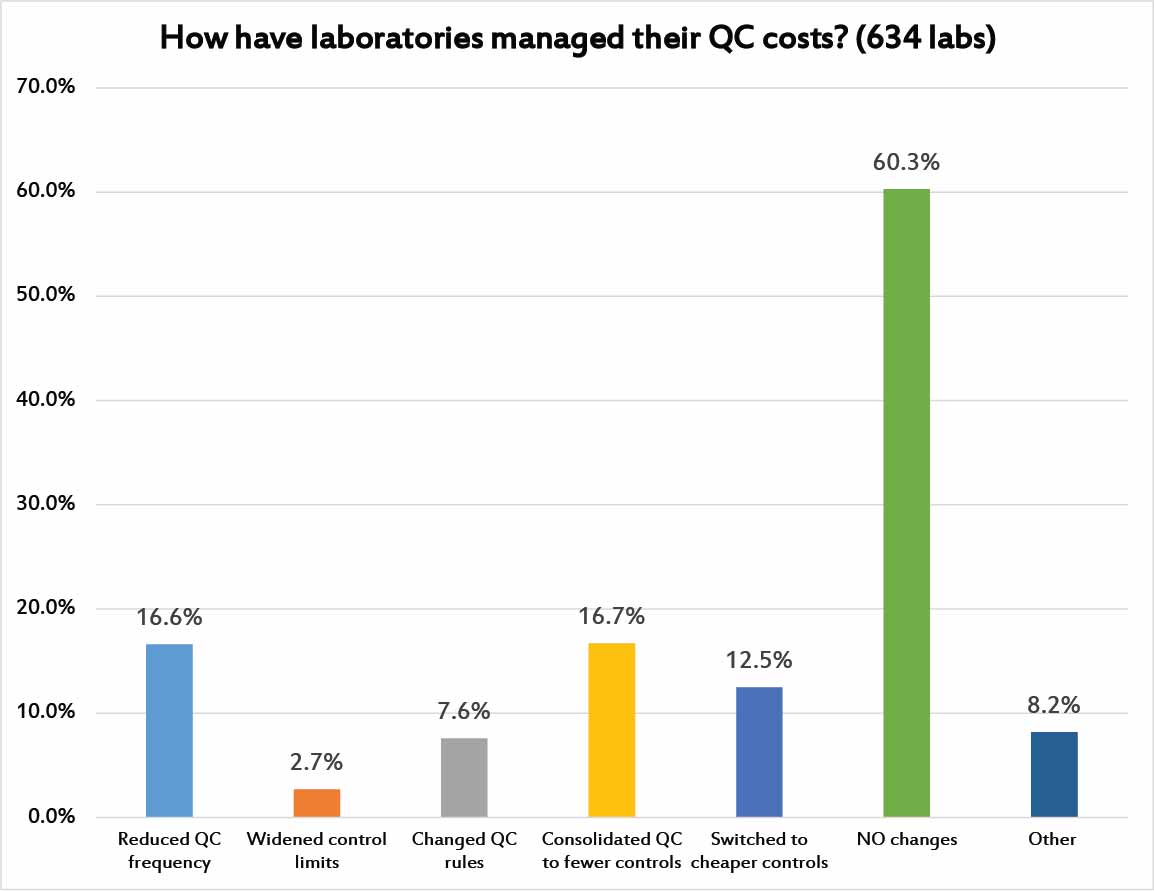
Finally, we asked laboratories if they had taken any steps to try and manage the costs of their Quality Control practices. 60% of laboratories have taken NO steps toward managing the cost of their quality efforts. 1 in 6 laboratores have consolidated their QC into fewer controls. Andother 1 in 6 laboratories have reduced their QC frequency. 1 in 8 laboratories have switched to cheaper controls. Less than 1 in 10 laboratories have changed their QC rules or widened their limits in an effort to manage costs.
Some of these changes might be warranted or not. Some labs may need to invest MORE in QC rather than less, if they are exhibiting poor practices or are running poor quality methods. The survey was not designed to assess the state of any individual laboratory, but merely to get a holistic sense of the global laboratory marketplace.
Conclusion
In an era of shrinking budgets and constrained staffing, most laboratories around the globe are going to have to figure out how to implement Quality Control more efficiently and effectively. The Global QC Survey tells us that there are a lot of inefficient or imperfect implementations of Quality Control. There is massive room for improvement in QC practices. Given the financial futures of testing reimbursement for most laboratories, this opportunity for improvement is really an imperative for change. Like so many parts of current healthcare, the current state of QC is unsustainable. Laboratories must change and adopt better approaches, or they will risk their continuing viability, or worse still, risk the patients with poor quality results.
For a free copy of these graphs, go to our download section.