Basic QC Practices
The Great Global QC Survey: Results from US Laboratories
Just under 40% of the Great Global QC Survey respondents were from the US. Here we focus on the laboratories of the United States and see how, if at all, they differ in QC practices from their global counterparts.
2017 Quality Control Practices in Laboratories in the United States
June 2017
Sten Westgard, MS
The virtue of a large global survey with a lot of responses is that we can "slice and dice" the data so that we can get insight into different segments of the marketplace. The largest set of respondents, over 38% (more than 350 labs), was from the United States. So we have enough responses here to make a special US-focused breakdown and analysis.
For a free copy of these graphs, go to our download section.
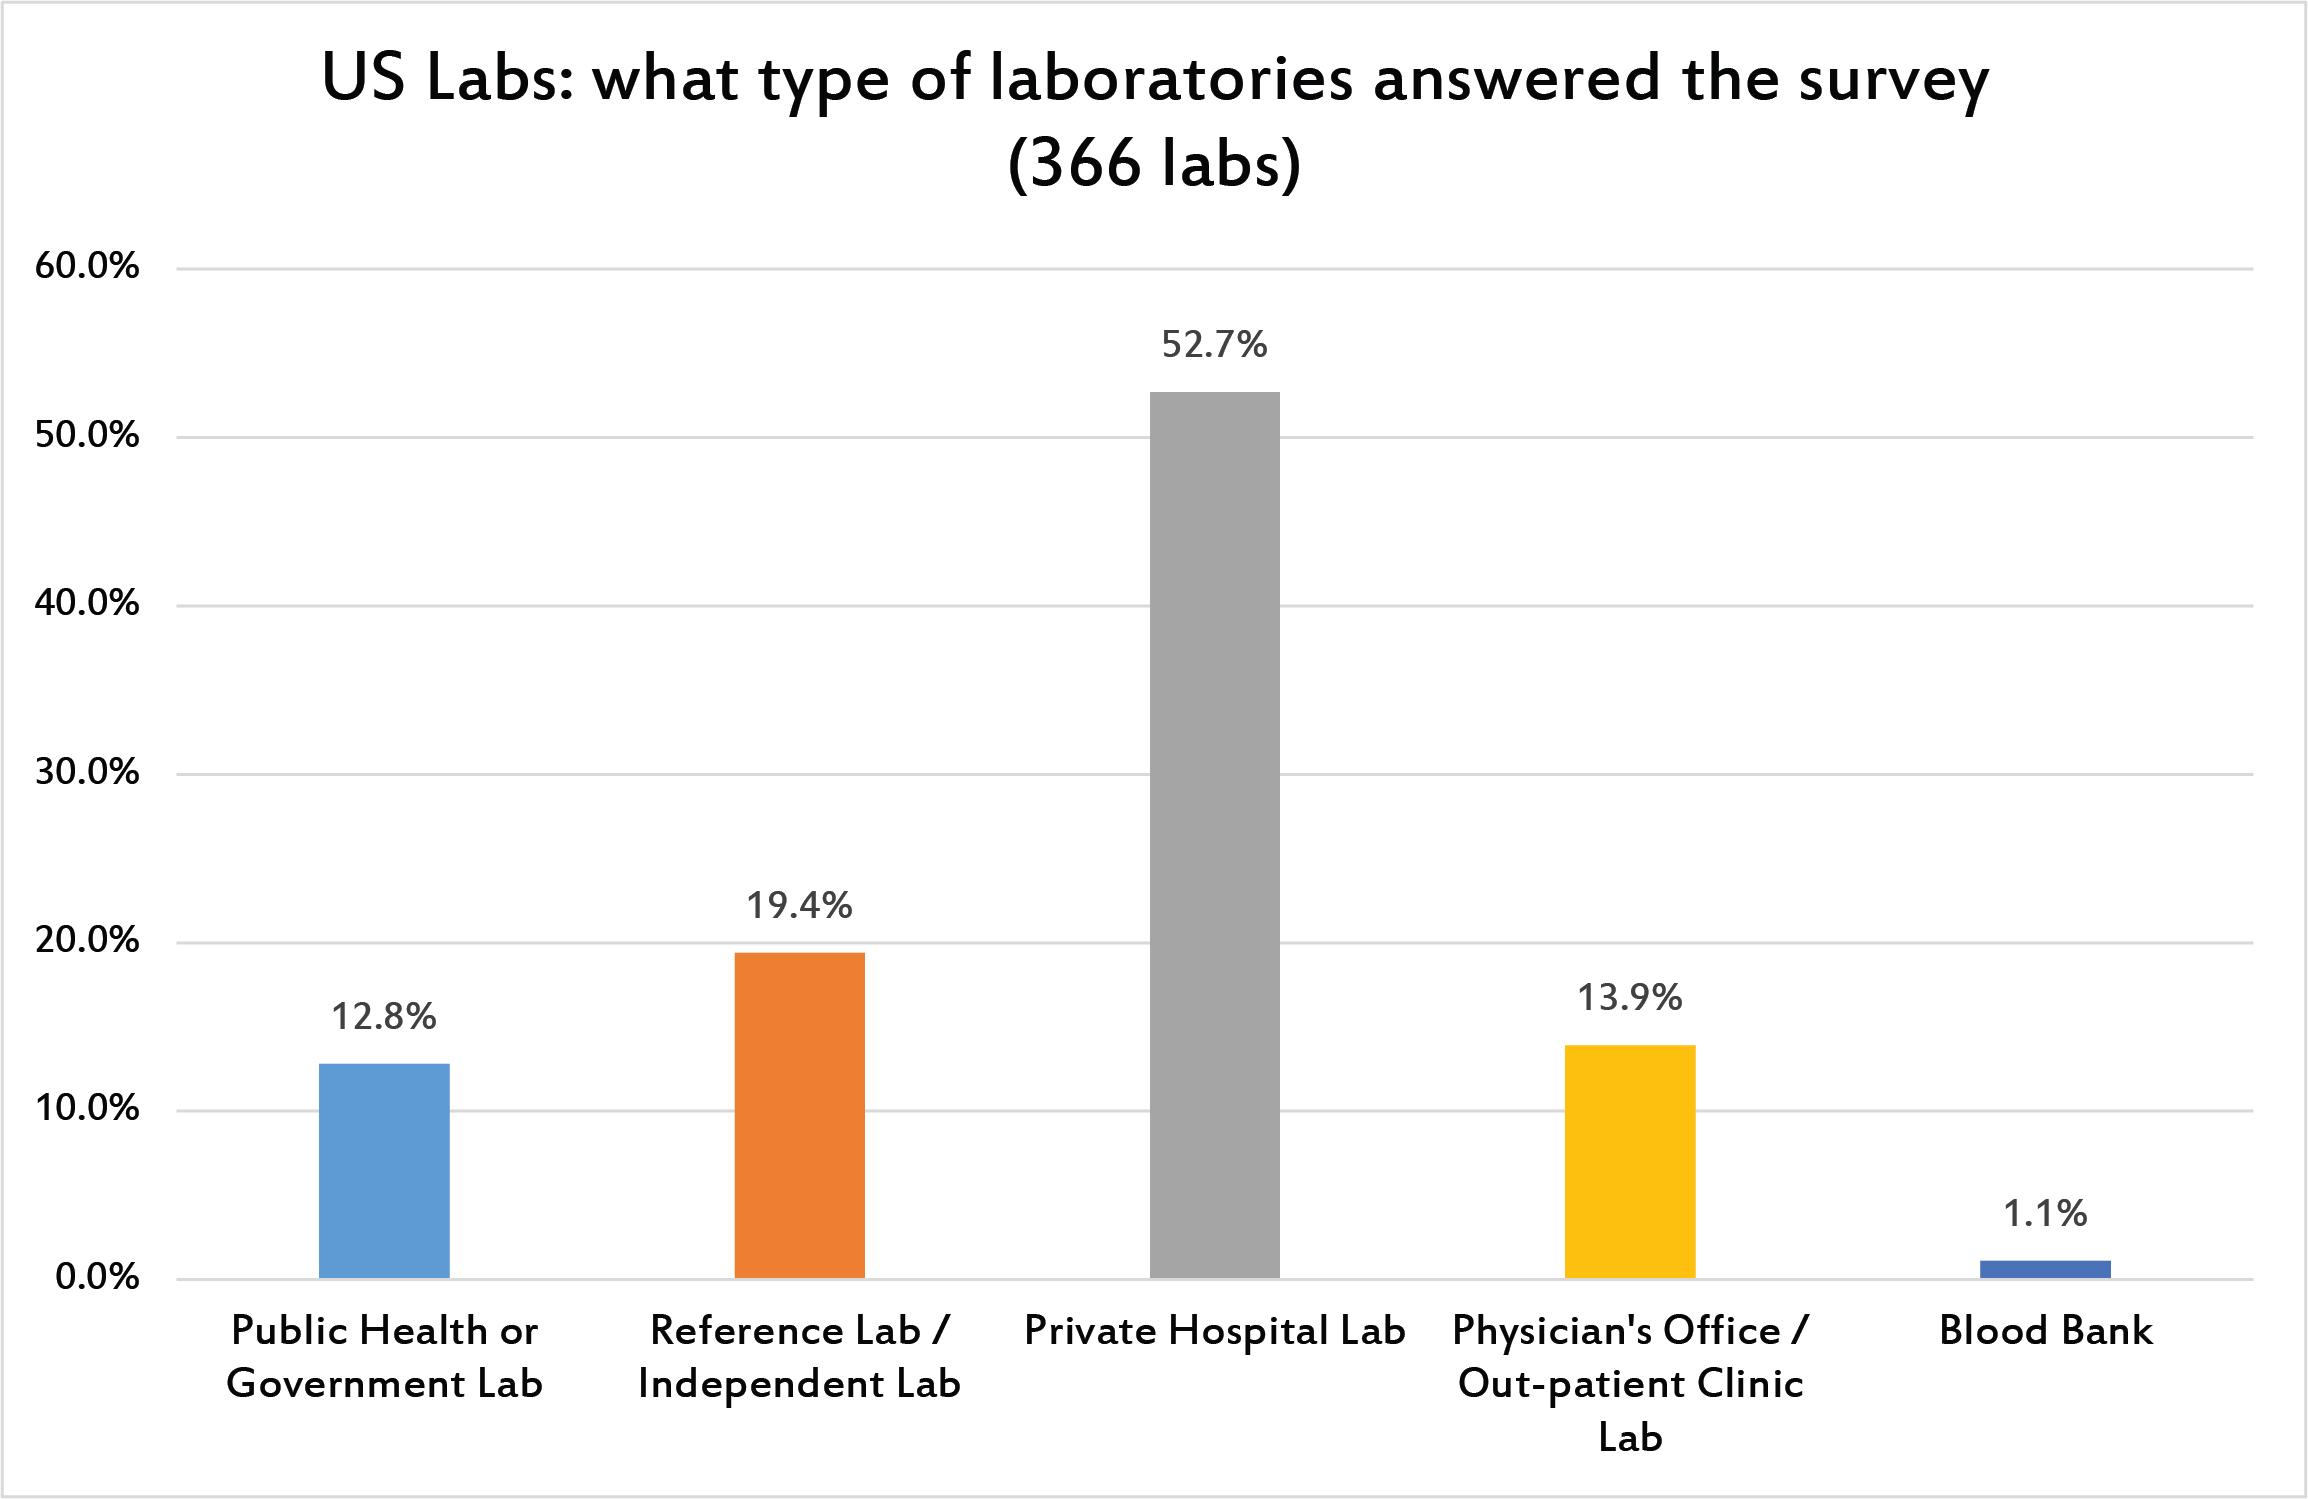
Mostly private laboratories answered the survey.
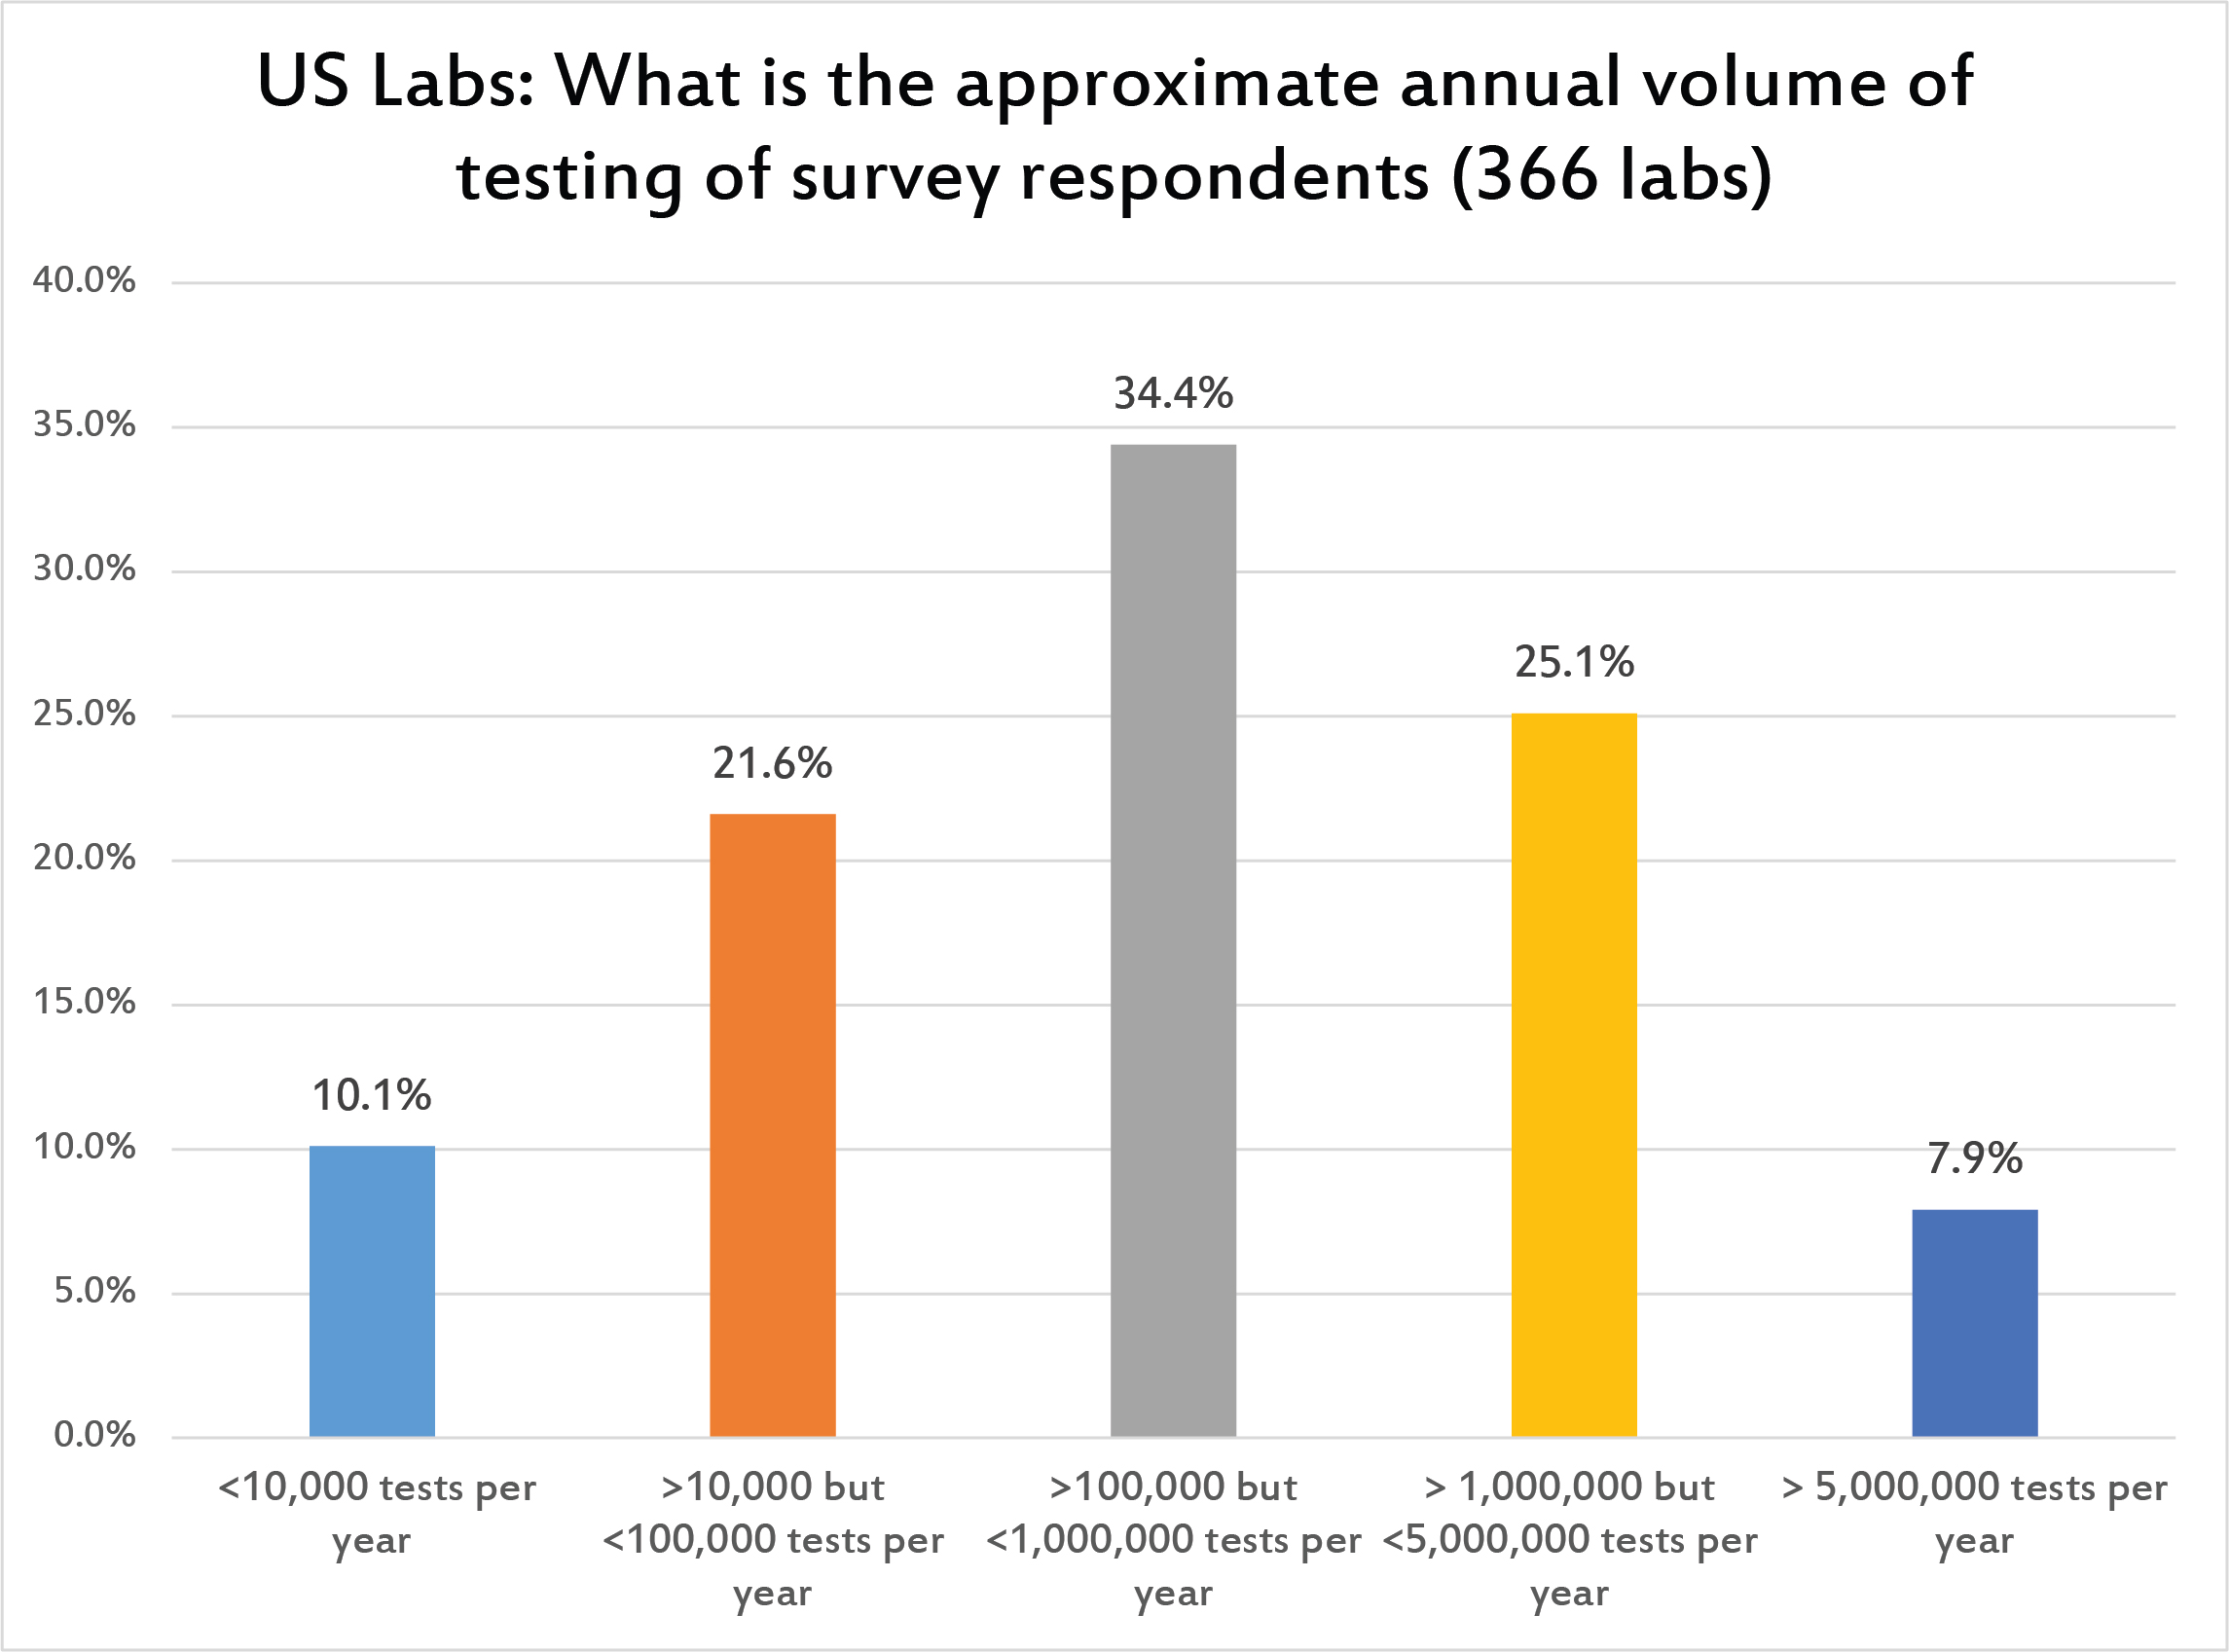
The most common volume of laboratories is less than 1 million tests per year but more than 100,000 tests per year.
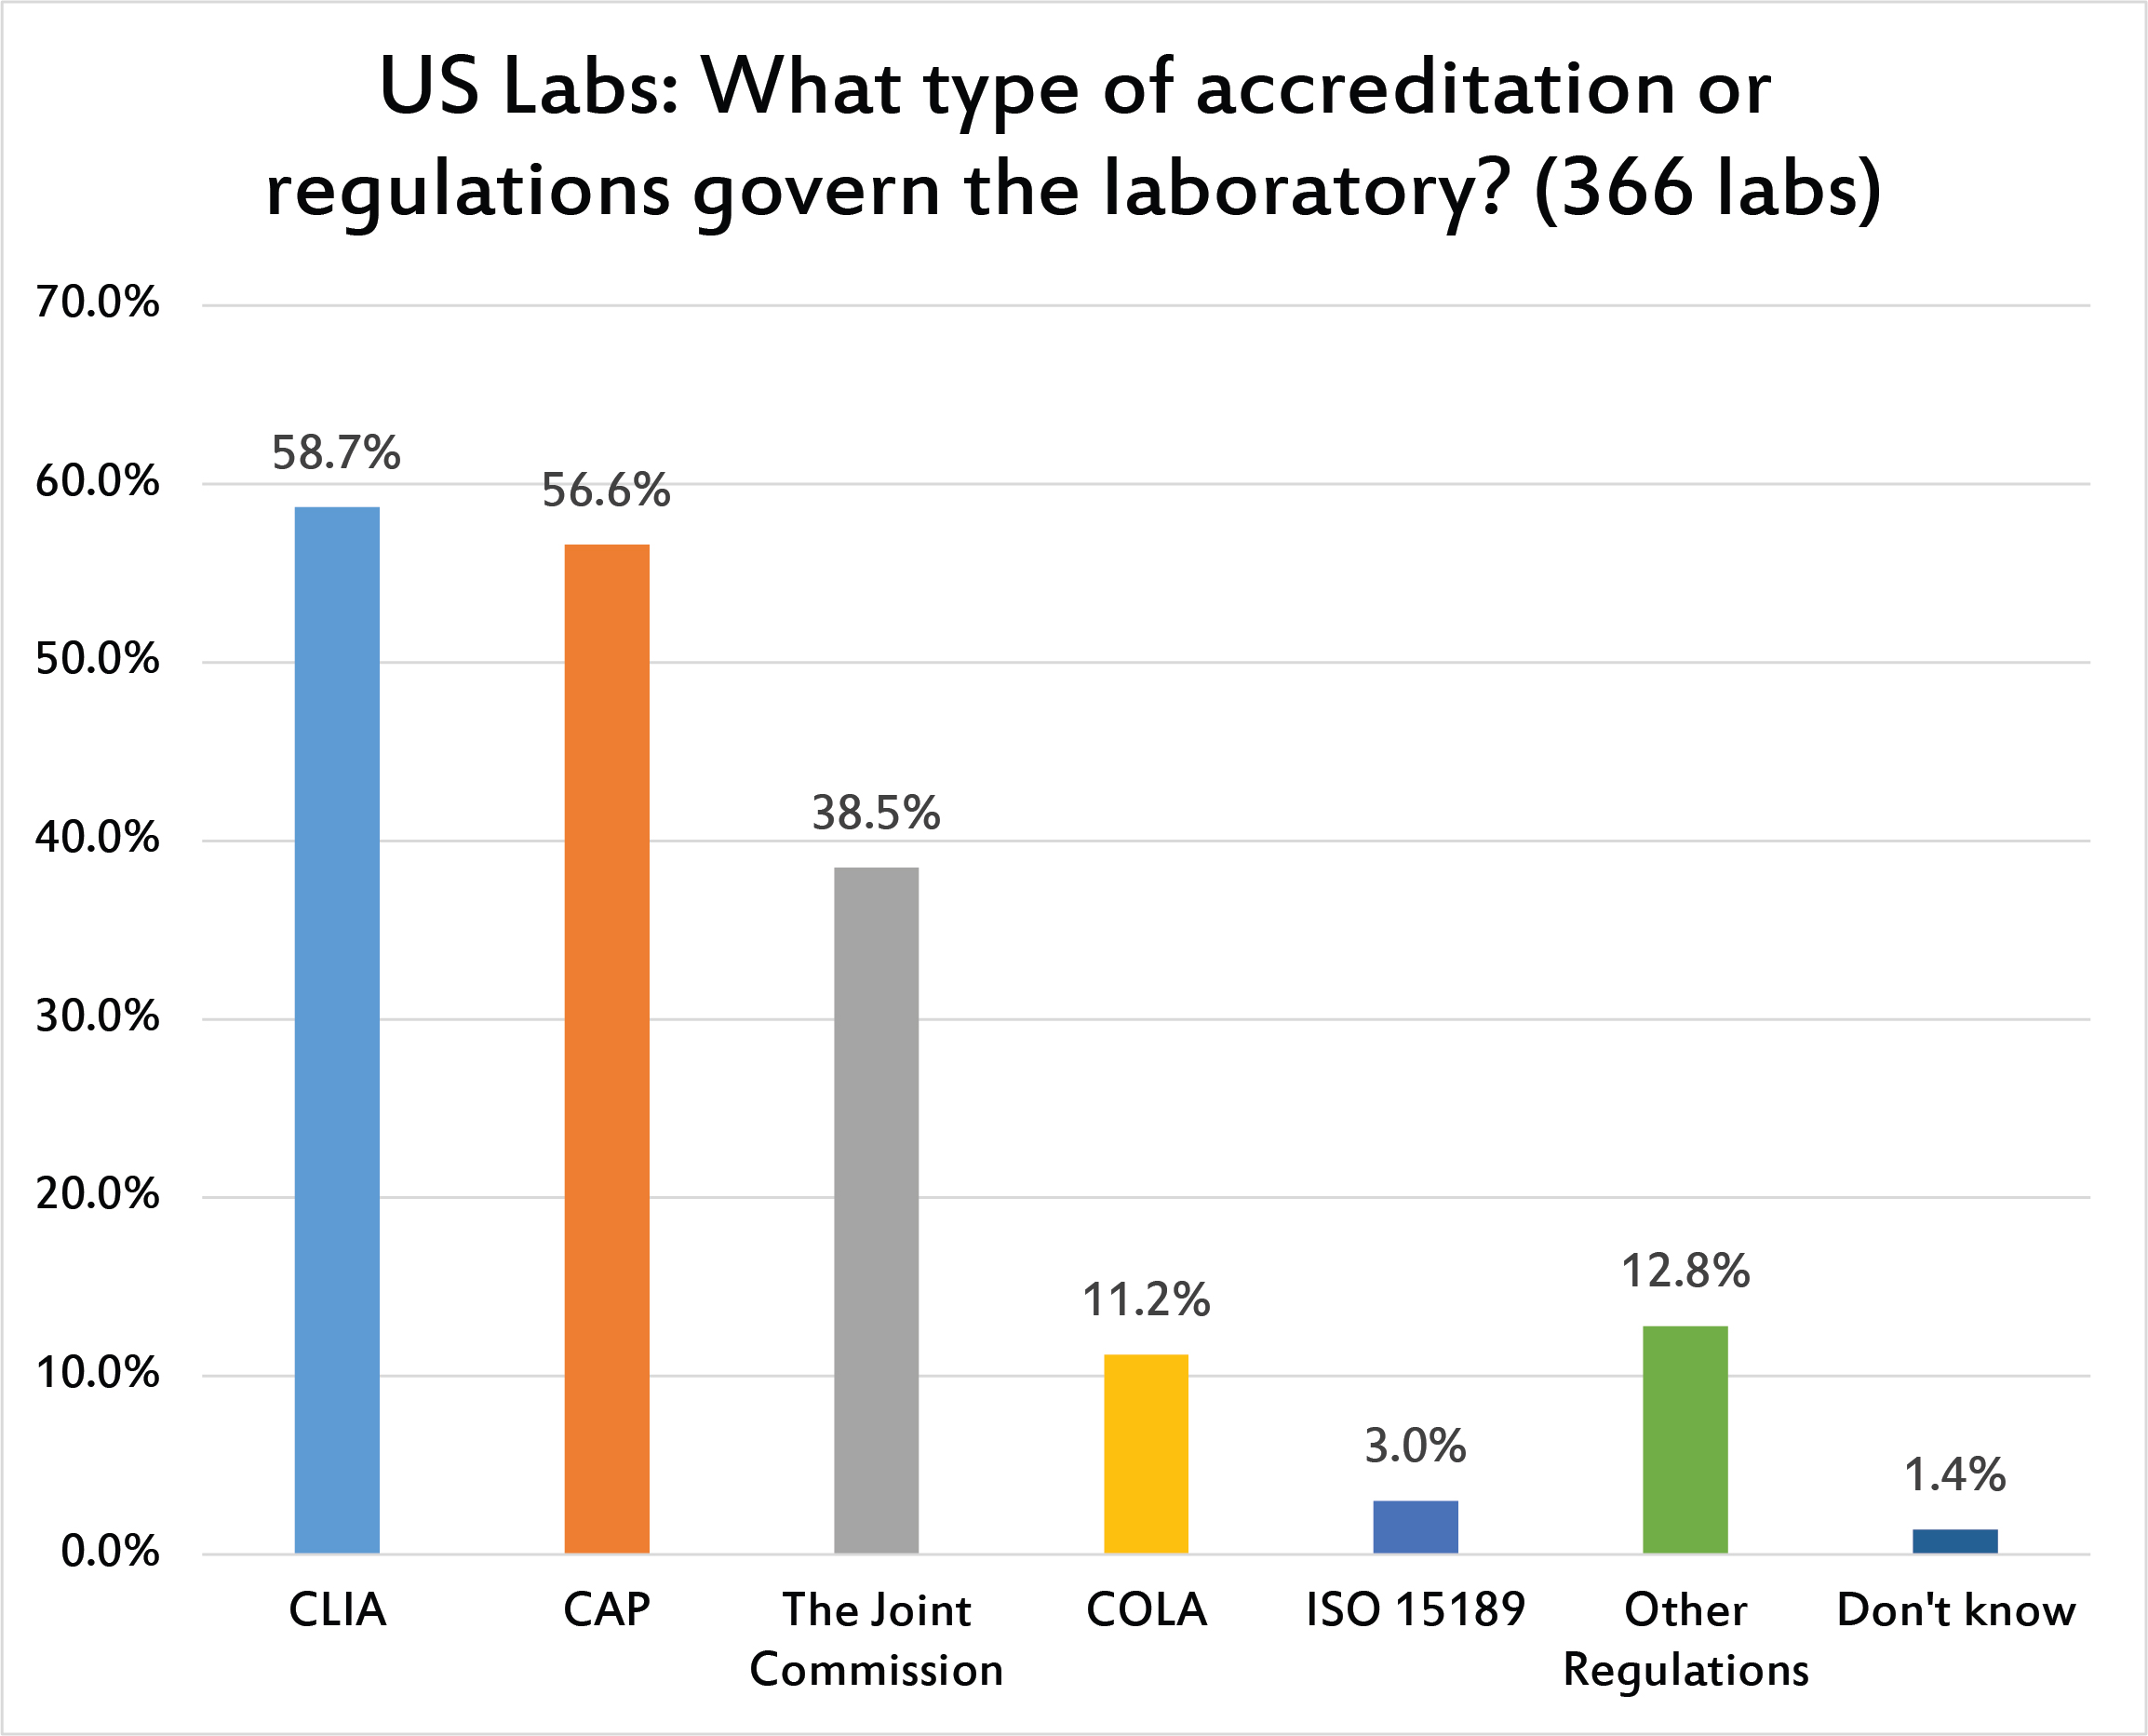
Not surprisingly, CLIA is the dominant influence on US laboratories, followed by CAP or The Joint Commission. One can see that the influence of ISO 15189 is very minimal in the United States. This is in stark contrast to the rest of the word, where ISO plays a central role.
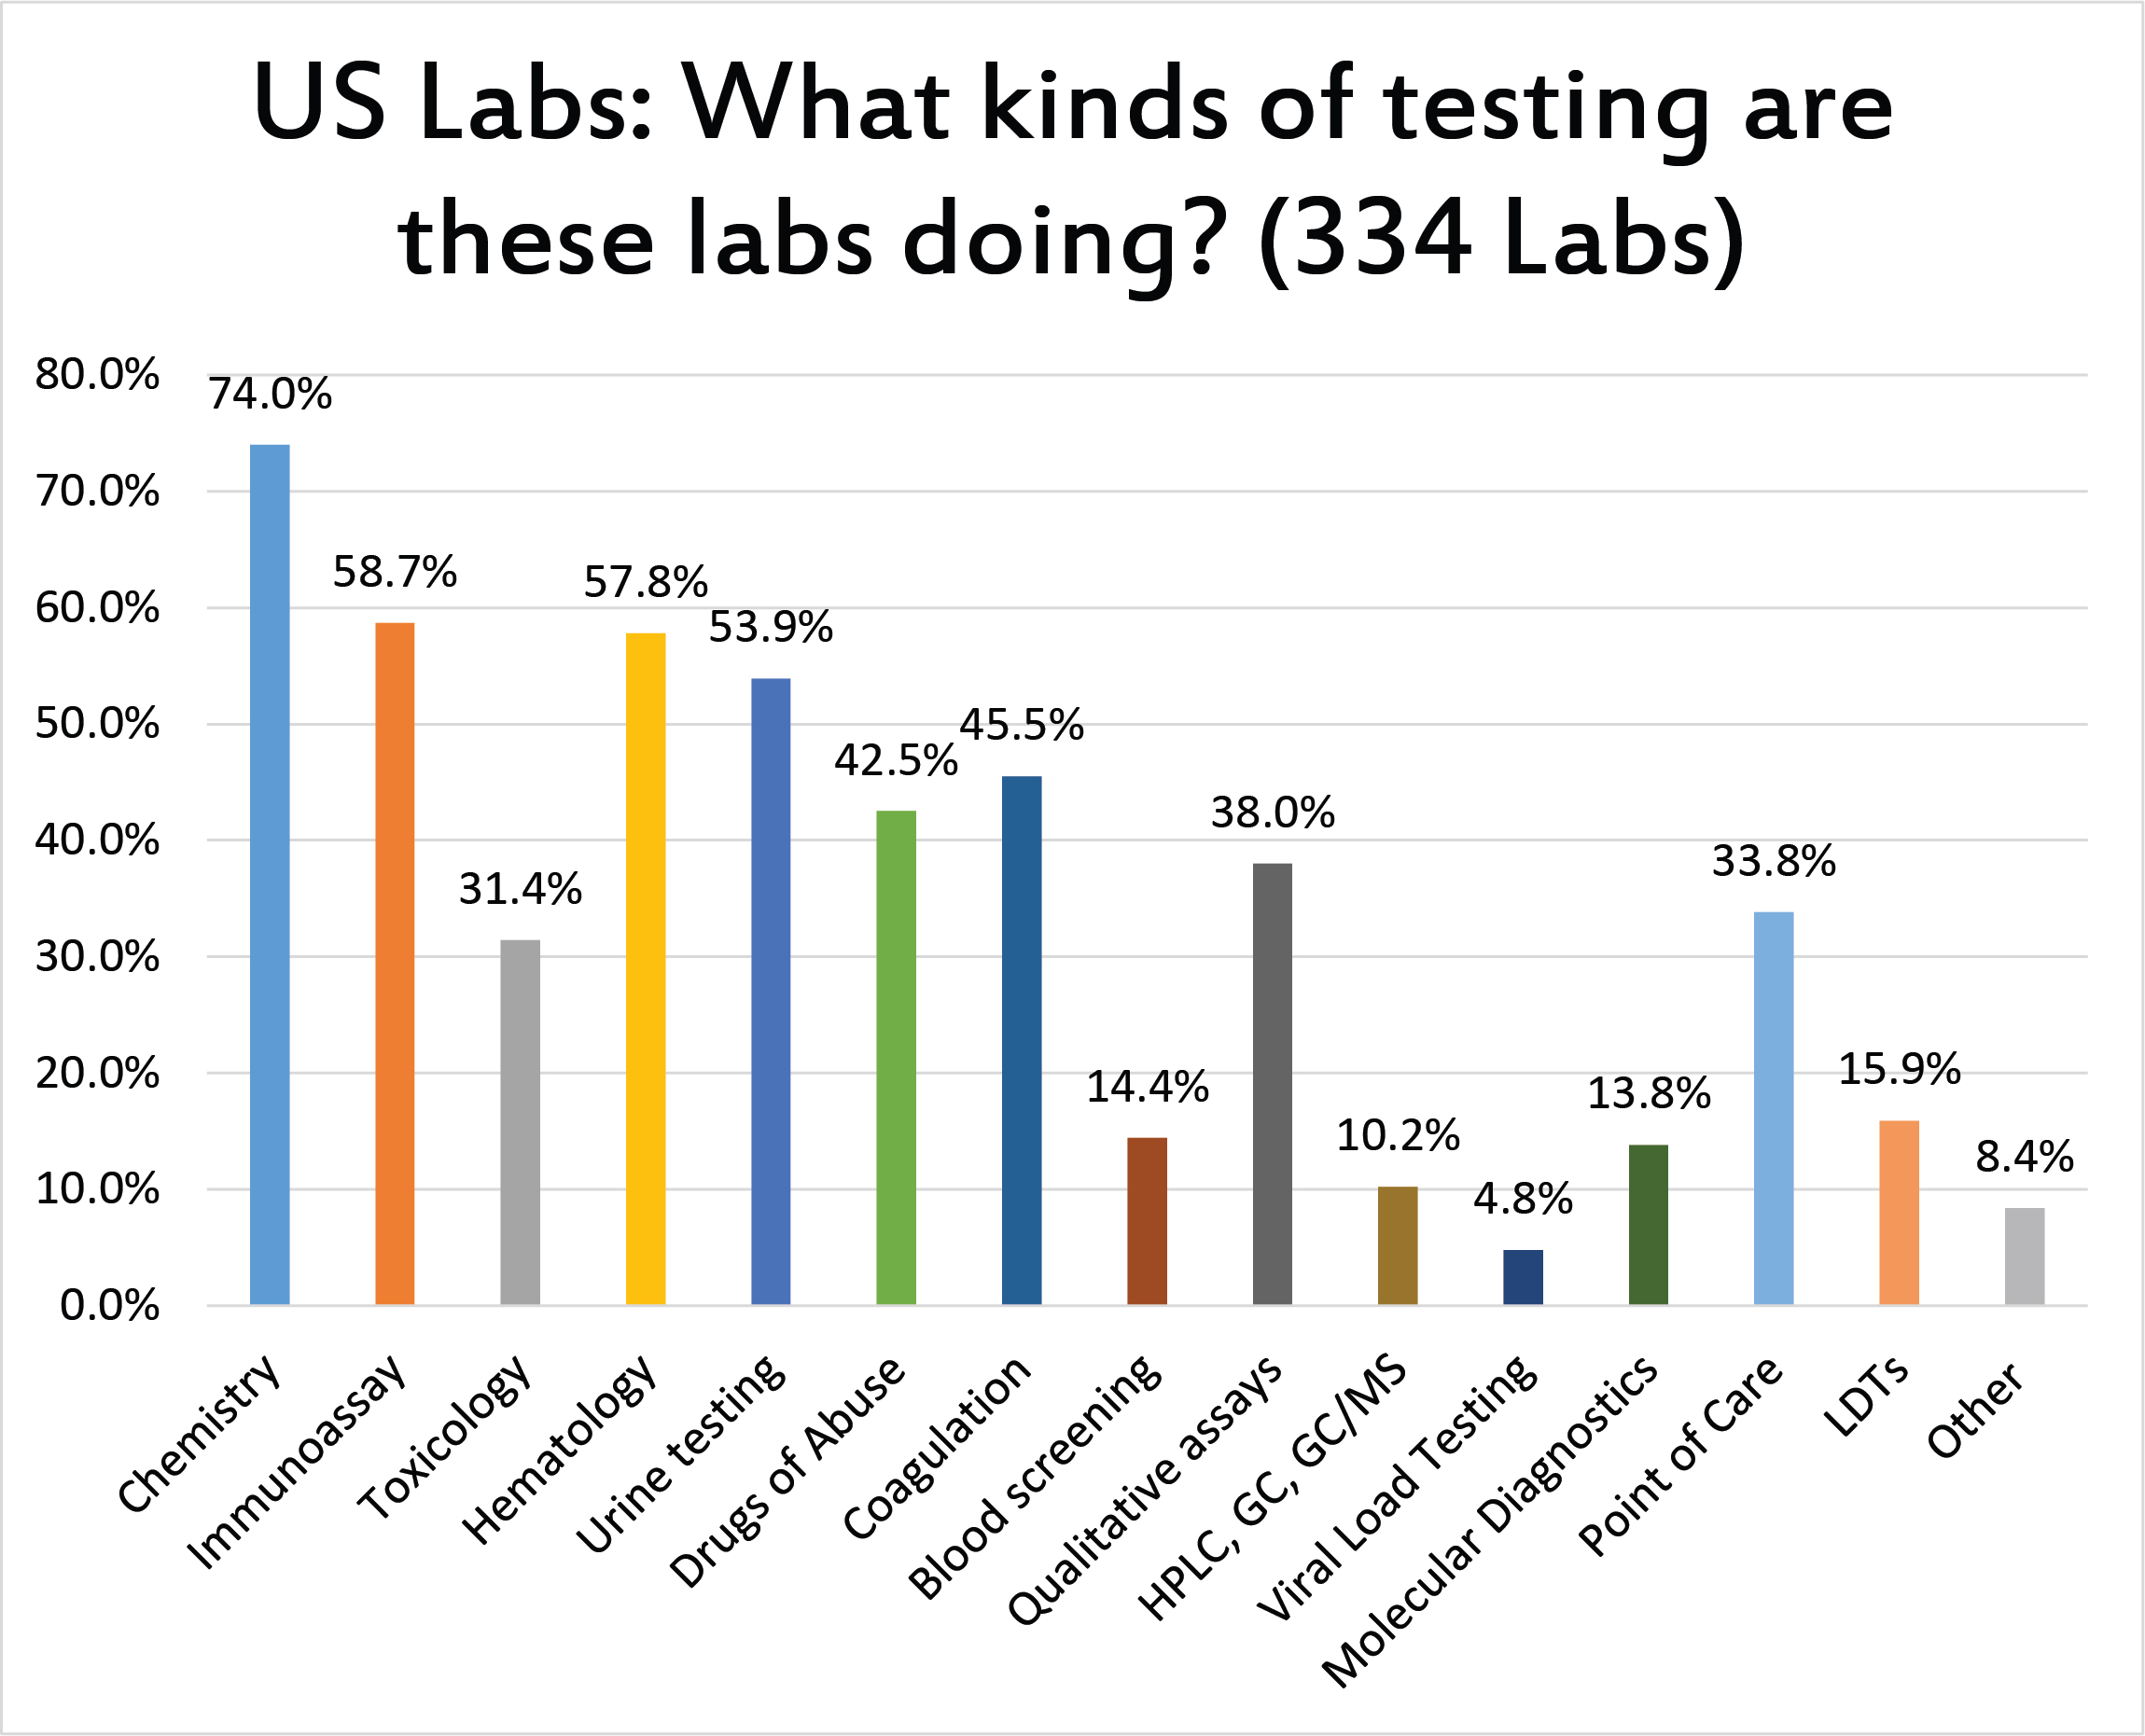
A very high percentage of the lab respondents run chemistry, and the majority also run immunoassay, hematology, and urine testing.
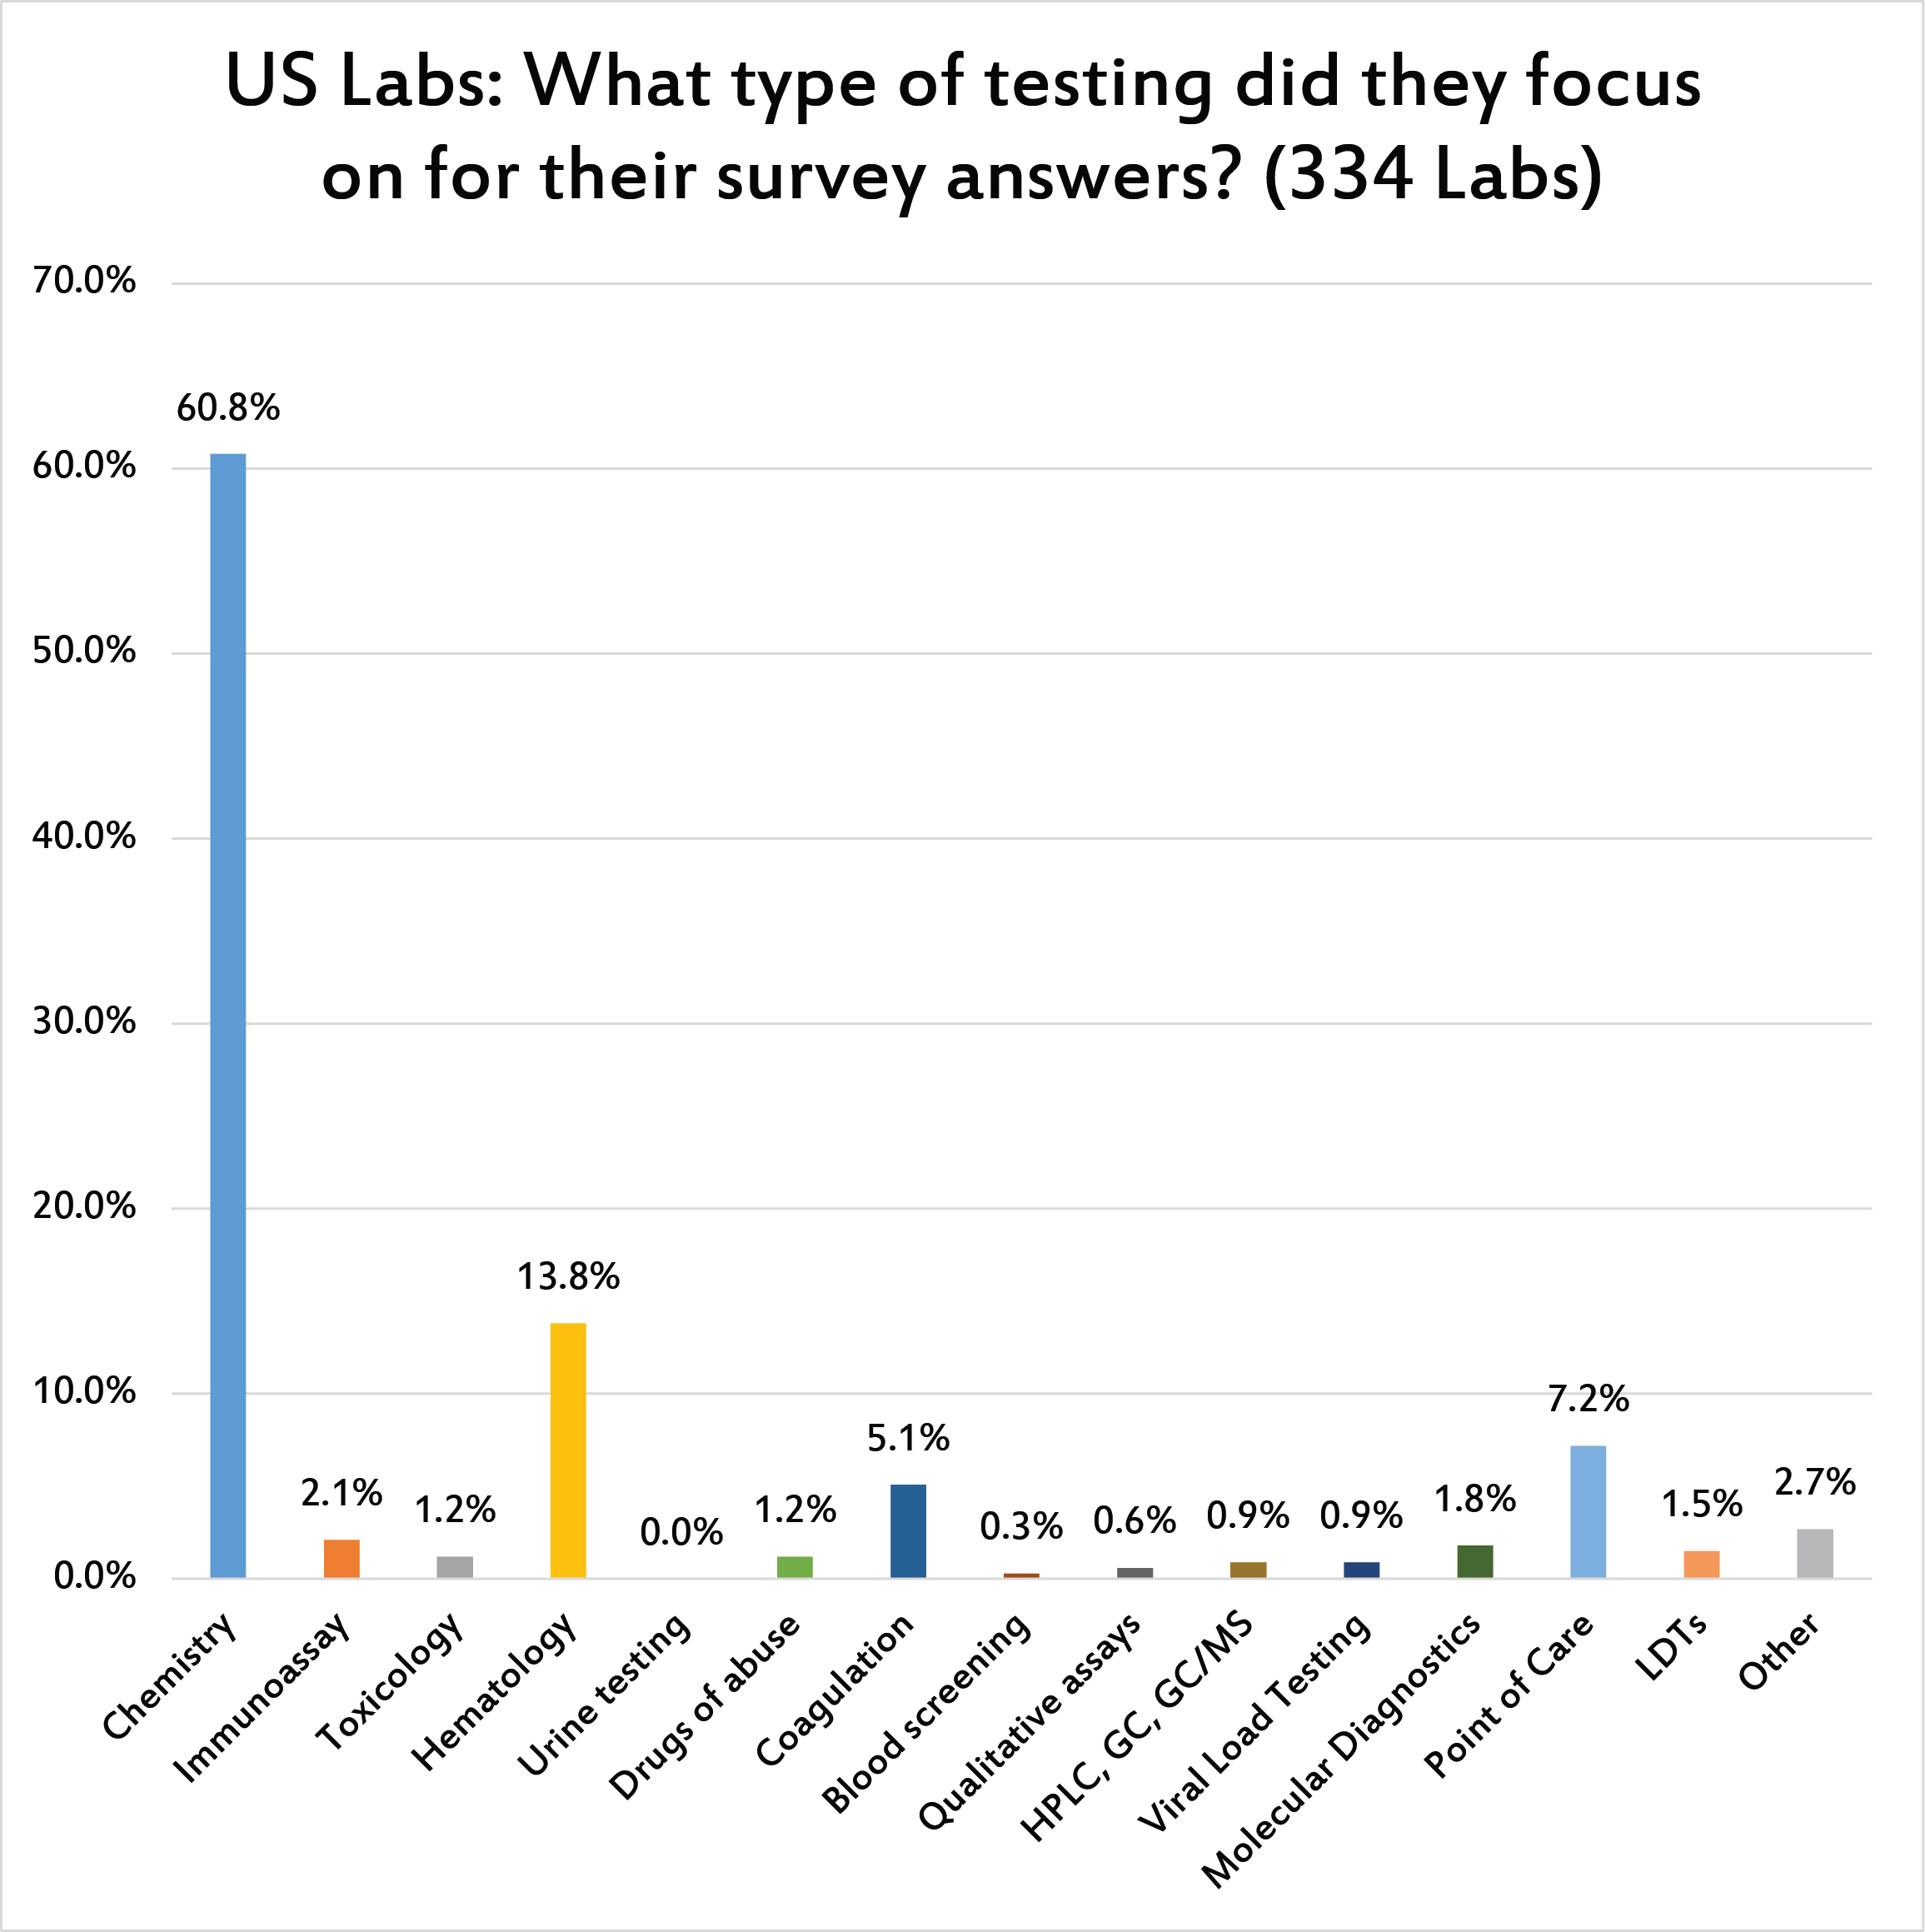
The majority of survey responses were gathered about chemistry QC practices.
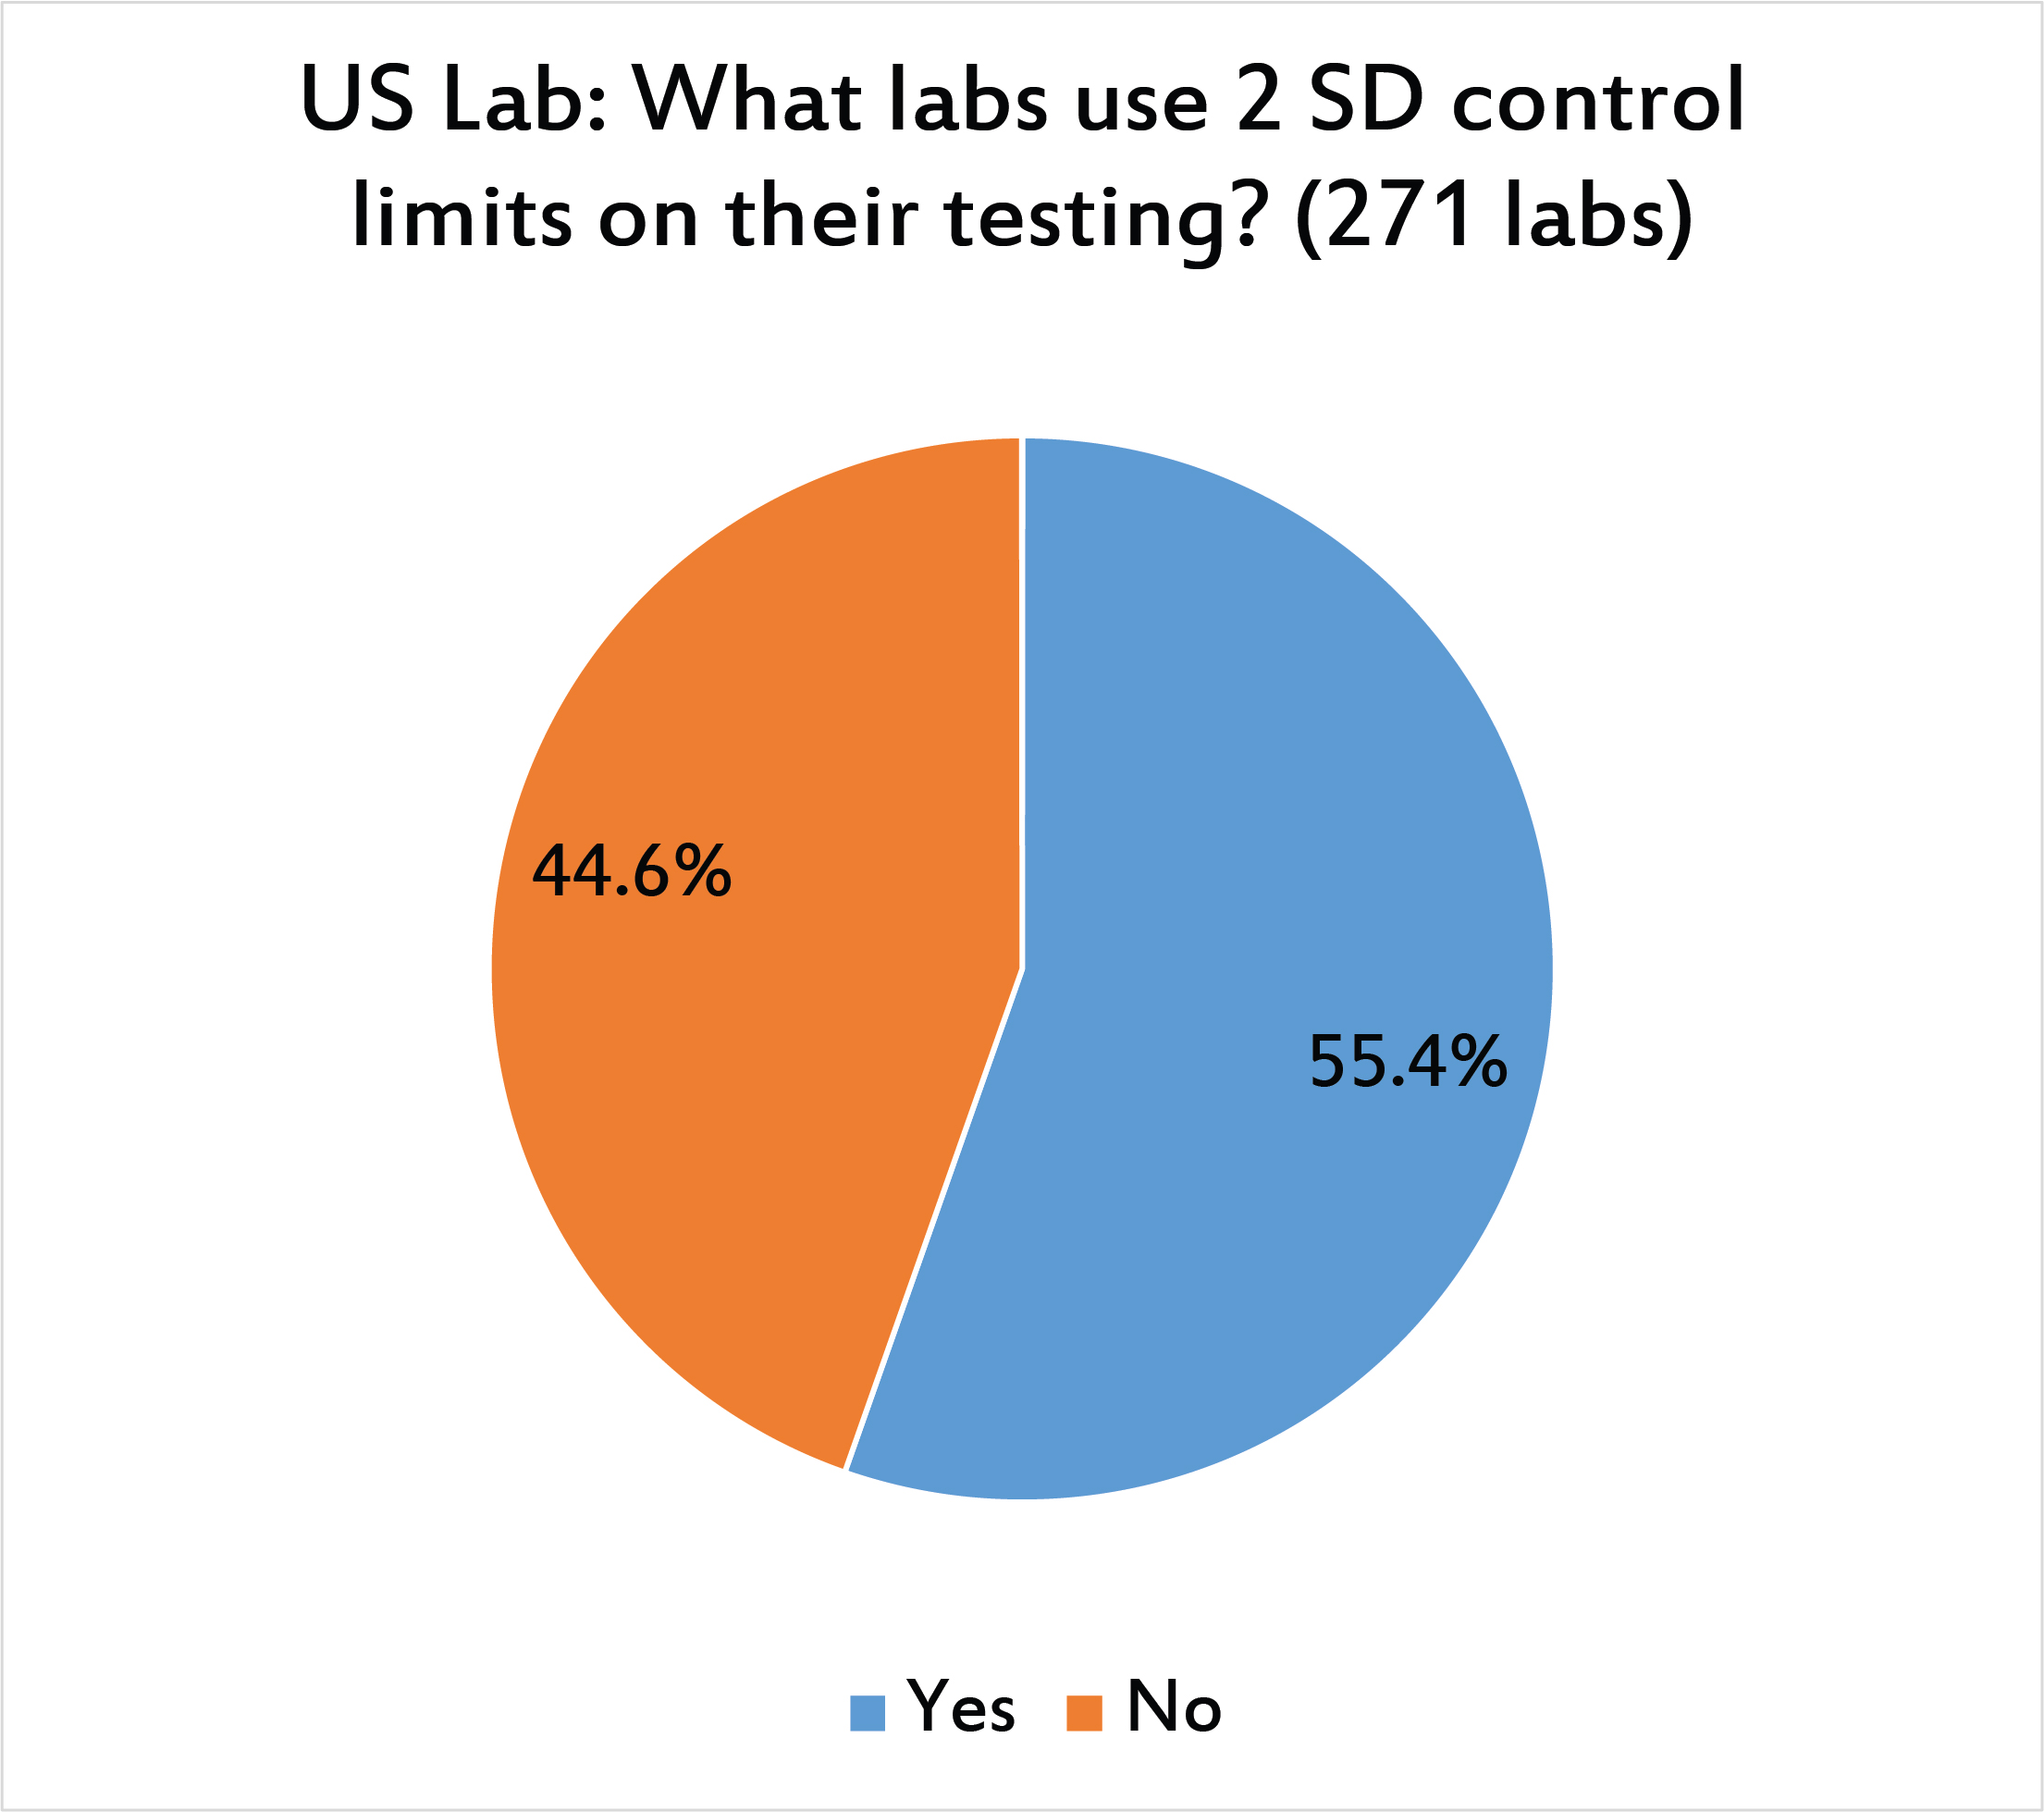
A majority of US labs are still using 2 SD control limits.
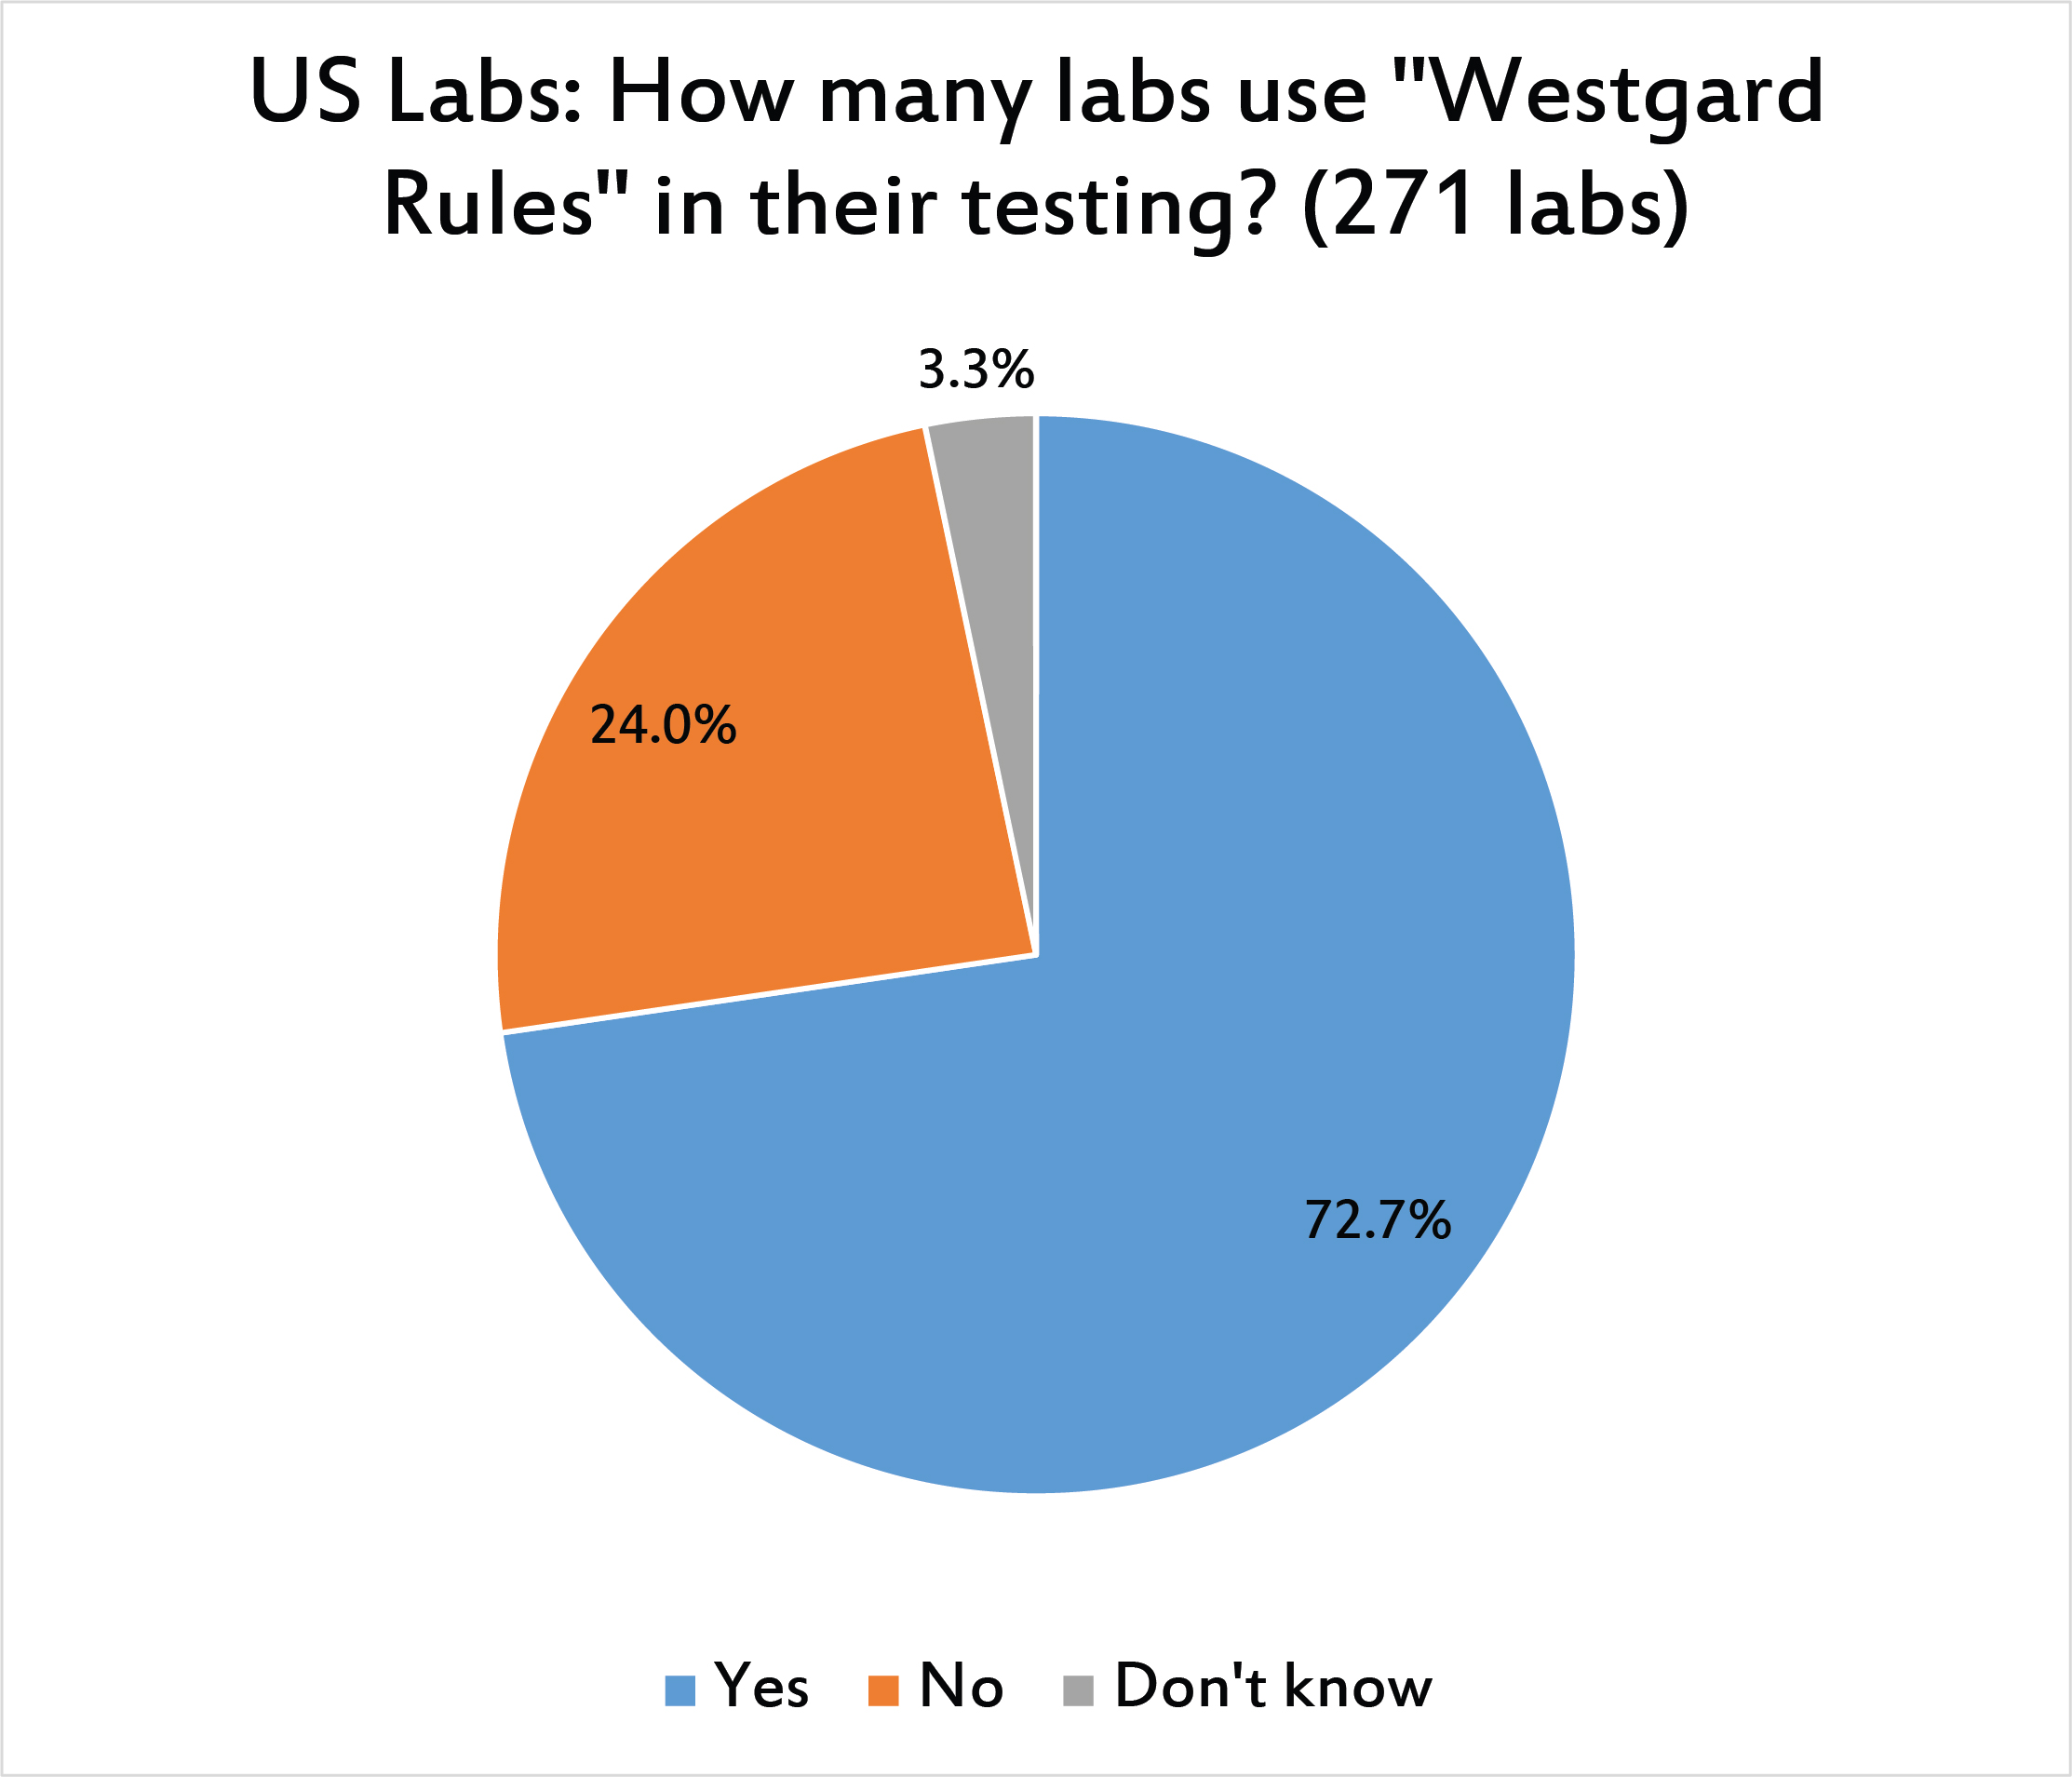
Nearly three-quarters of laboratories use "Westgard Rules."
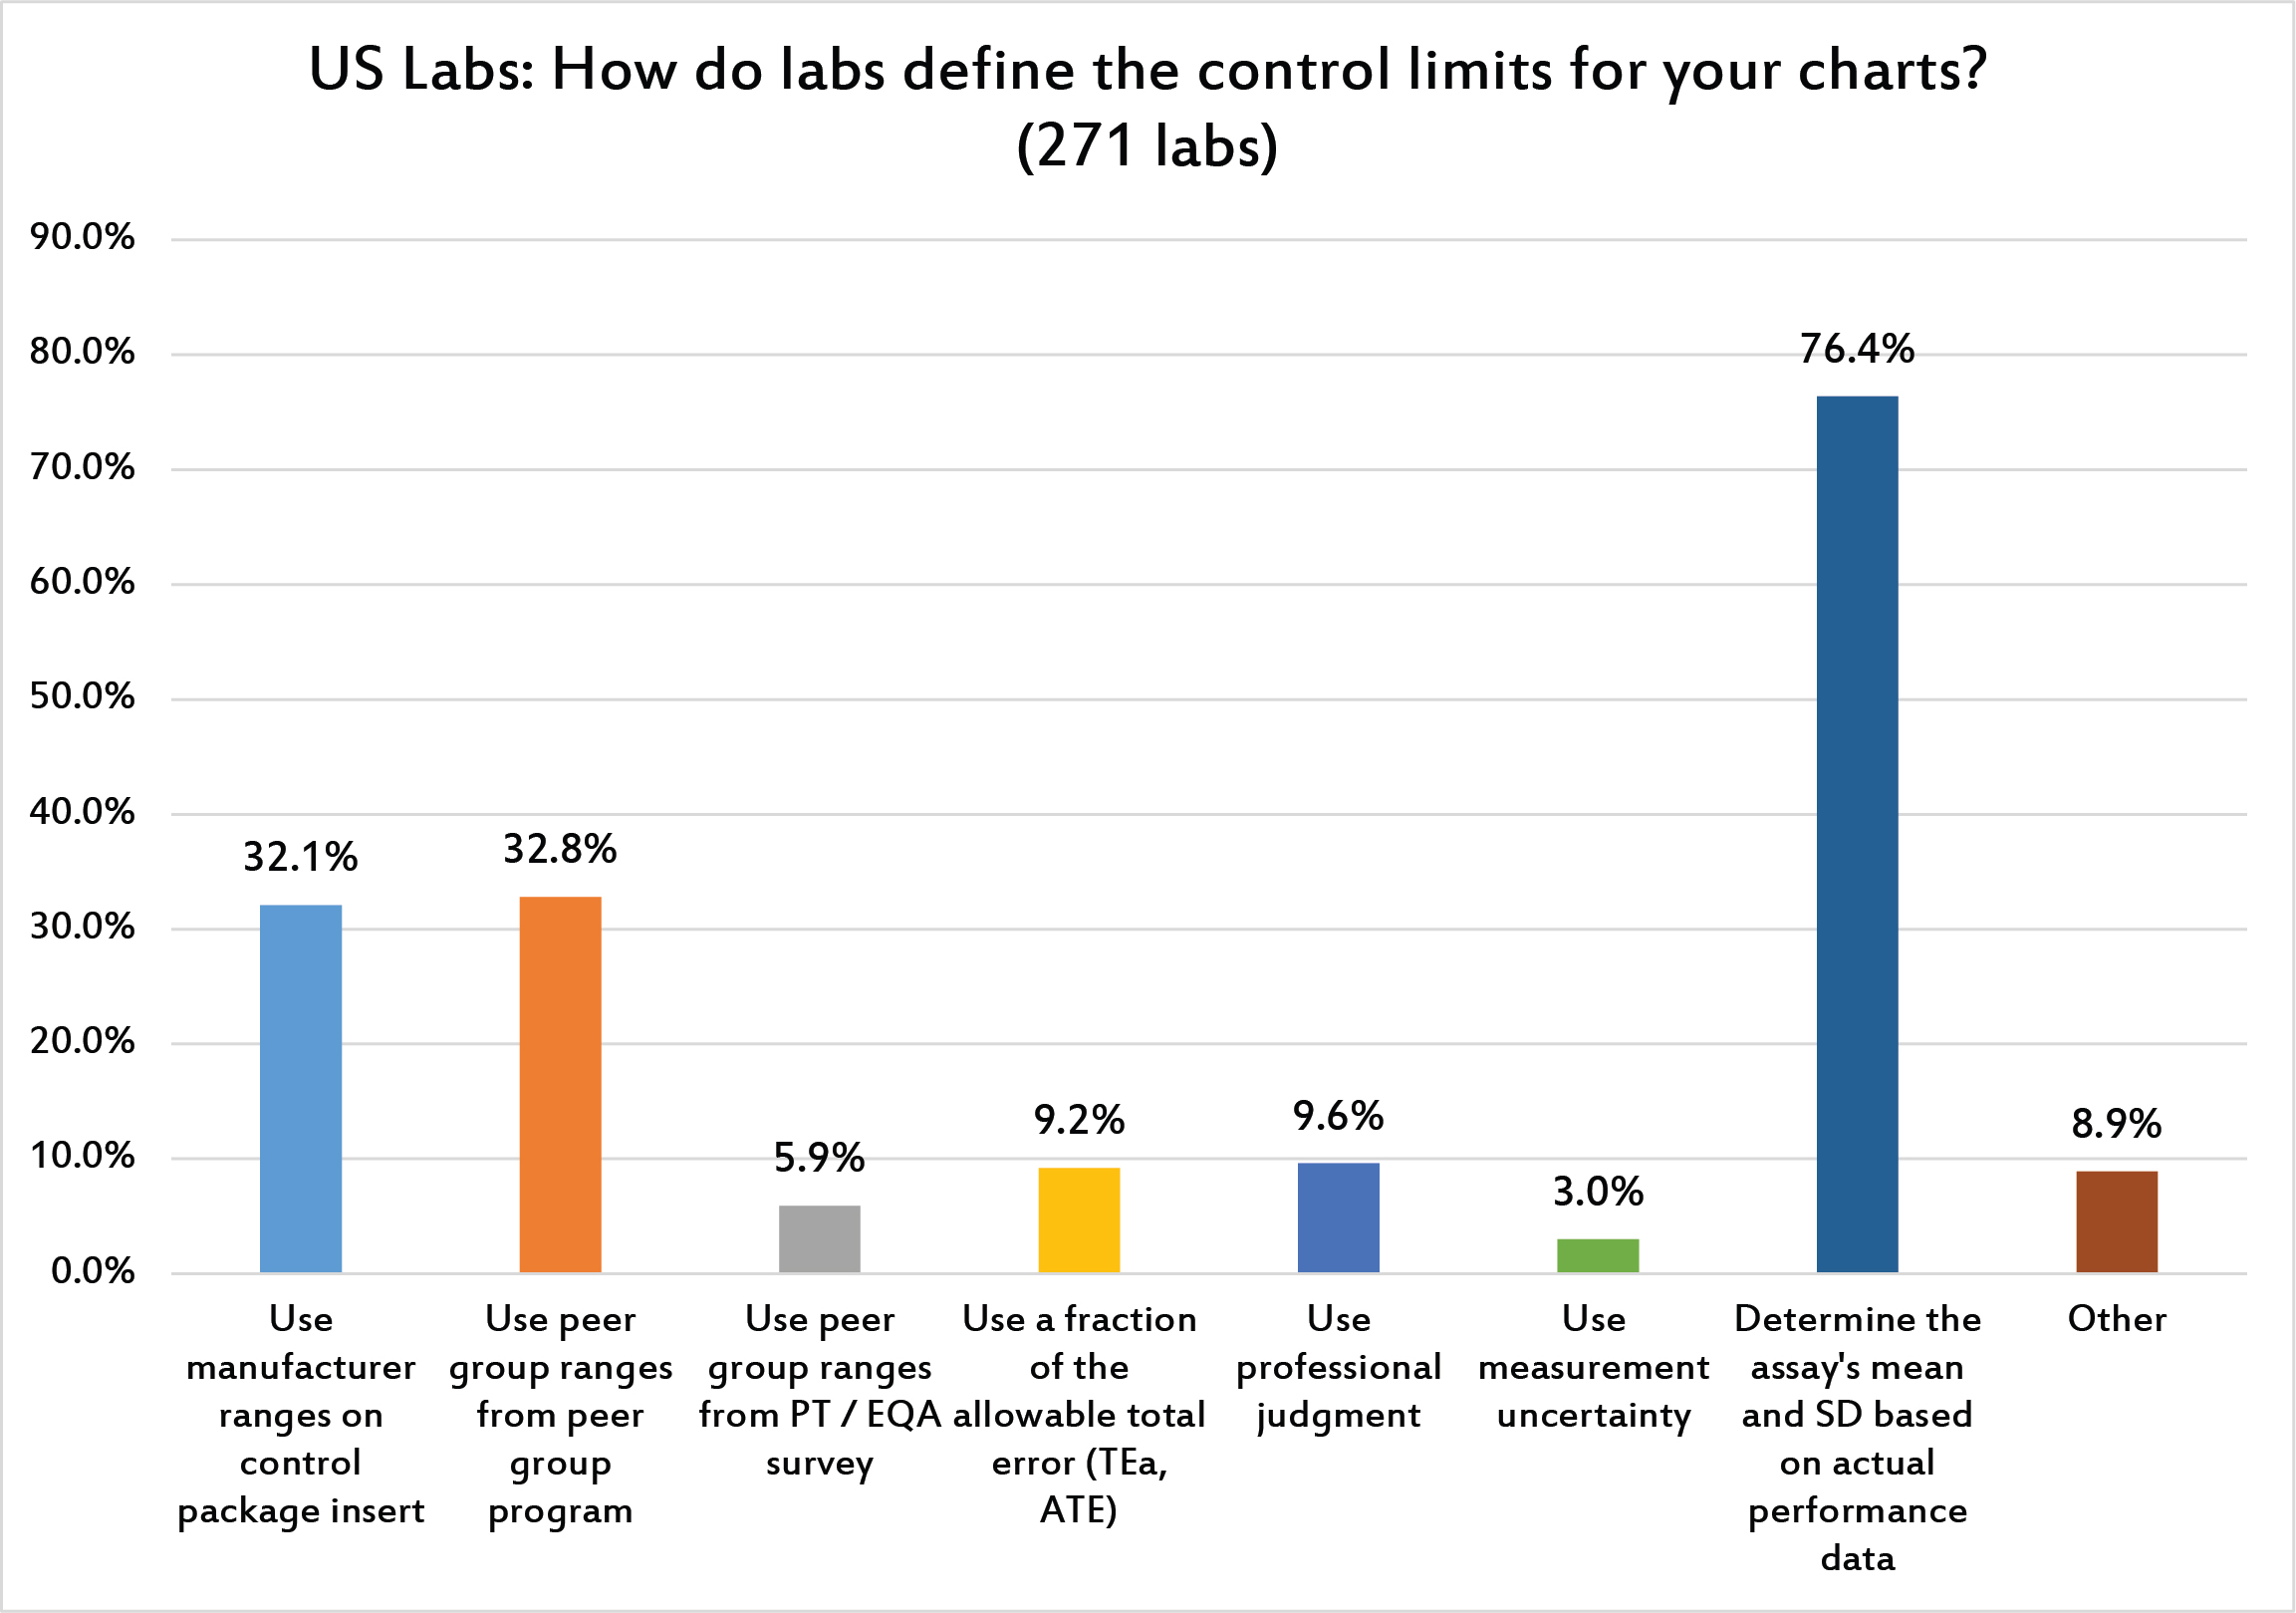
[Multiple answers were allowed for this question] Three-quarters of laboratories determine the actual mean and SD of their methods. One third of laboratories, however, use the manufacturer ranges or peer group SDs, both of which are too large and will produce control "limits" that are too wide.
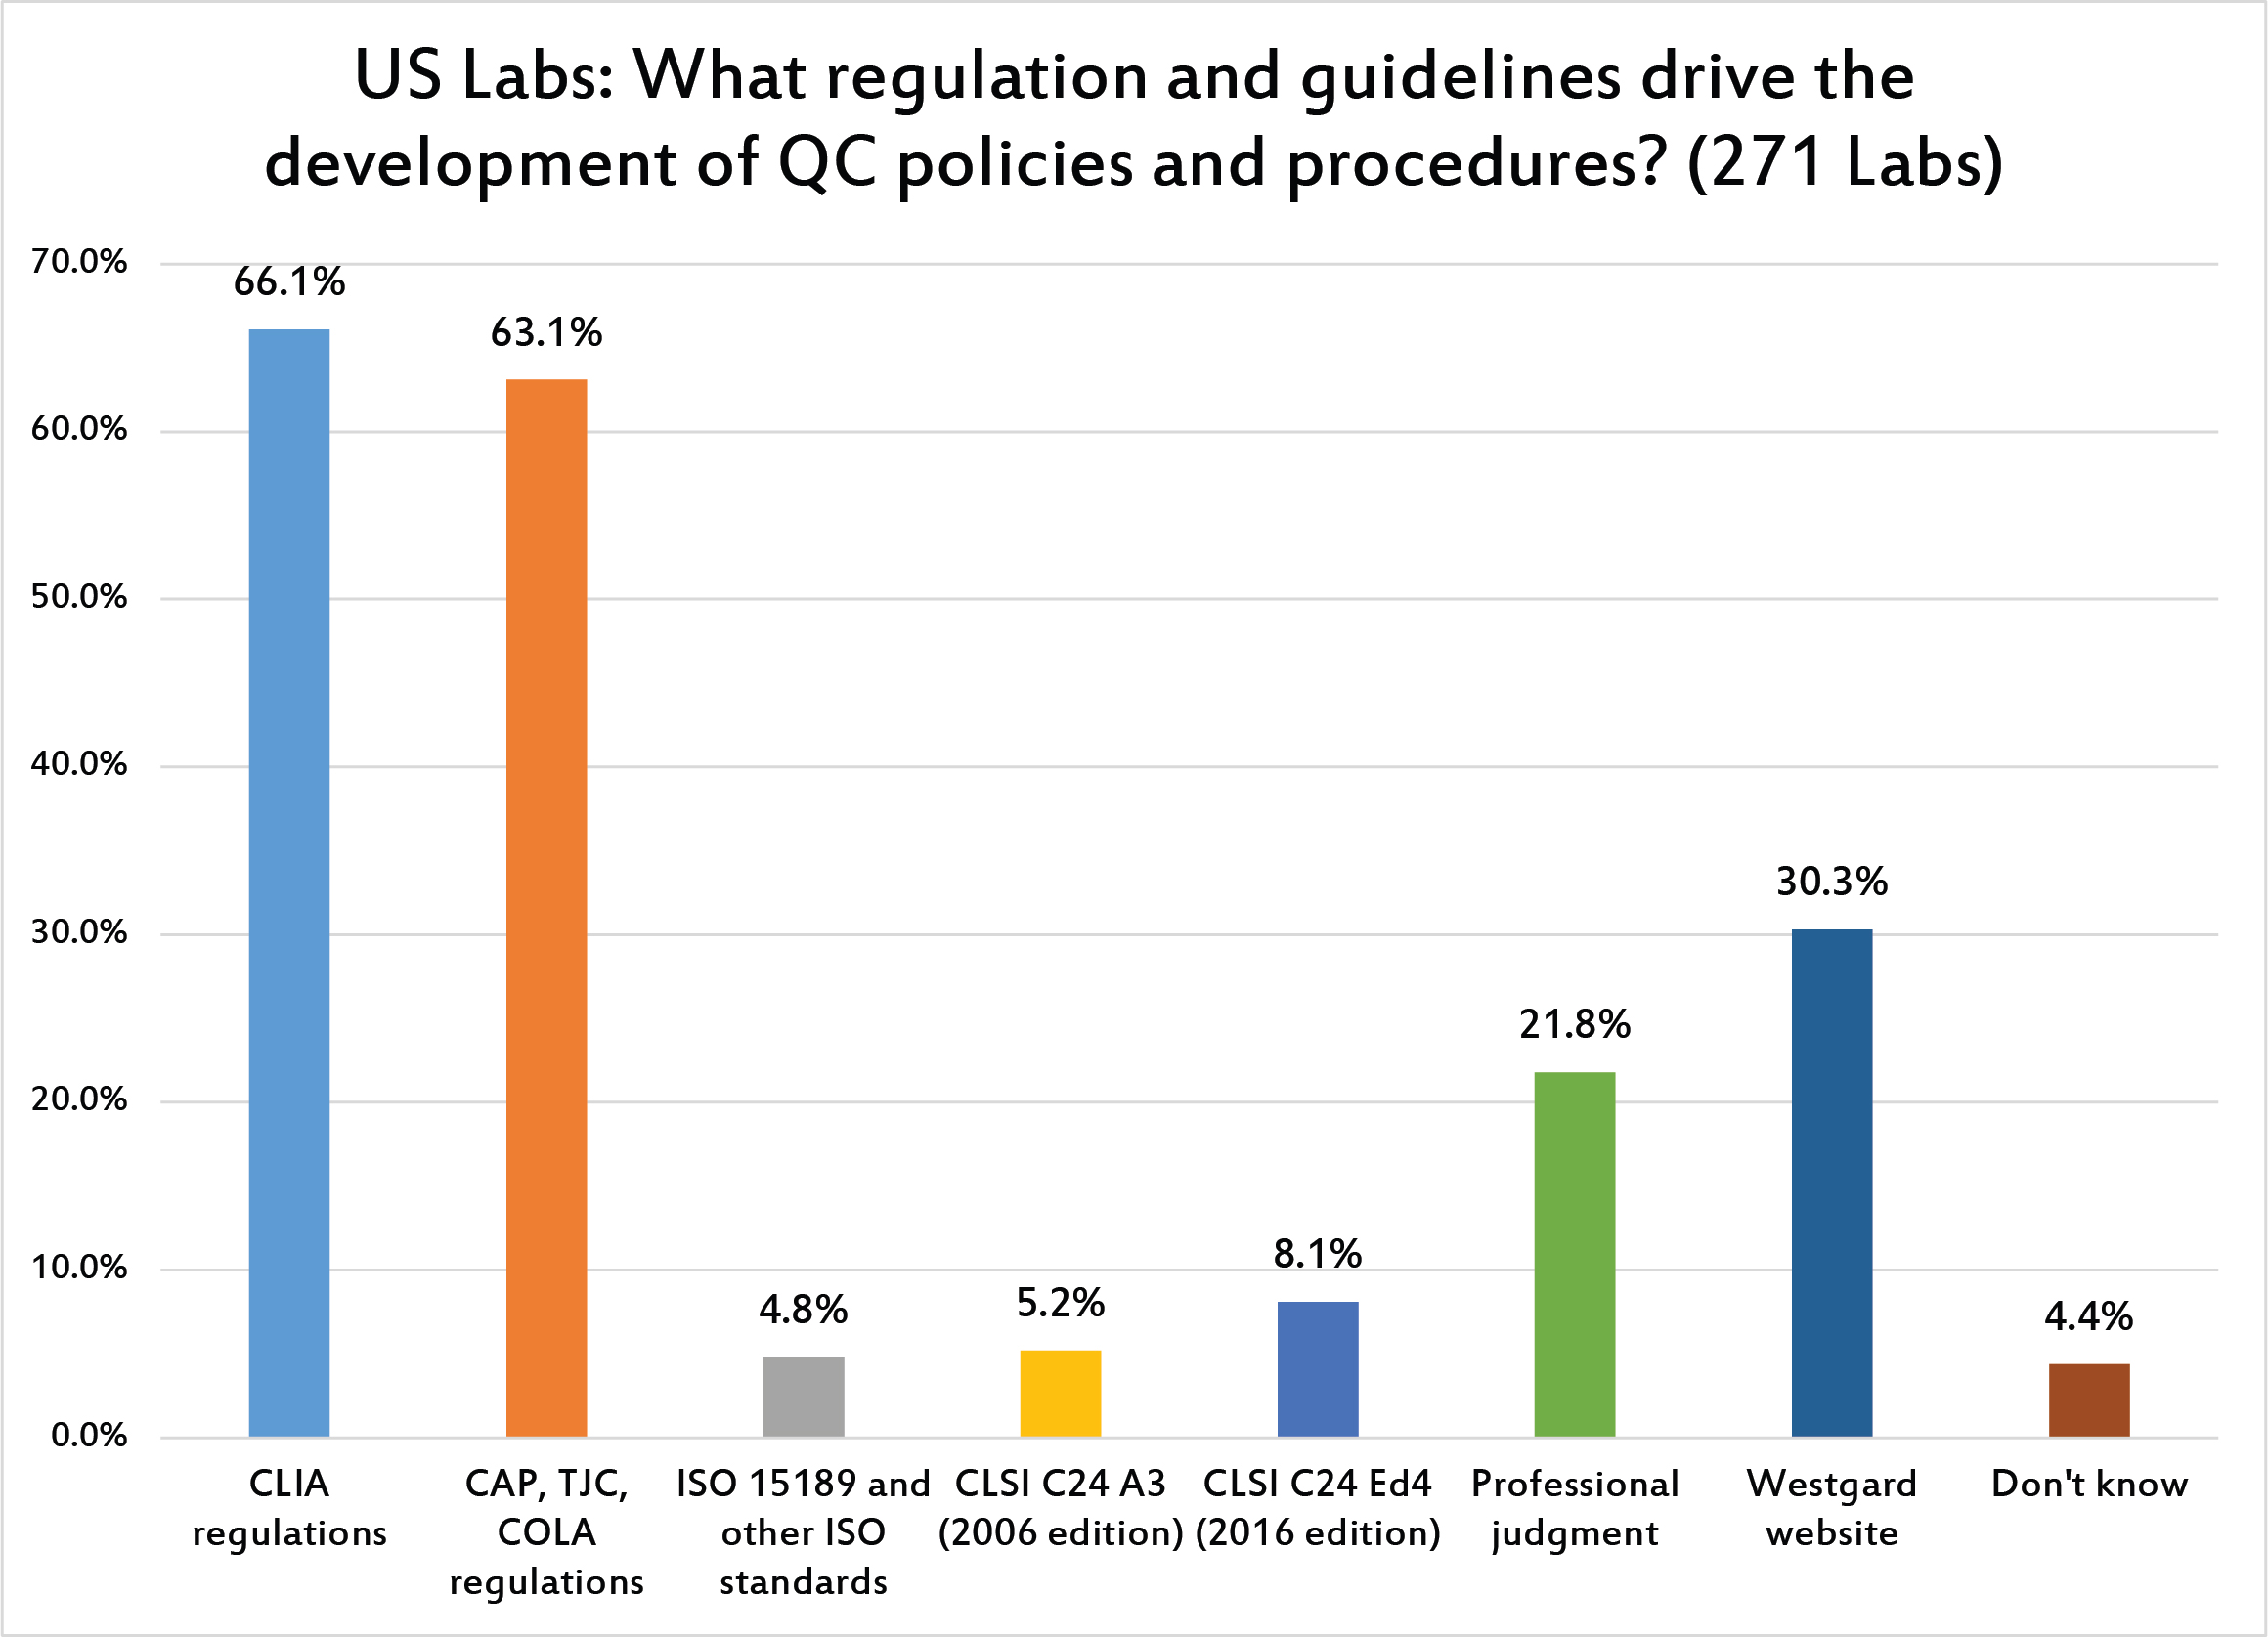
Again, US laboratories are mainly governed by CLIA and guided by CLIA, The Joint Commission, and COLA when it comes to setting their QC rules and contorl limits. Very few laboratories in the US are influenced by ISO 15189.
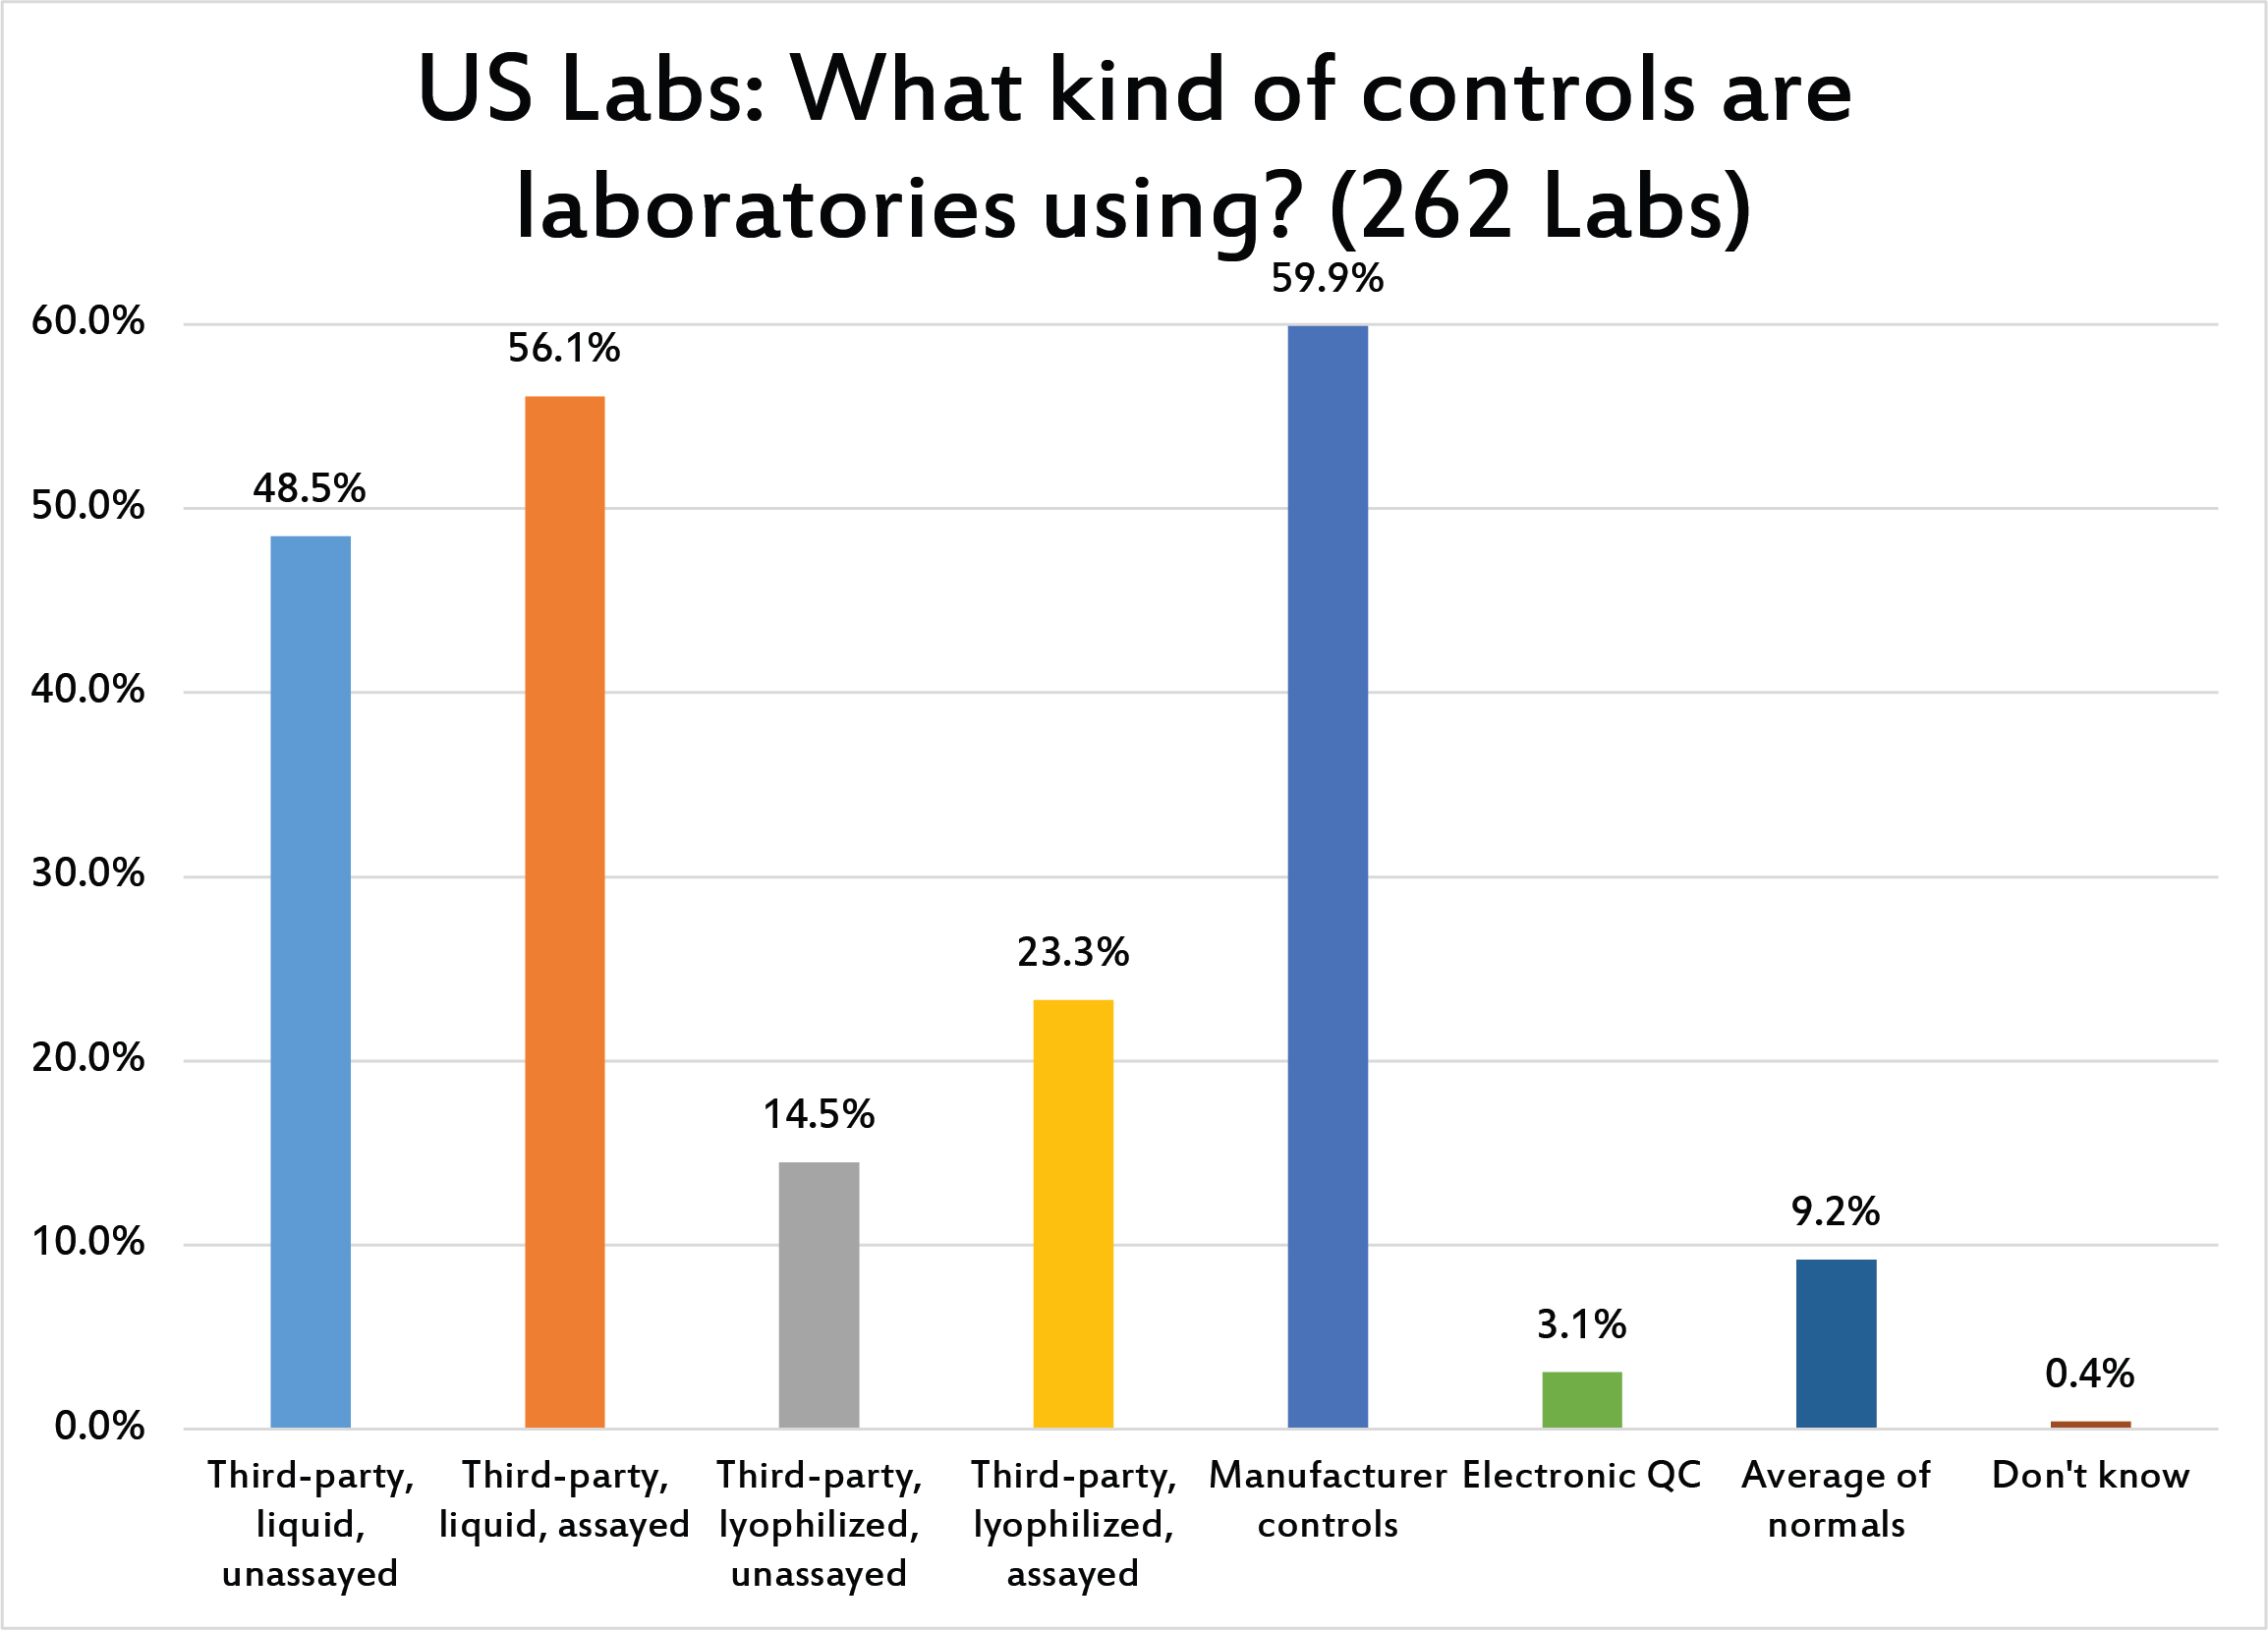
[Multiple answers for this question were allowed] A majority of laboratories use manufacturer controls, but also third-party liquid controls (both assays and unassayed). Lyophilized controls are not popular within the US, unlike laboratories abroad. Less than 10% of laboratories use Average of normals. Again, this indicates there is a real gap in the discussion about the benefit of average of normal and then actual implementation in labs.
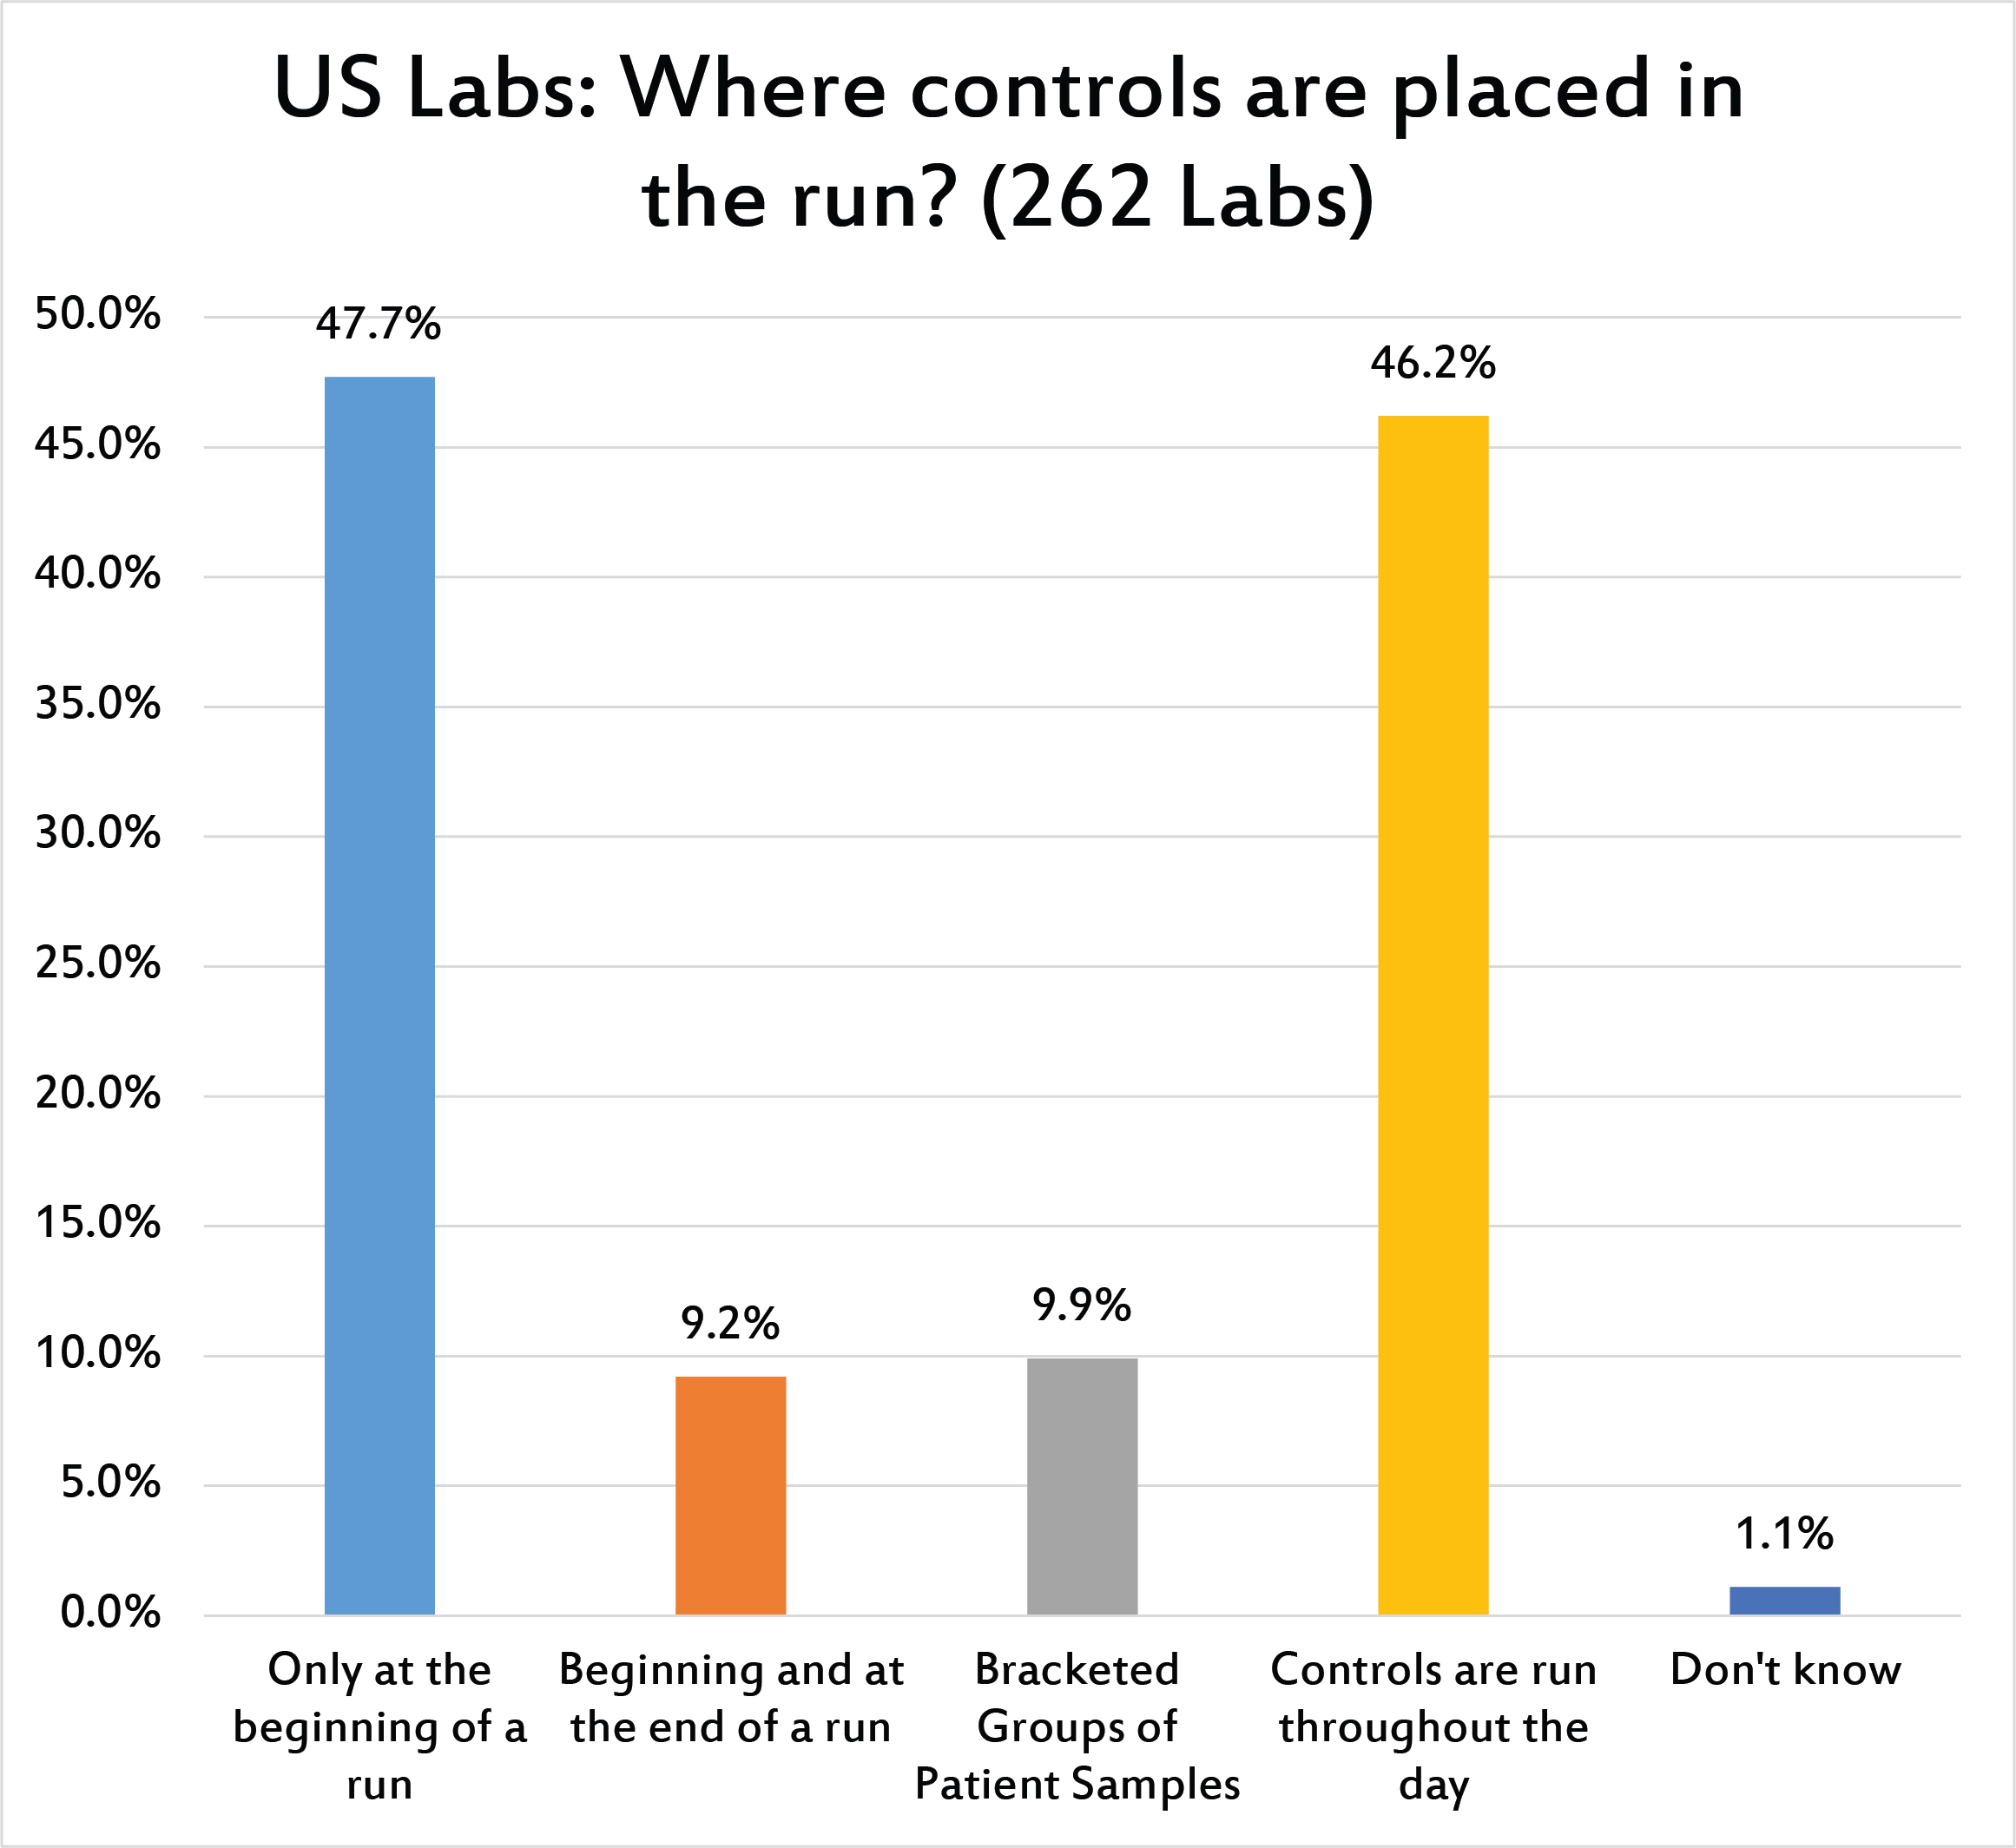
[Multiple responses were allowed for this question] Close to 50% of laboratories only place controls at the beginning of a run. A similar percentage run the controls throughout the day. Few laboratories are bracketing QC or running QC based on the volume of their testing.
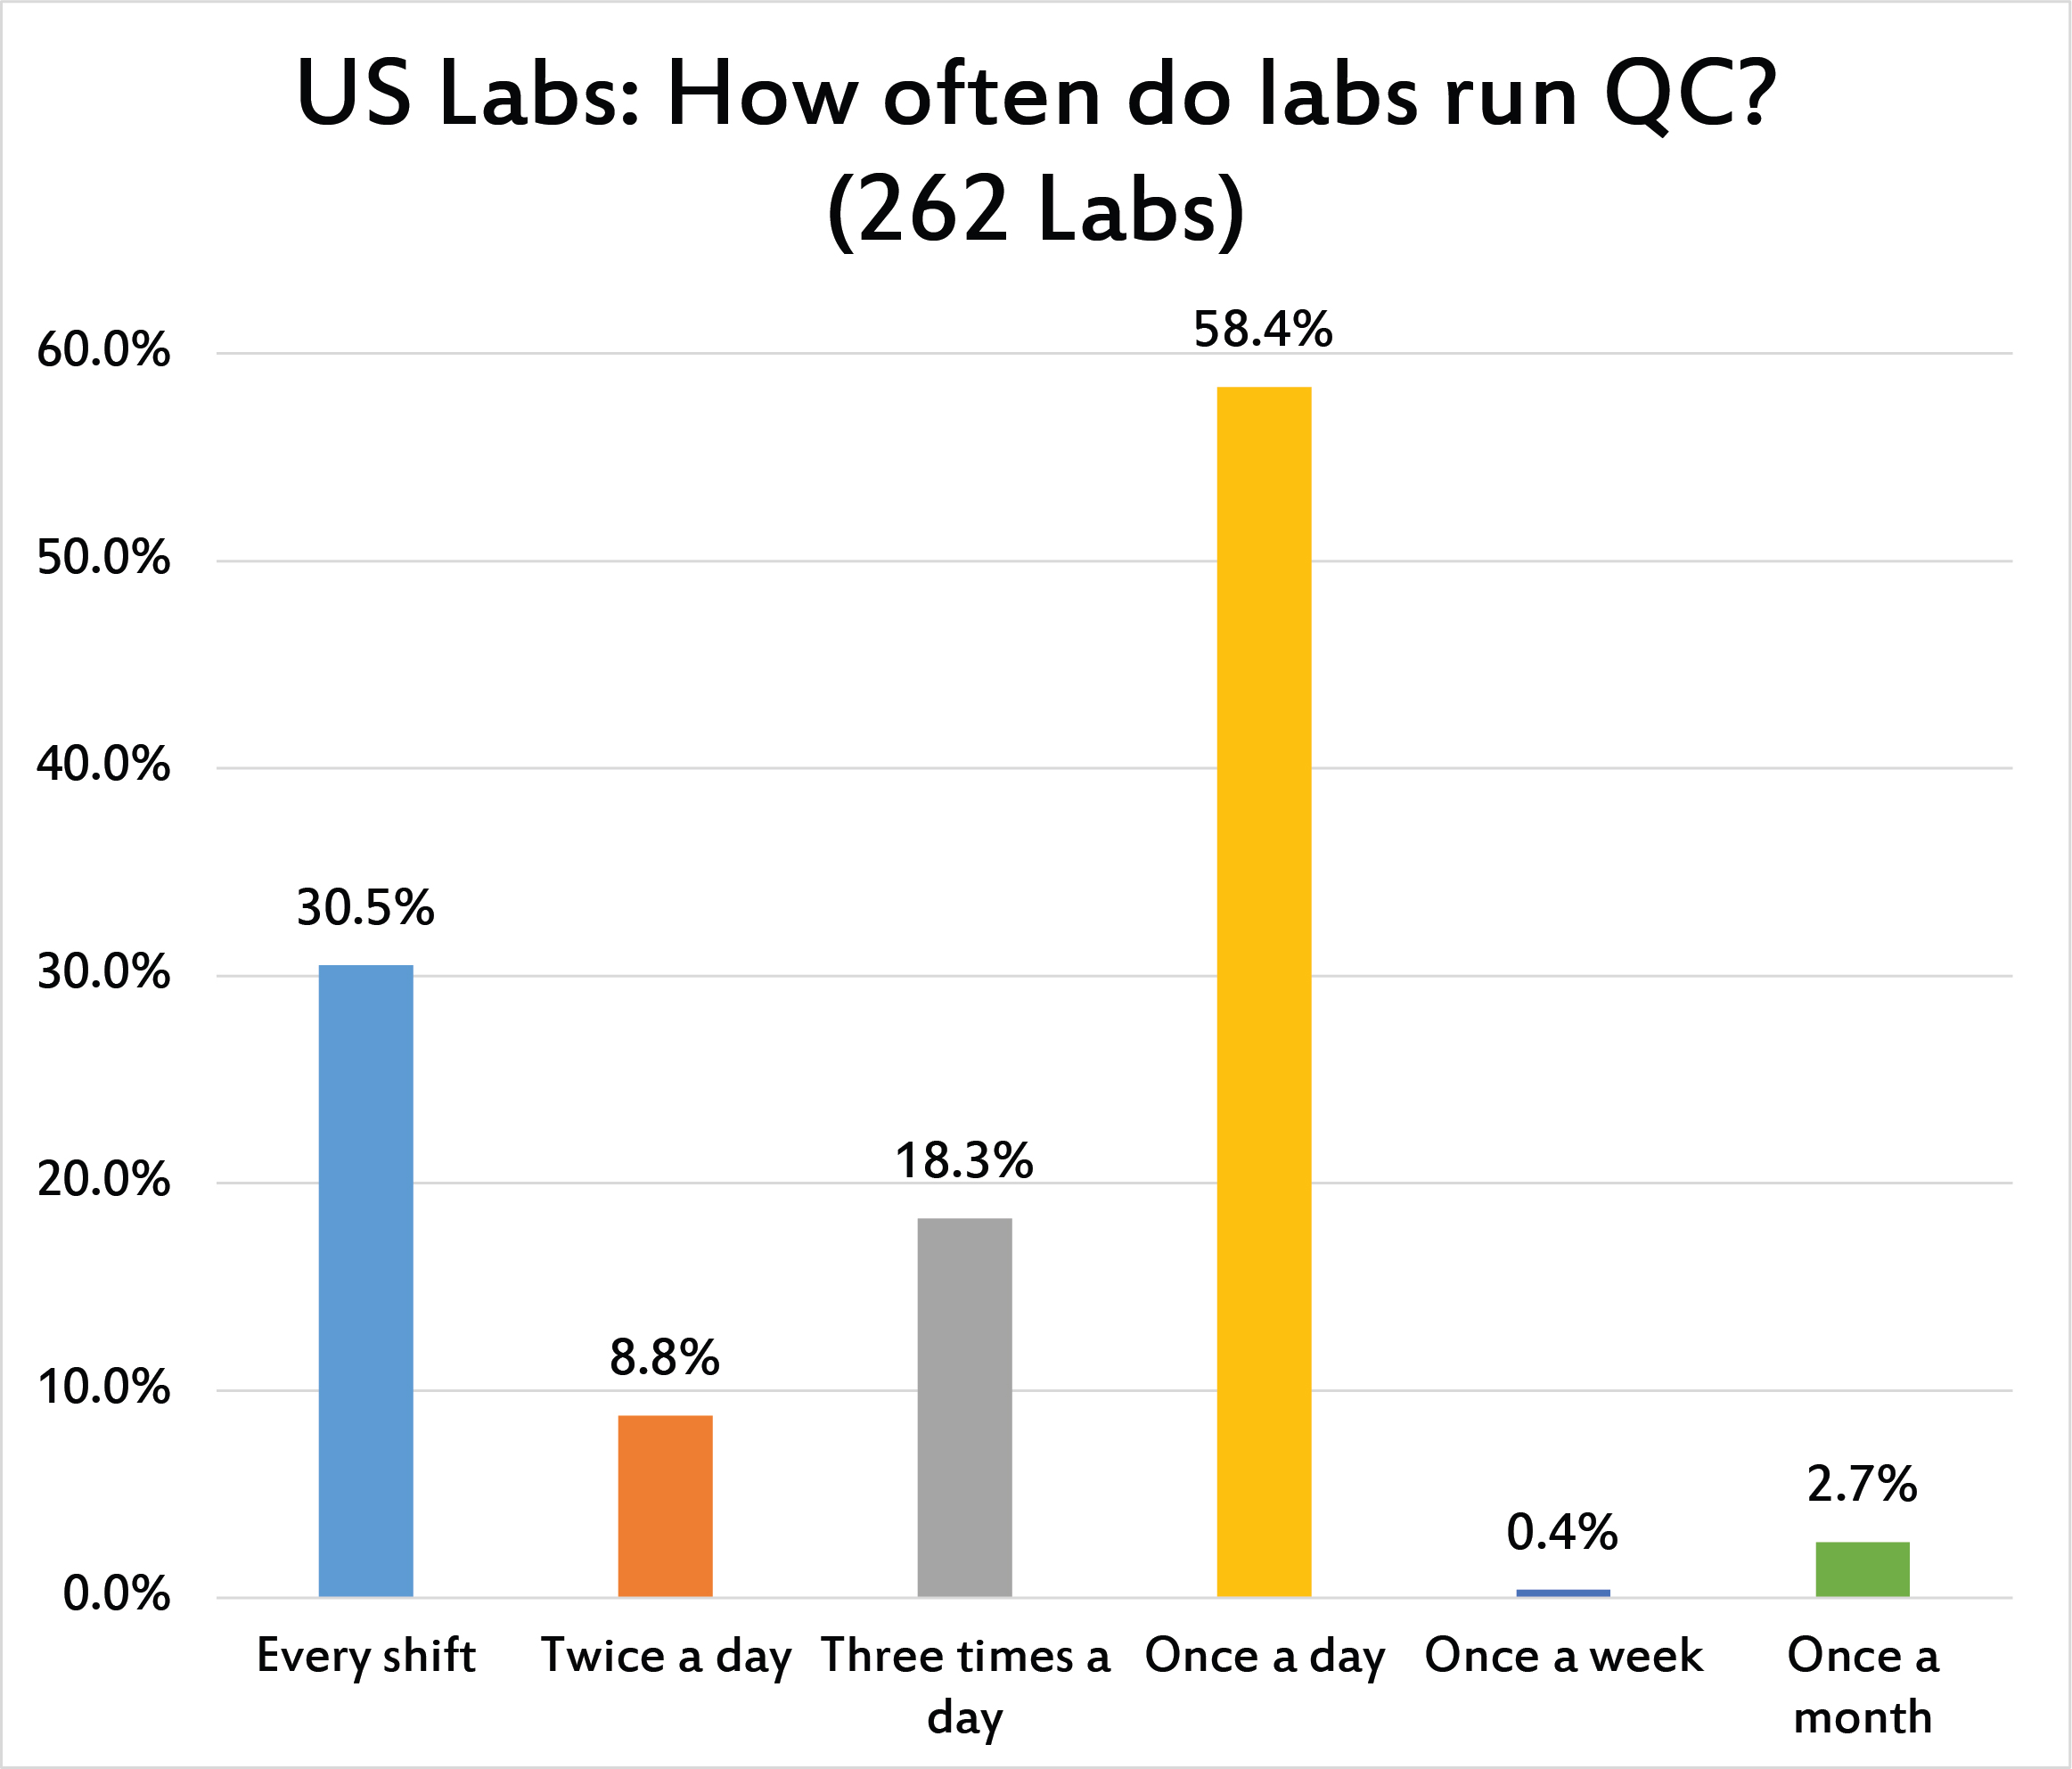
The vast majority of laboratories only run QC once a day, meeting their CLIA minimum requirement. A third of laboratories run the QC every shift. Few labs run twice a day, but just under one in five laboratories run QC three times per day. Only the labs contending with IQCP and POC have reduced their frequency to just once per week or once per month - the IQCP policies have not really had any measurable impact on core laboratories.
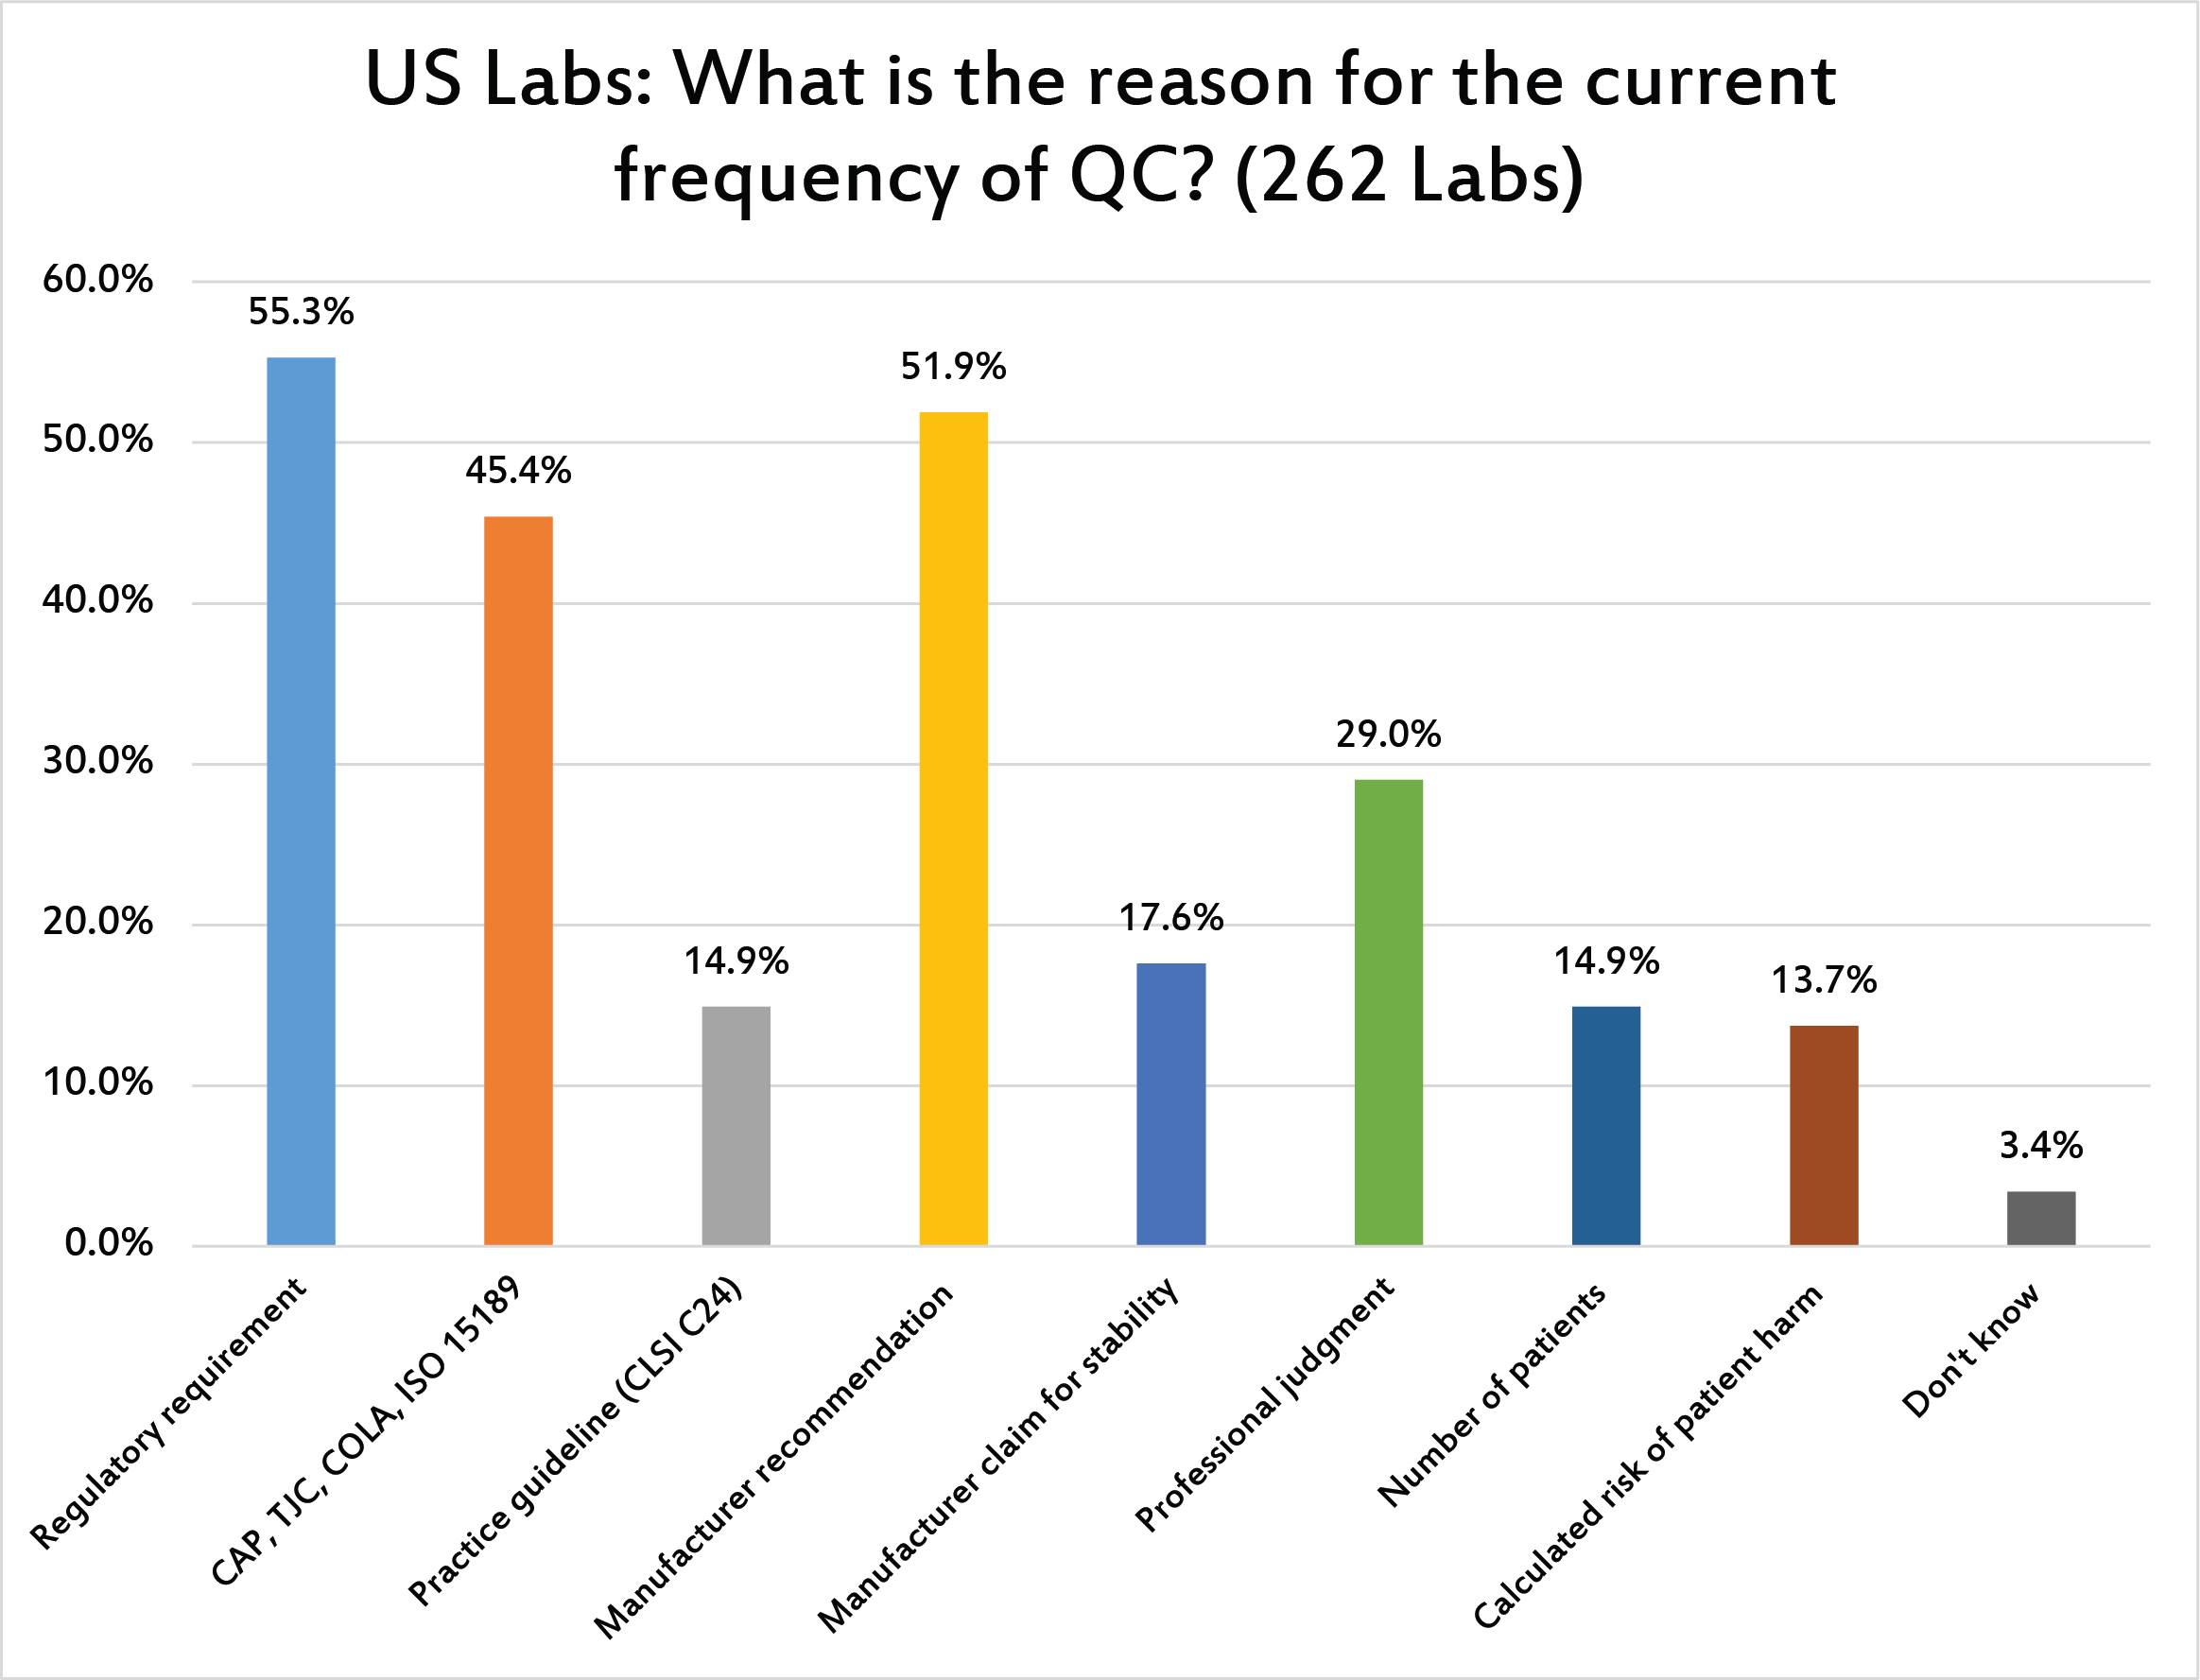
[Multiple responses for this question were allowed.] US regulations and manufacturer recommendations are the main drivers of QC frequency. Less than 15% of labs are based on volume (number of patients) or risk assessment (calculated risk of patient harm).
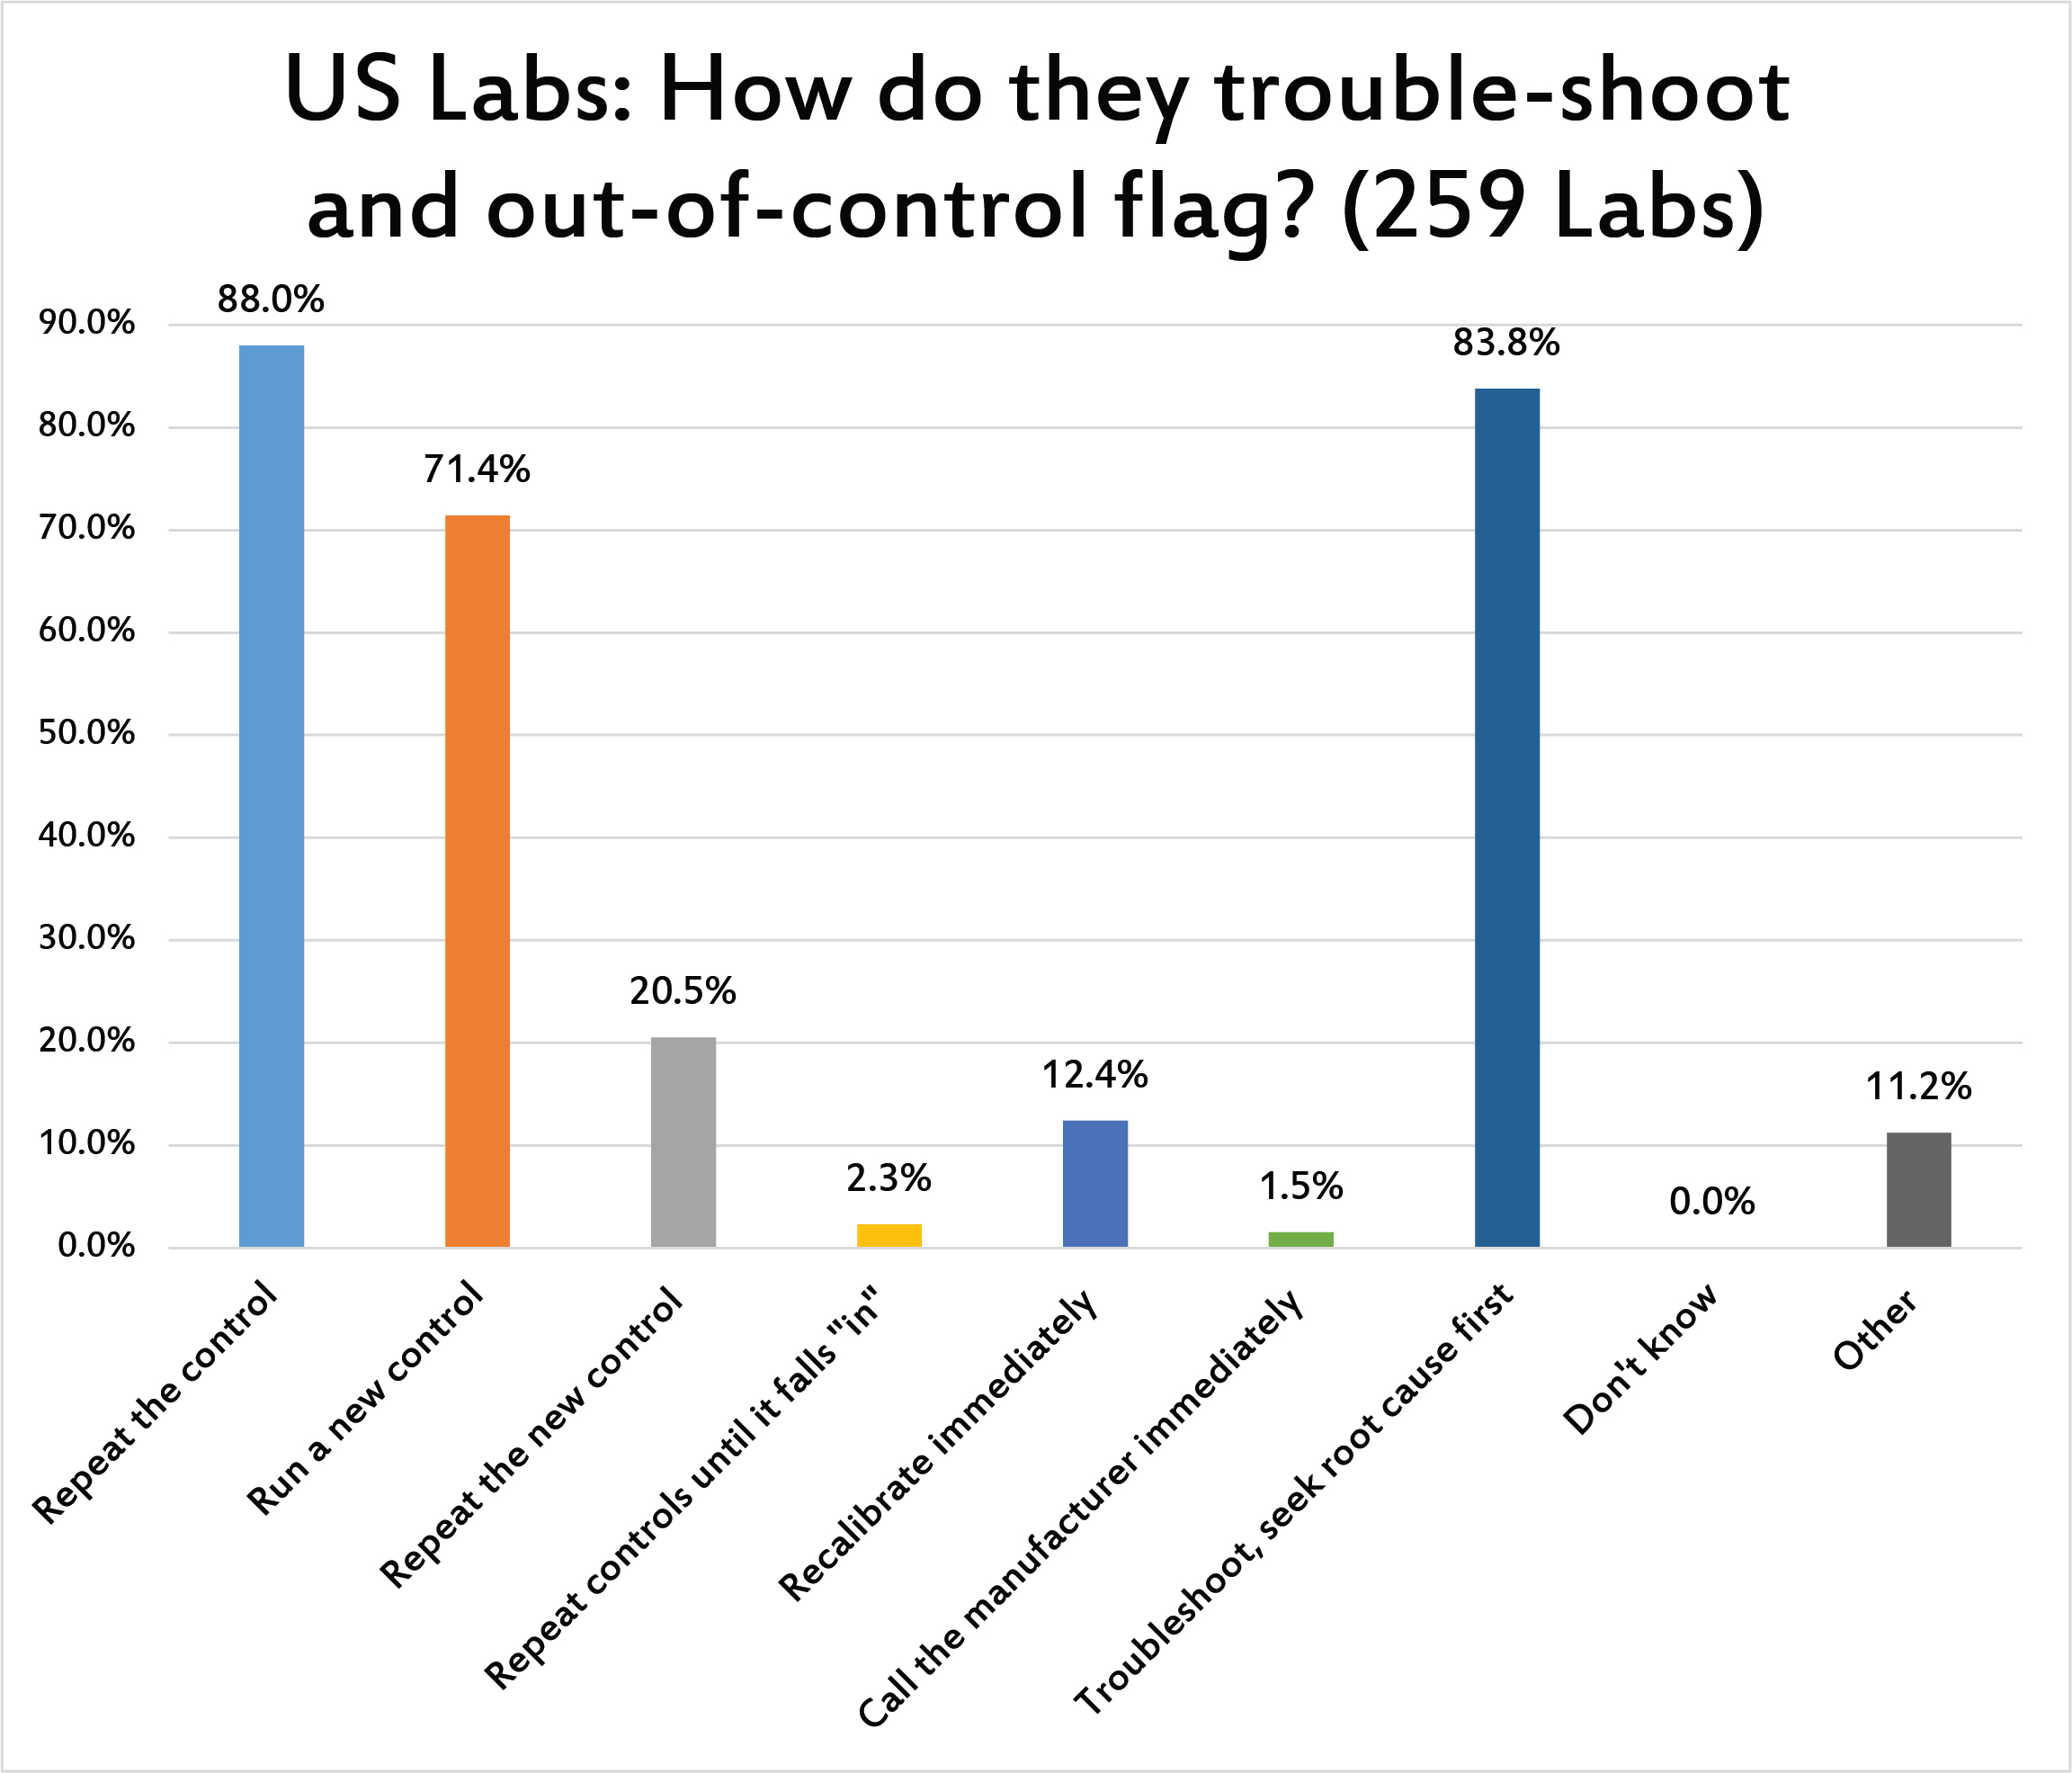
[Multiple responses were allowed for this question] The first response to a control flag for the vast majority of US labs was to repeat the control and/or run a new control. Thankfully, there are also laboratories that respond to an event not by knee-jerk repeating, but by true troubleshooting, seeking root cause, examining the nature of the control flag before any further repeats. Thankfully, very few labs admit that they simply repeat controls over and over until the control falls "in." The "repeat rate" reported by US labs is the highest that we've seen in the survey analysis. US laboratories have developed a strong habit of repeating controls.
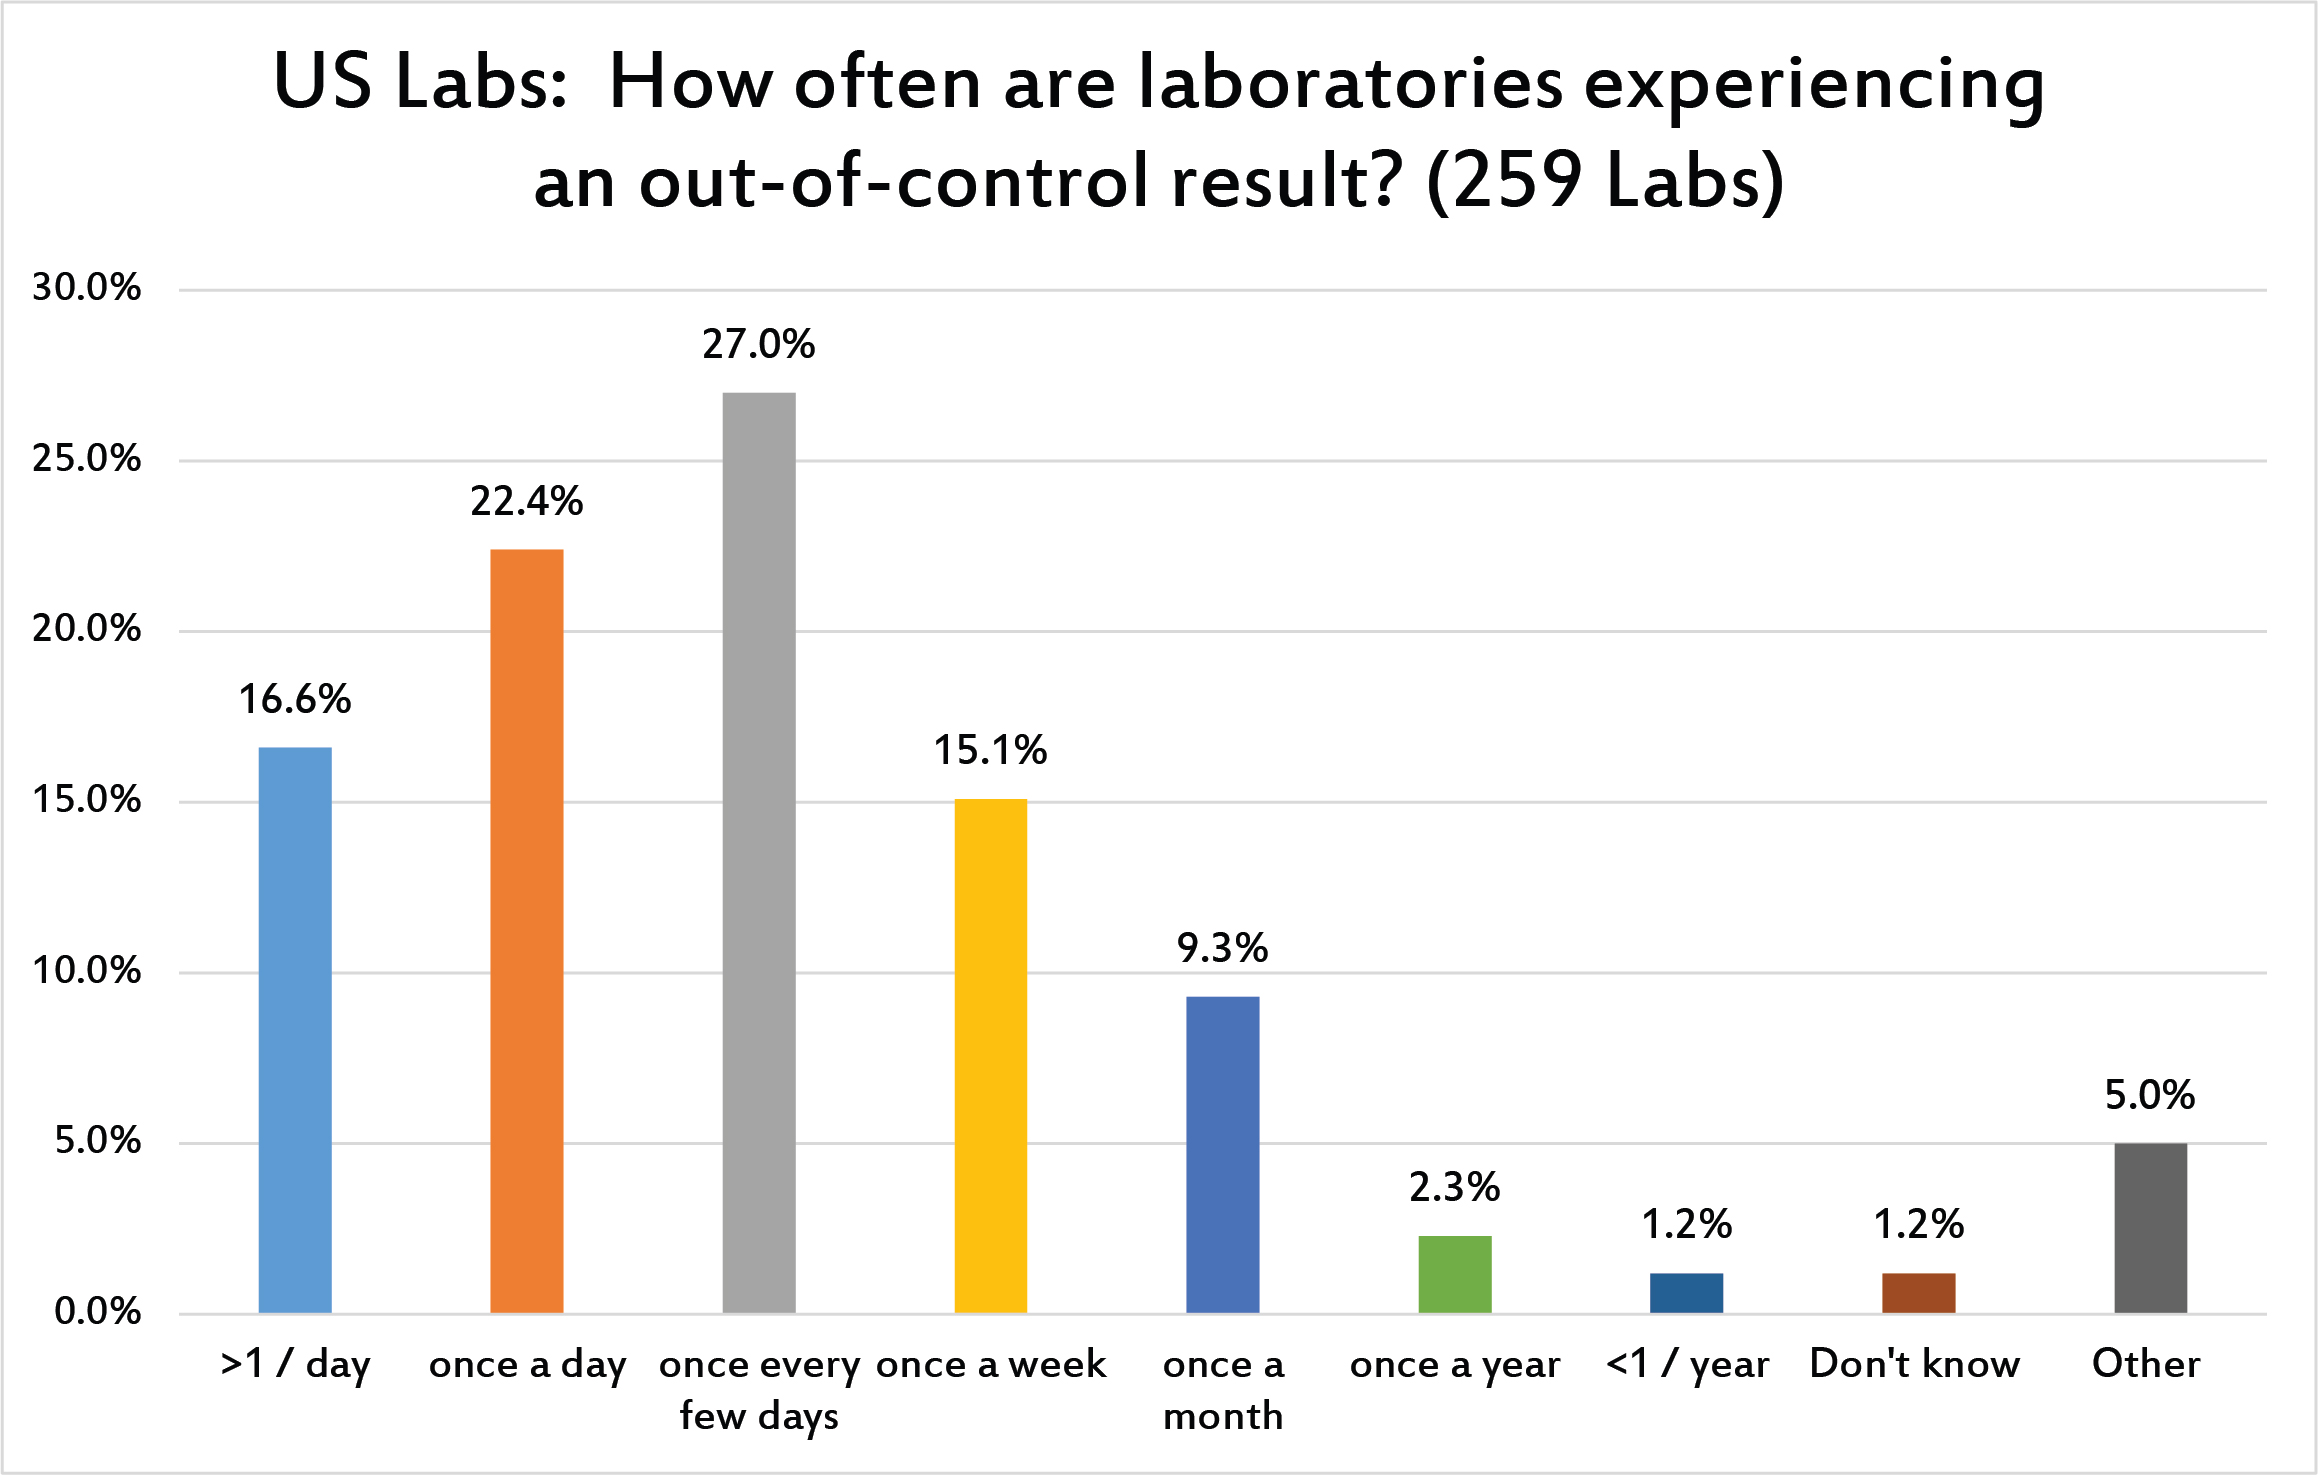
More than a third of laboratories in the US are out of control every day, sometimes more than once a day. A majority of labs see flags more than once a week. This represents a high number of error flags. We should not take these frequent failures as proof of that we are doing our job. This constant din of out-of-control flags is a danger to laboratories; too many alarms deafen the ears and dulls the mind. We become too used to the flags and it becomes difficult to sort out the false alarms from the true alarms.
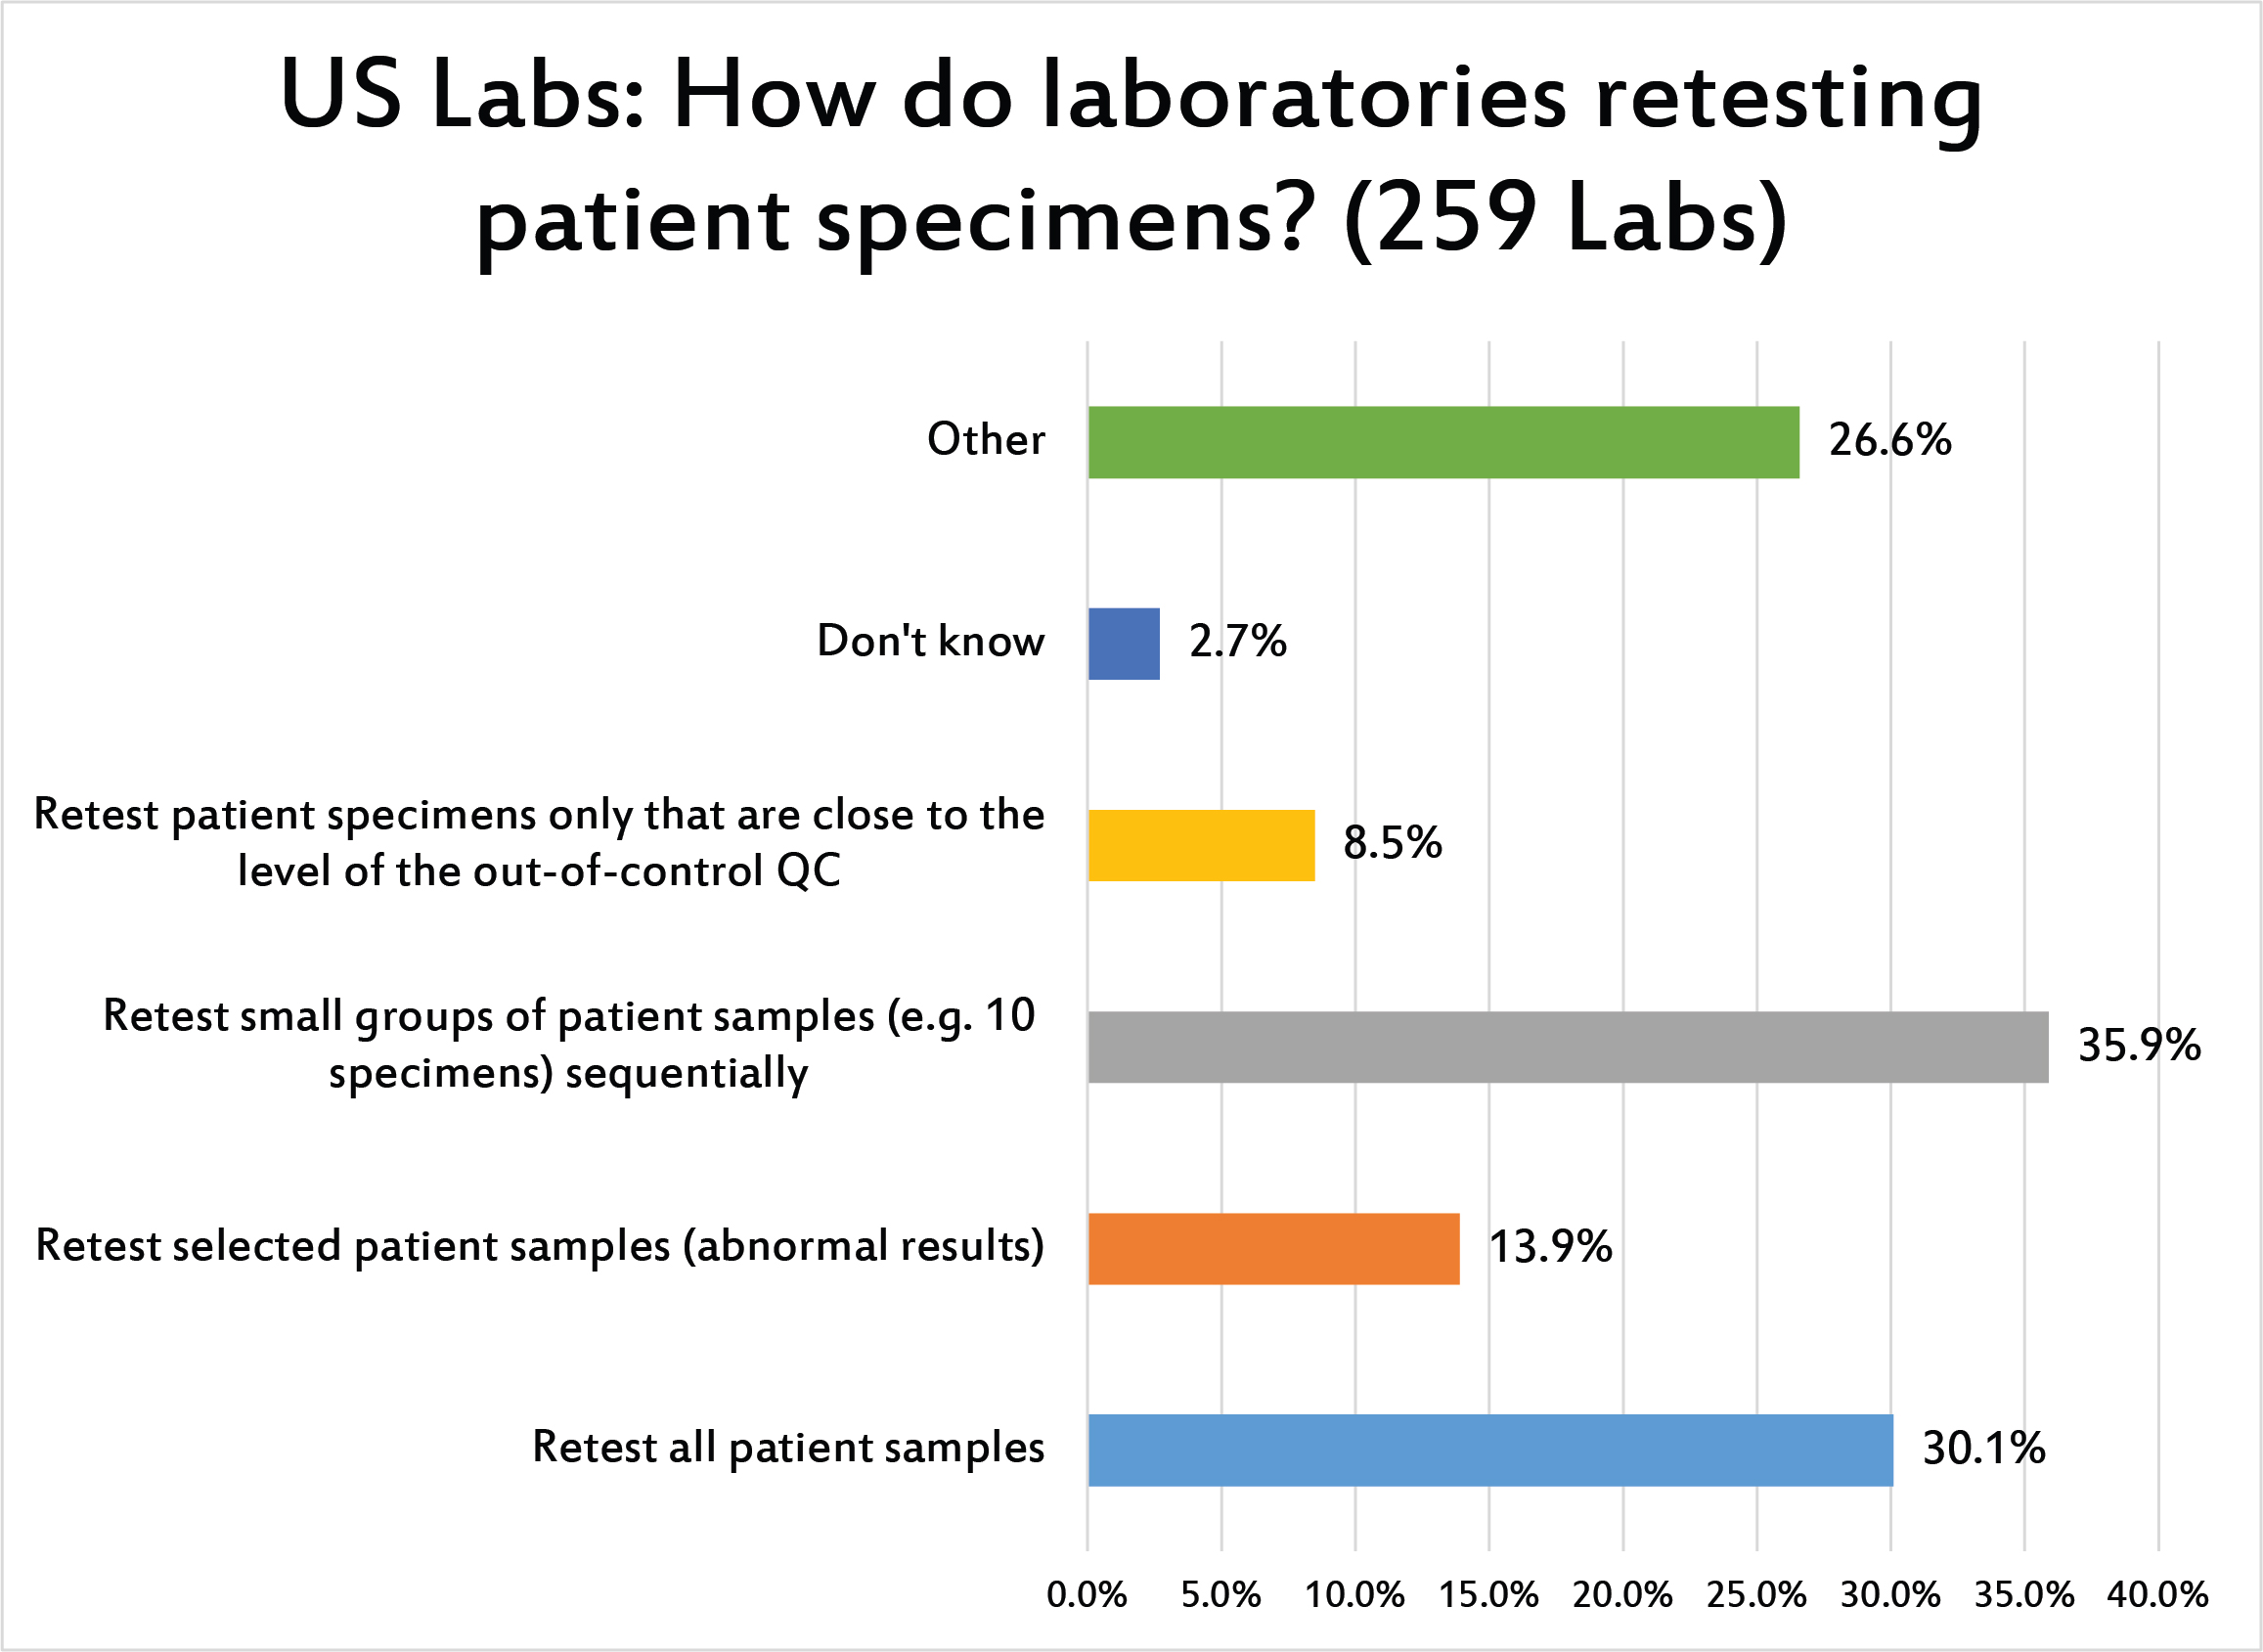
[Multiple answers for this question were allowed] Less than a third of US laboratories retest ALL patient samples when a run is out of control. It's more likely they will retest small number of patient samples first. Given the high volume of most chemistry testing, it's likely that there isn't the logistical capacity to retest an entire run or entire day of samples when there's an out-of-control result.
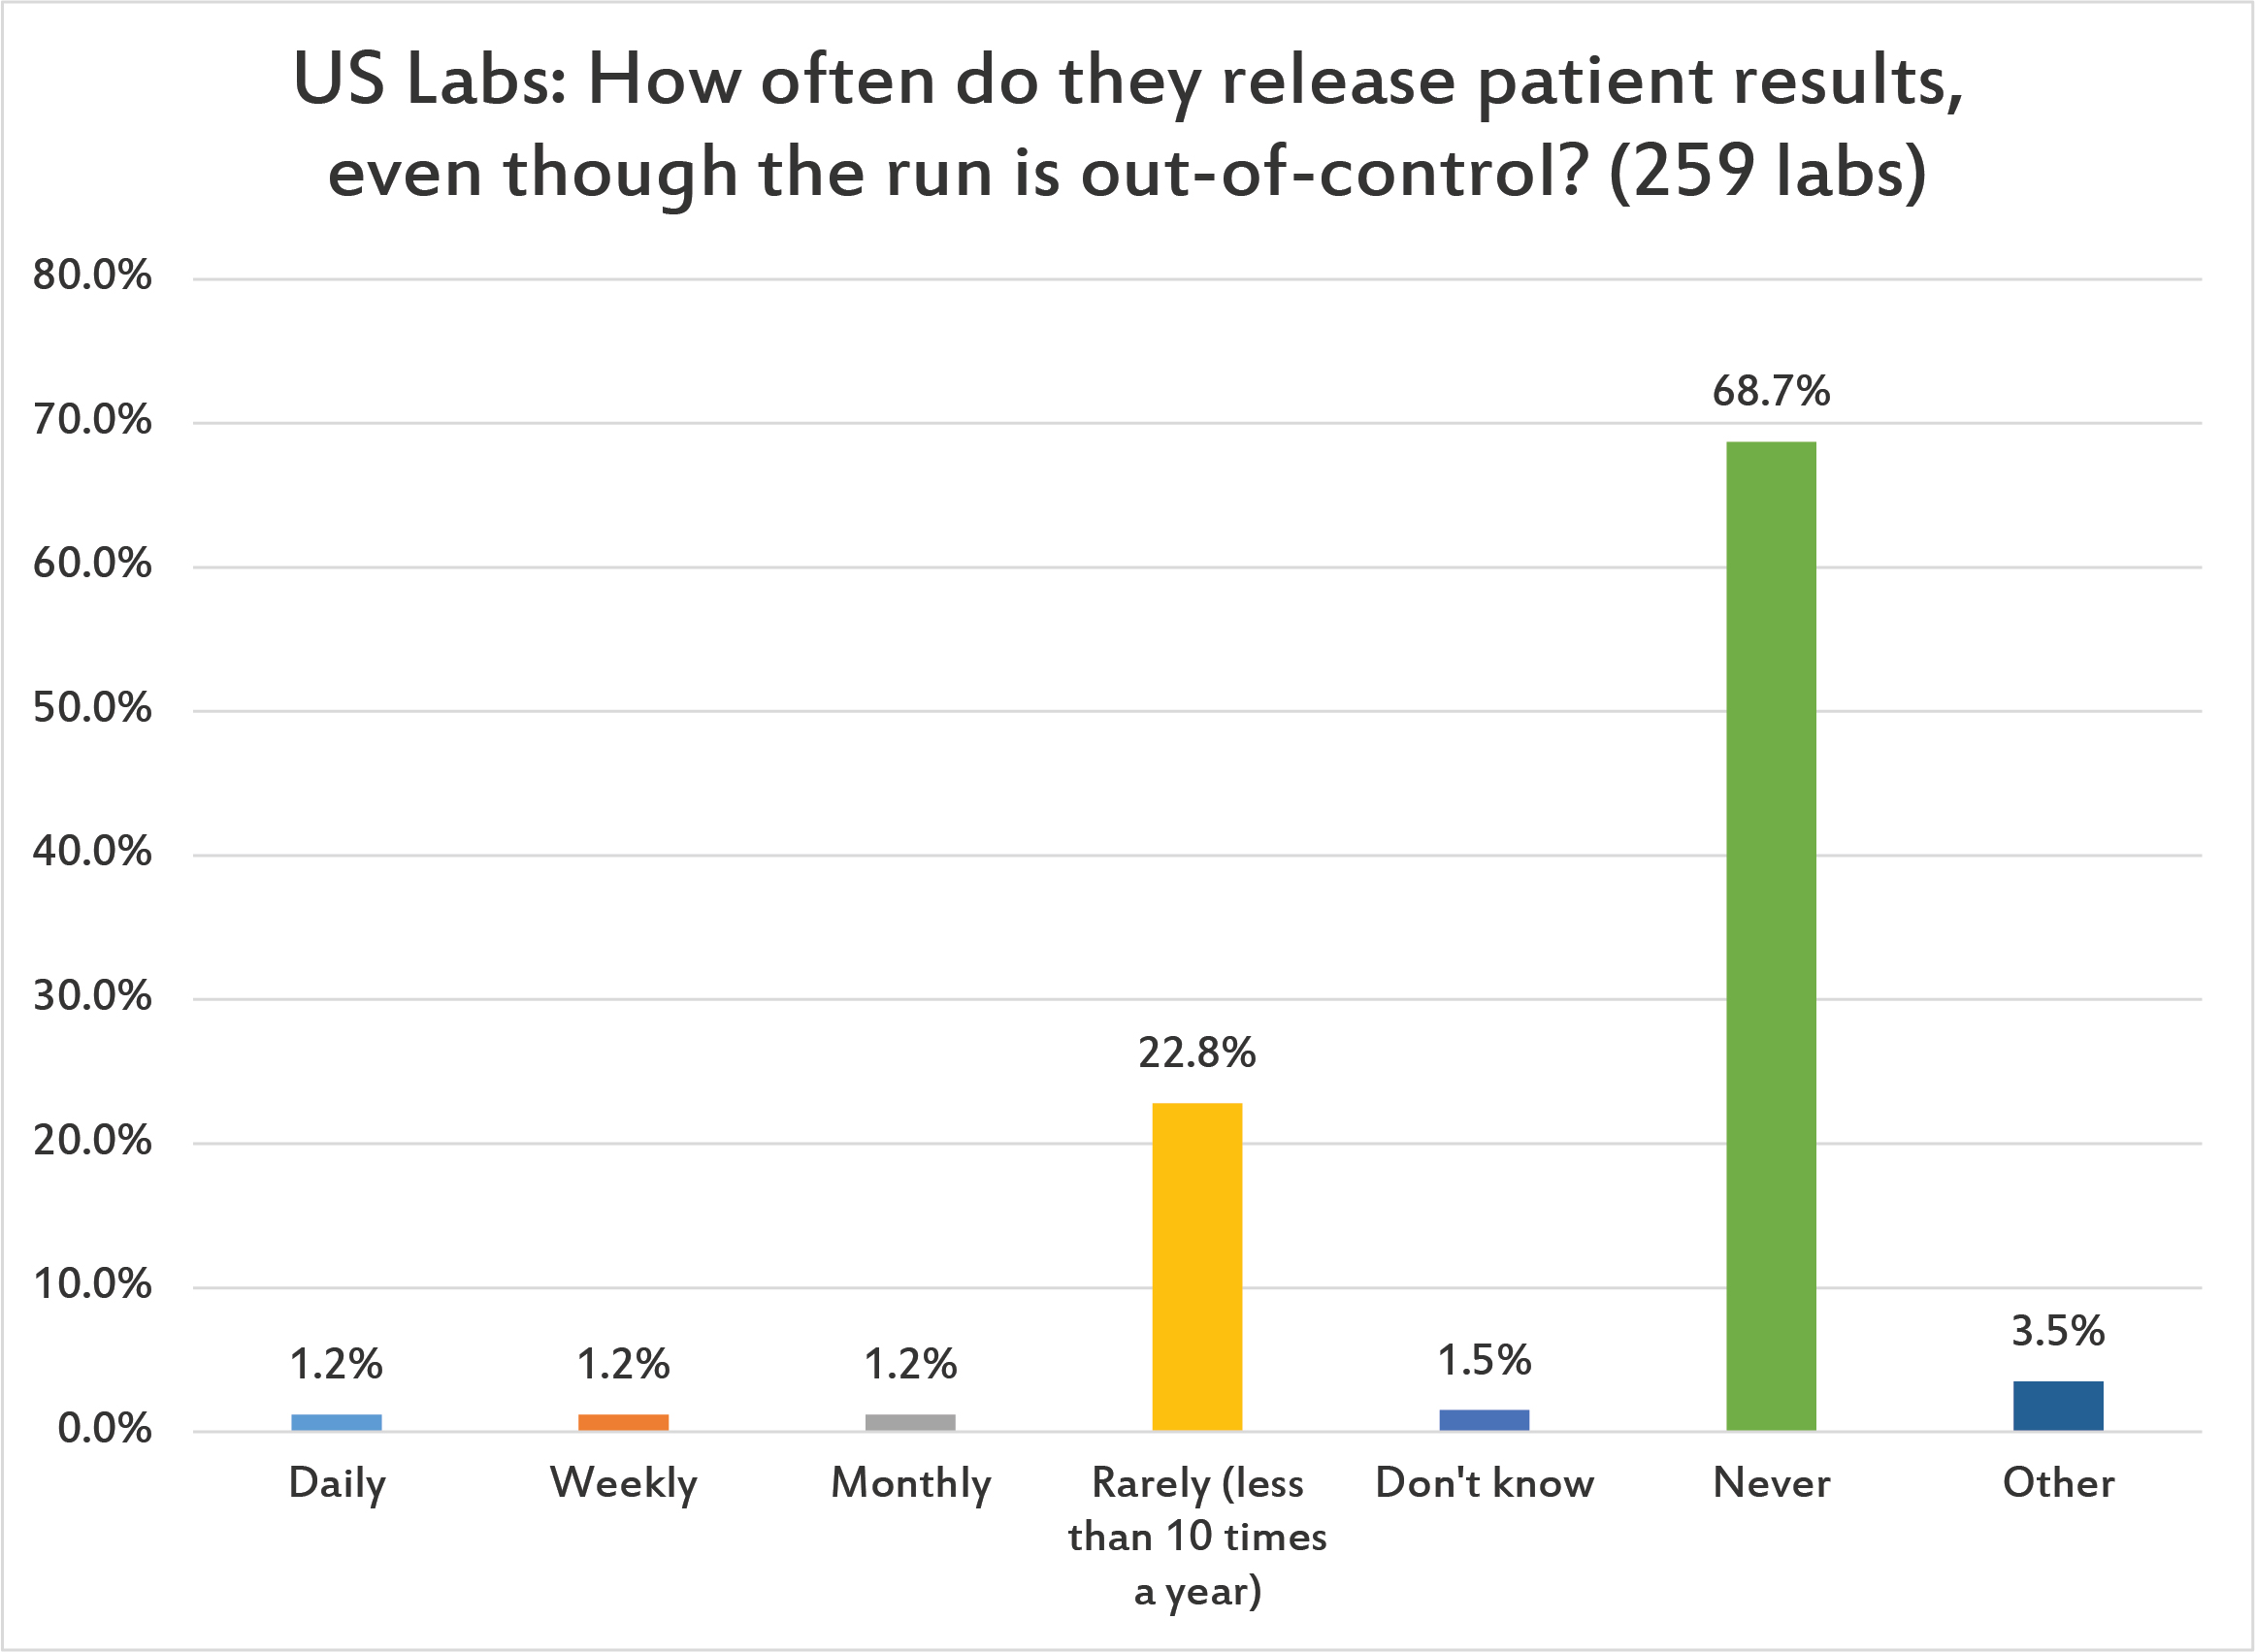
Thankfully, two-thirds of US laboratories report never having released patient results when an out-of-control flag has been logged. However, about 1 in 28 laboratories will do so once a day, once a week, or once a month. This is a low rate, compared to other regions of the world. (However, given that there are lots of control repeats in US laboratories, that may provide the explanation: when out-of-control, US laboratories just repeat themselves back "in", therefore they don't have to worry about releasing patient results when they are "out".)
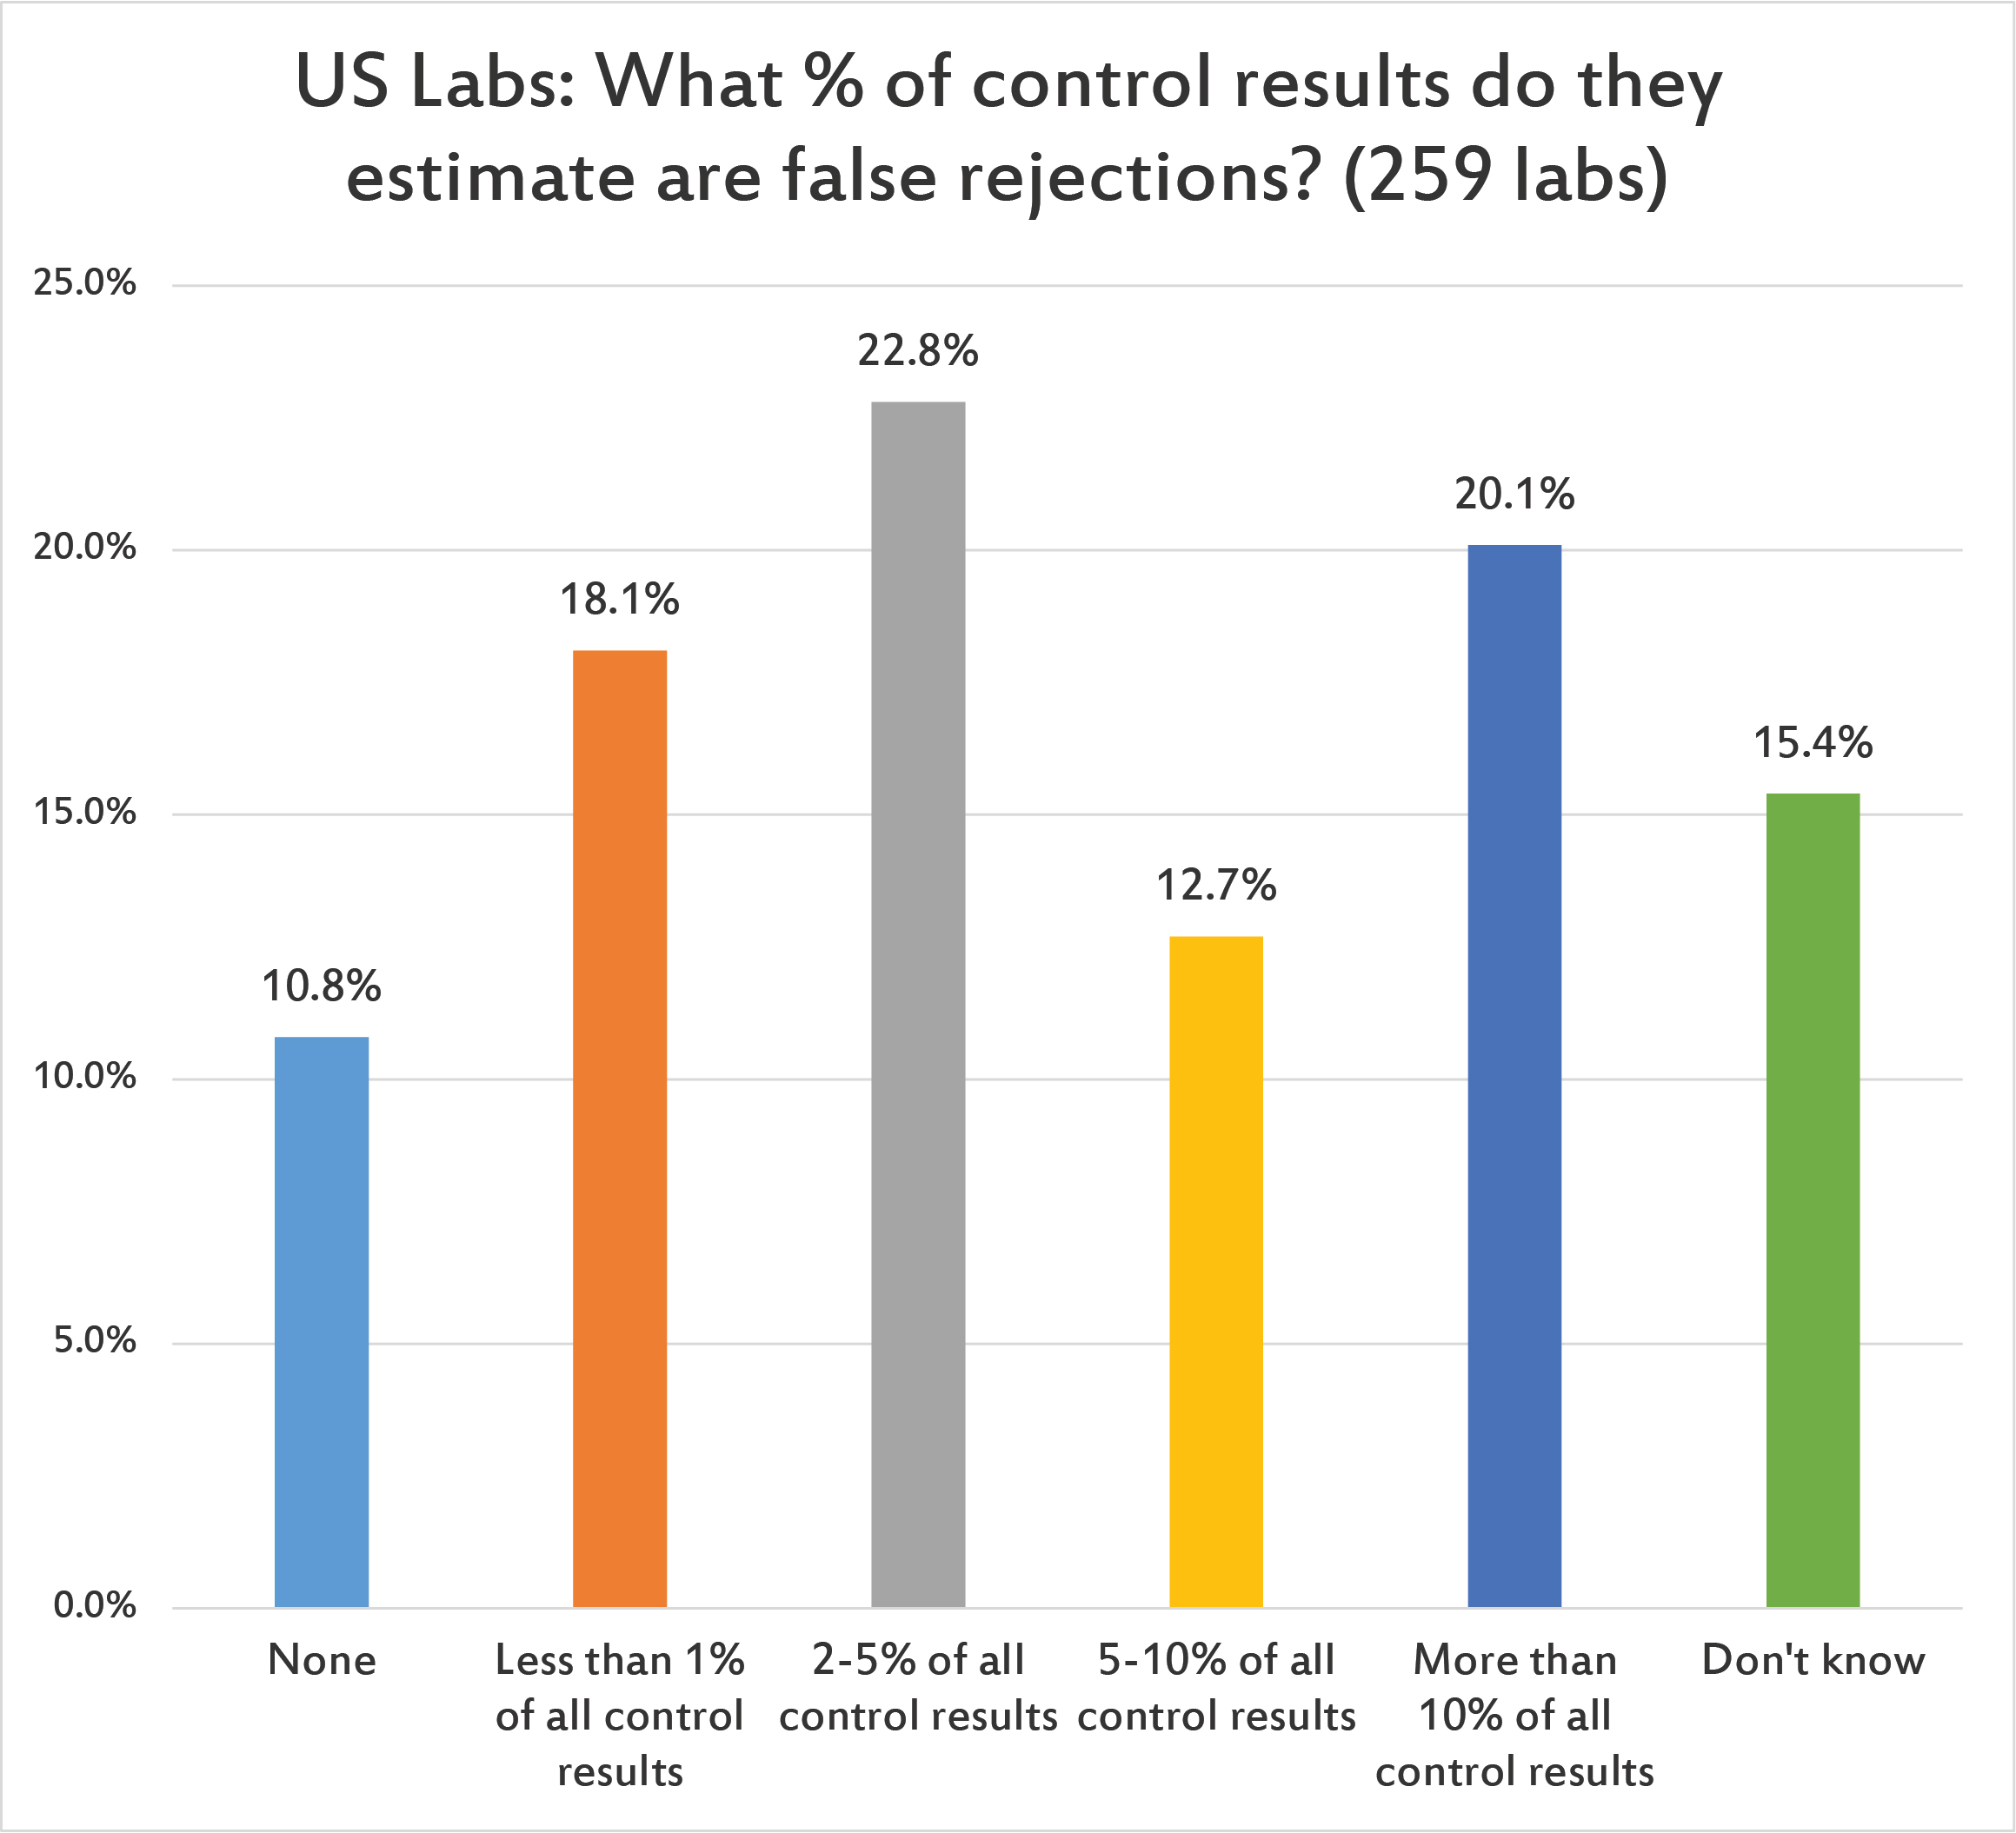
US laboratories have a higher expectation of false rejection in their control results than other regions of the world. (Given the number of repeats US labs experience and implement, perhaps that's an expectation born of experience.) There are still about 1 of 10 labs that believe there is no false rejection rate at all. I wish this were true.
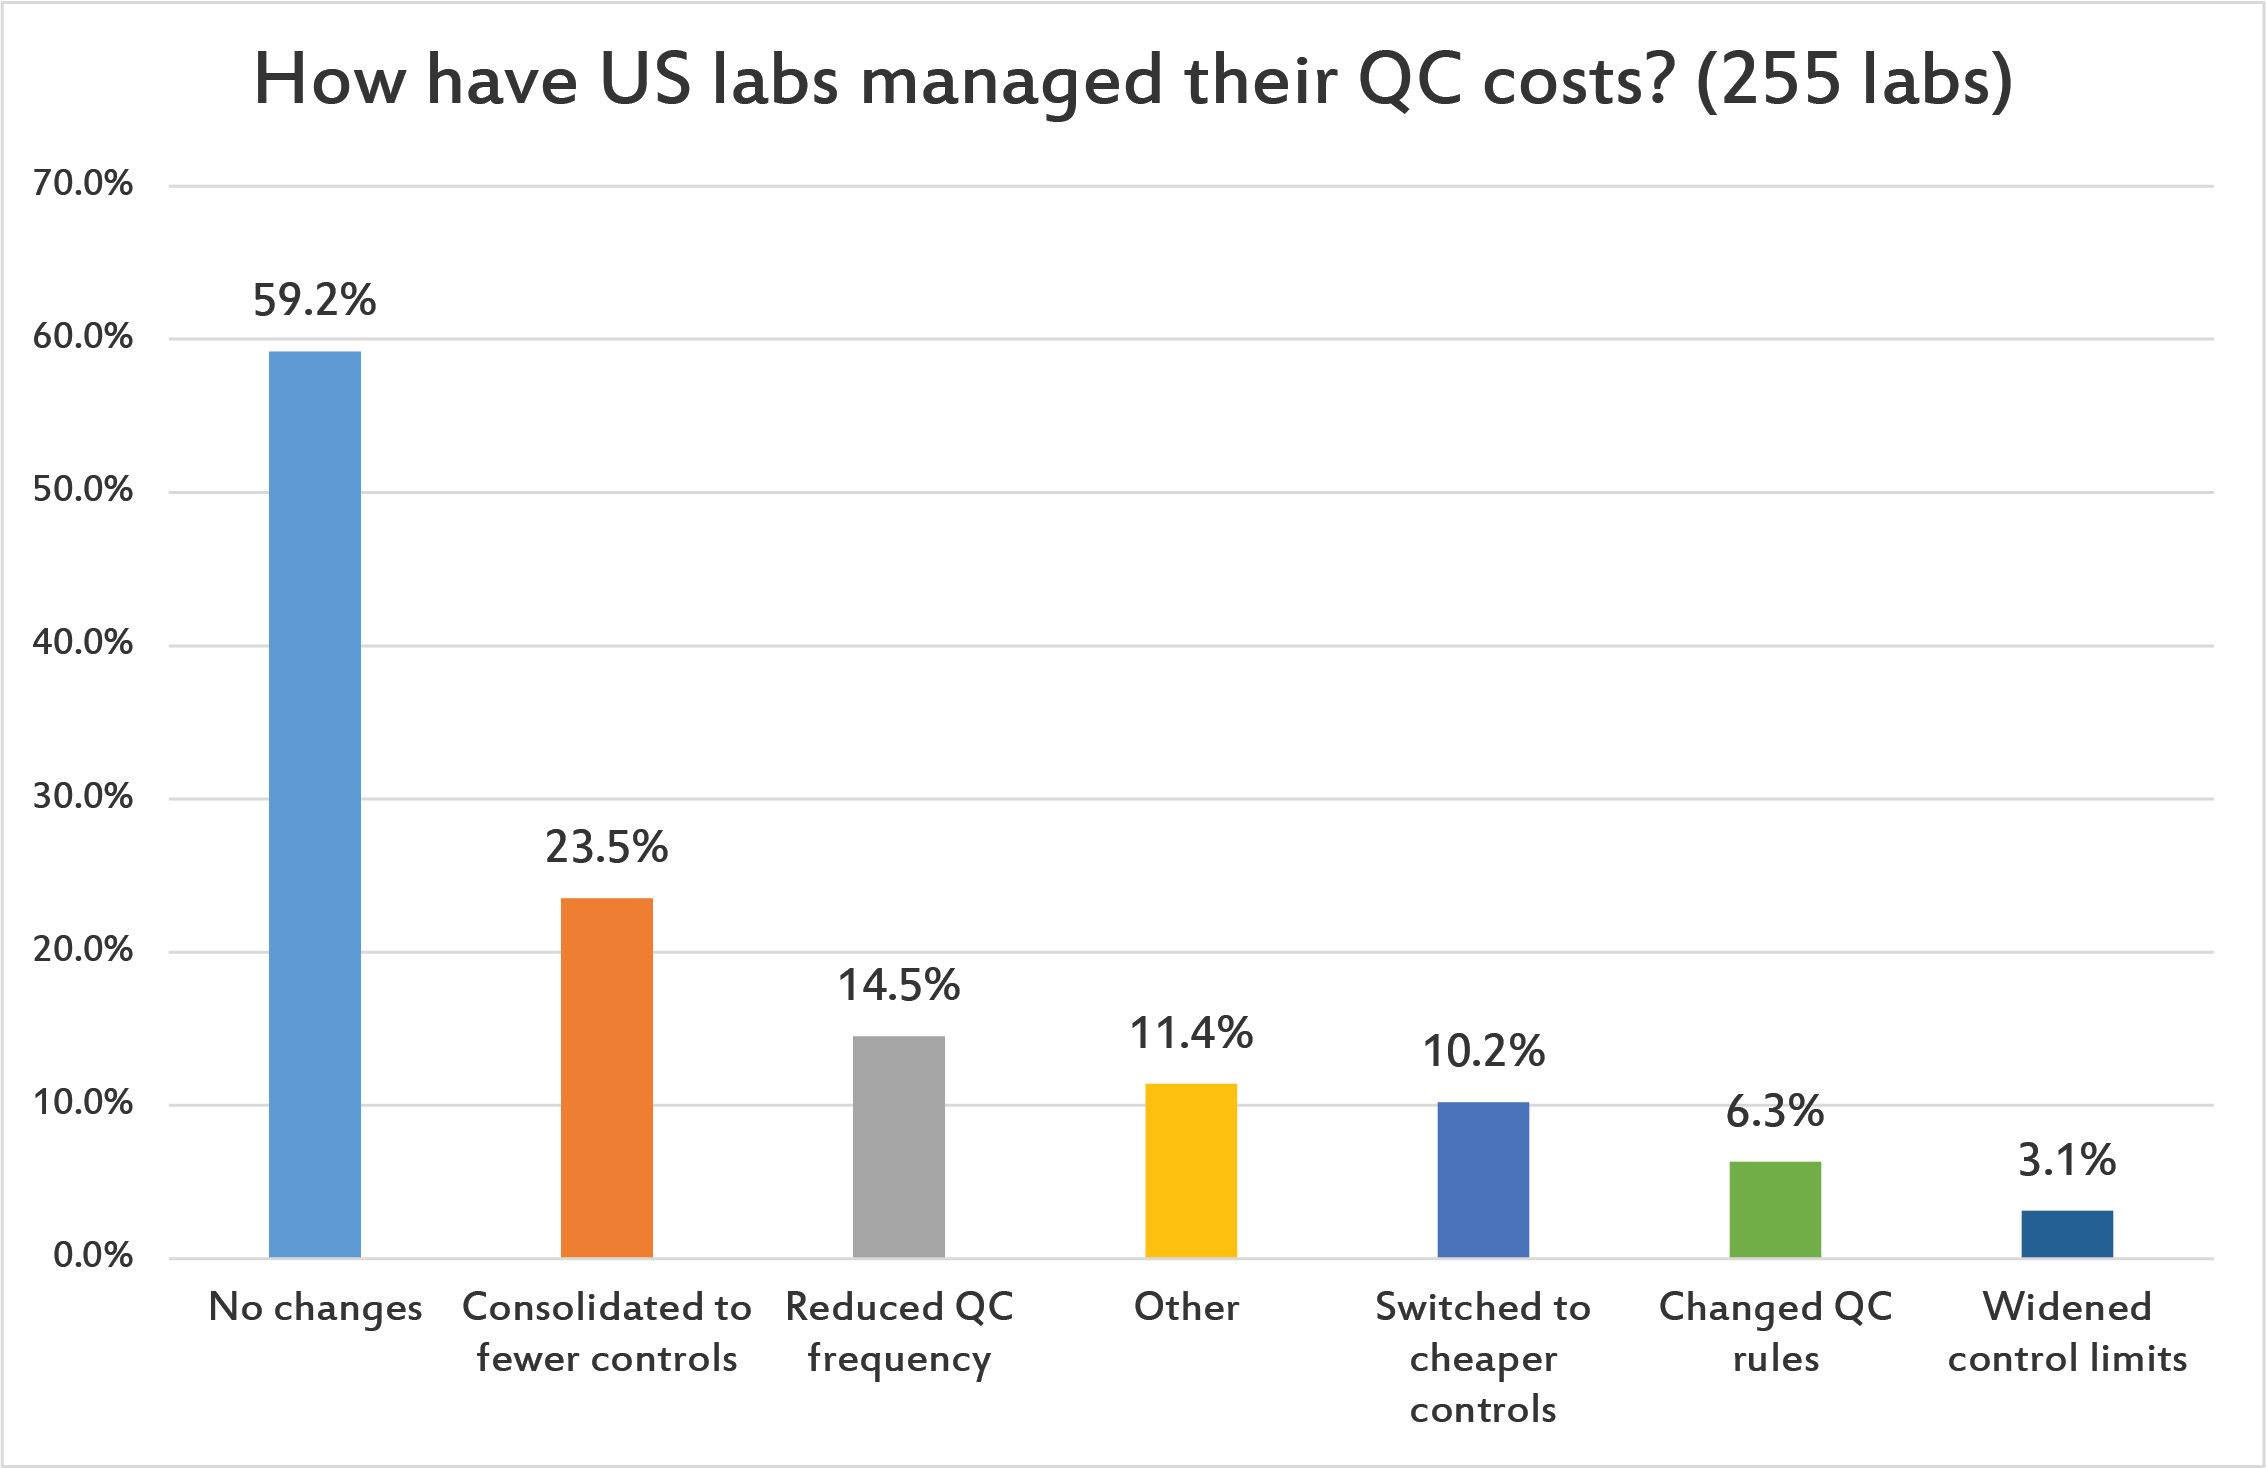
[Multiple answers were allowed for this question.] Nearly 60% of US laboratories have made no changes to manage their QC costs. Less than a quarter of labs have consolidated their QC into fewer controls. Fewer still have switched to cheaper controls, changed QC rules or widened their control ranges. (Given all the controls that are being used and repeated, this represents a large cost that has been unexamined.)
In conclusion, US laboratories are in a curious position: they are advanced in some practices (very rare releases of tests when out-of-control), but less advanced in others (the habit of repeating controls is strong and well-entrenched). There are significant needs and opportunities to revise and improve QC practices, ones that will most likely result in efficiency gains in time, money, and effort. Given the harsh financial pressures facing the future of US laboratories, they cannot afford to let these opportunities go unexplored.
For a free copy of these graphs, go to our download section.