Basic QC Practices
The Great Global QC Survey: Results from Global (non-US) Laboratories
More than 500 laboratories outside the US participated in the Great Global QC Survey. What do their results tell us about the state of global quality control? Are they doing better QC than the US?
The Great Global QC Survey: Results from the Rest of the World (not the US)
June 2017
Sten Westgard, MS
For a free copy of these graphs, go to our download section.
More than 60% of the participants in the QC Survey were from outside the US. So we have the chance to focus on that global segment and take the US practices out of the picture. What QC practices are dominant in the rest of the world? Where does the US fall short of global practices?
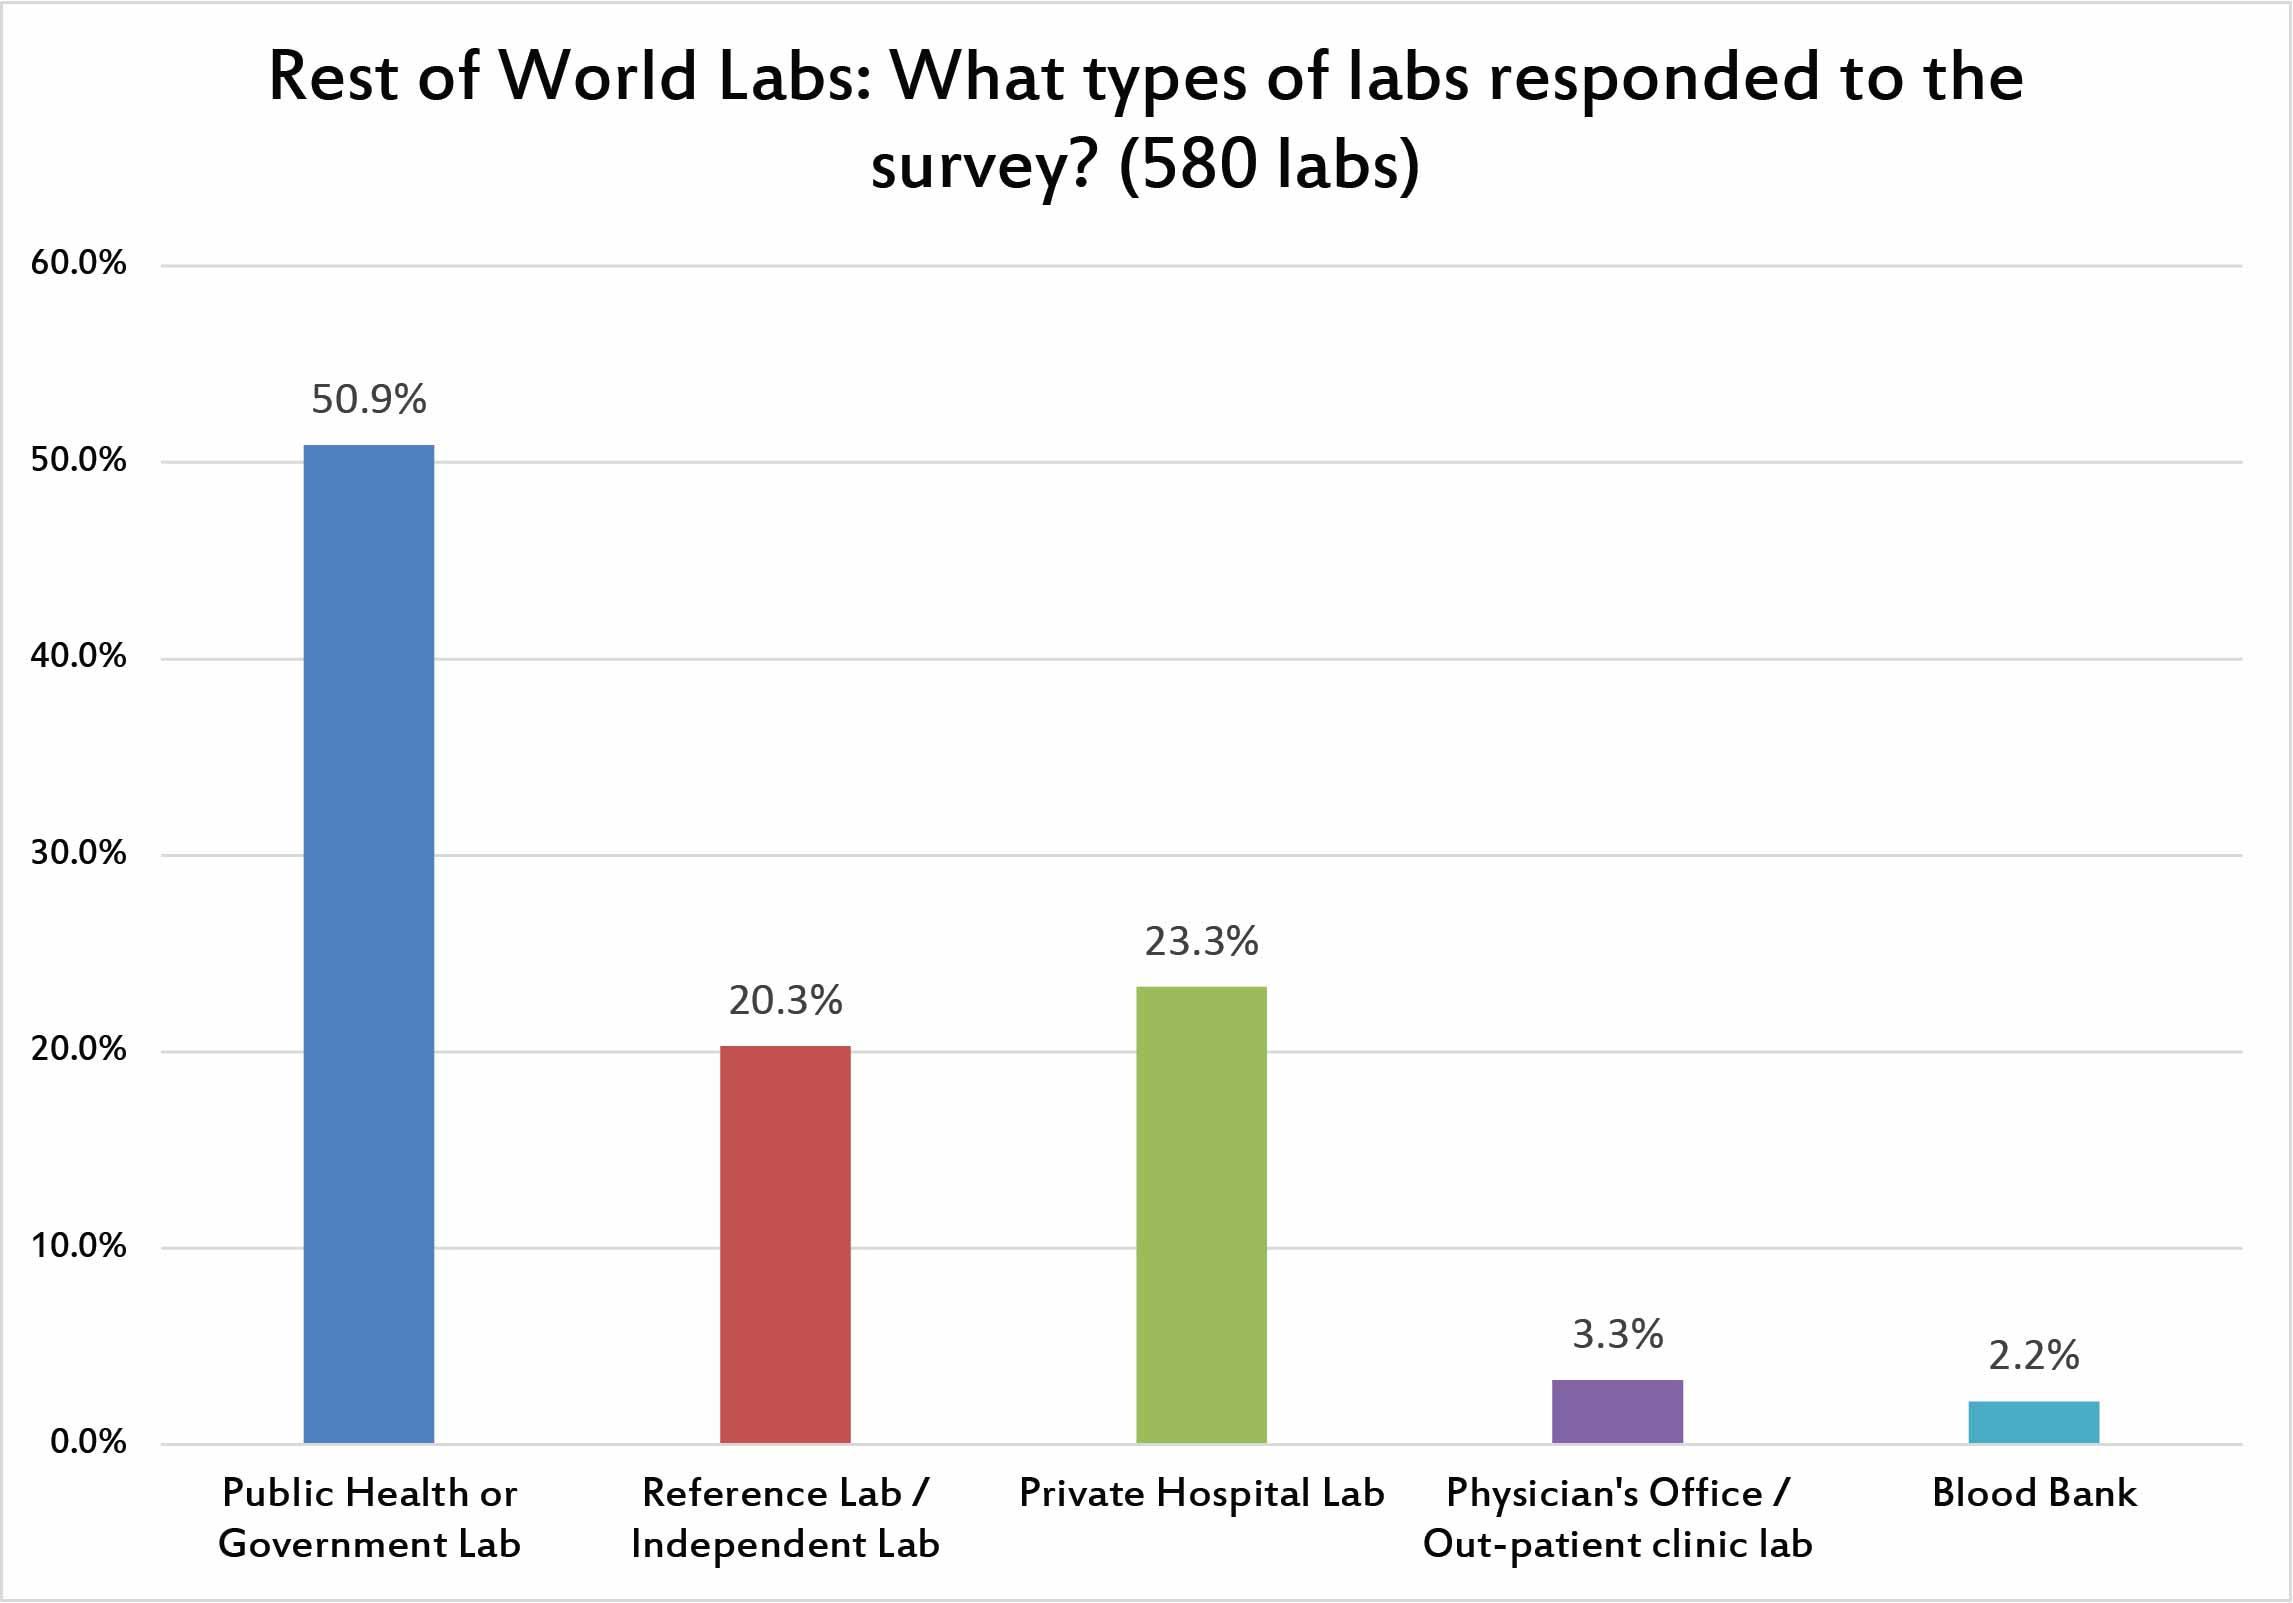
Unlike the US, where mostly prvate hospital laboratories responded to the survey, the majority of the rest of world responses came from public or government laboratories. That makes sense when we take into account that many healthcare systems around the world are socialized and run as public institutions.
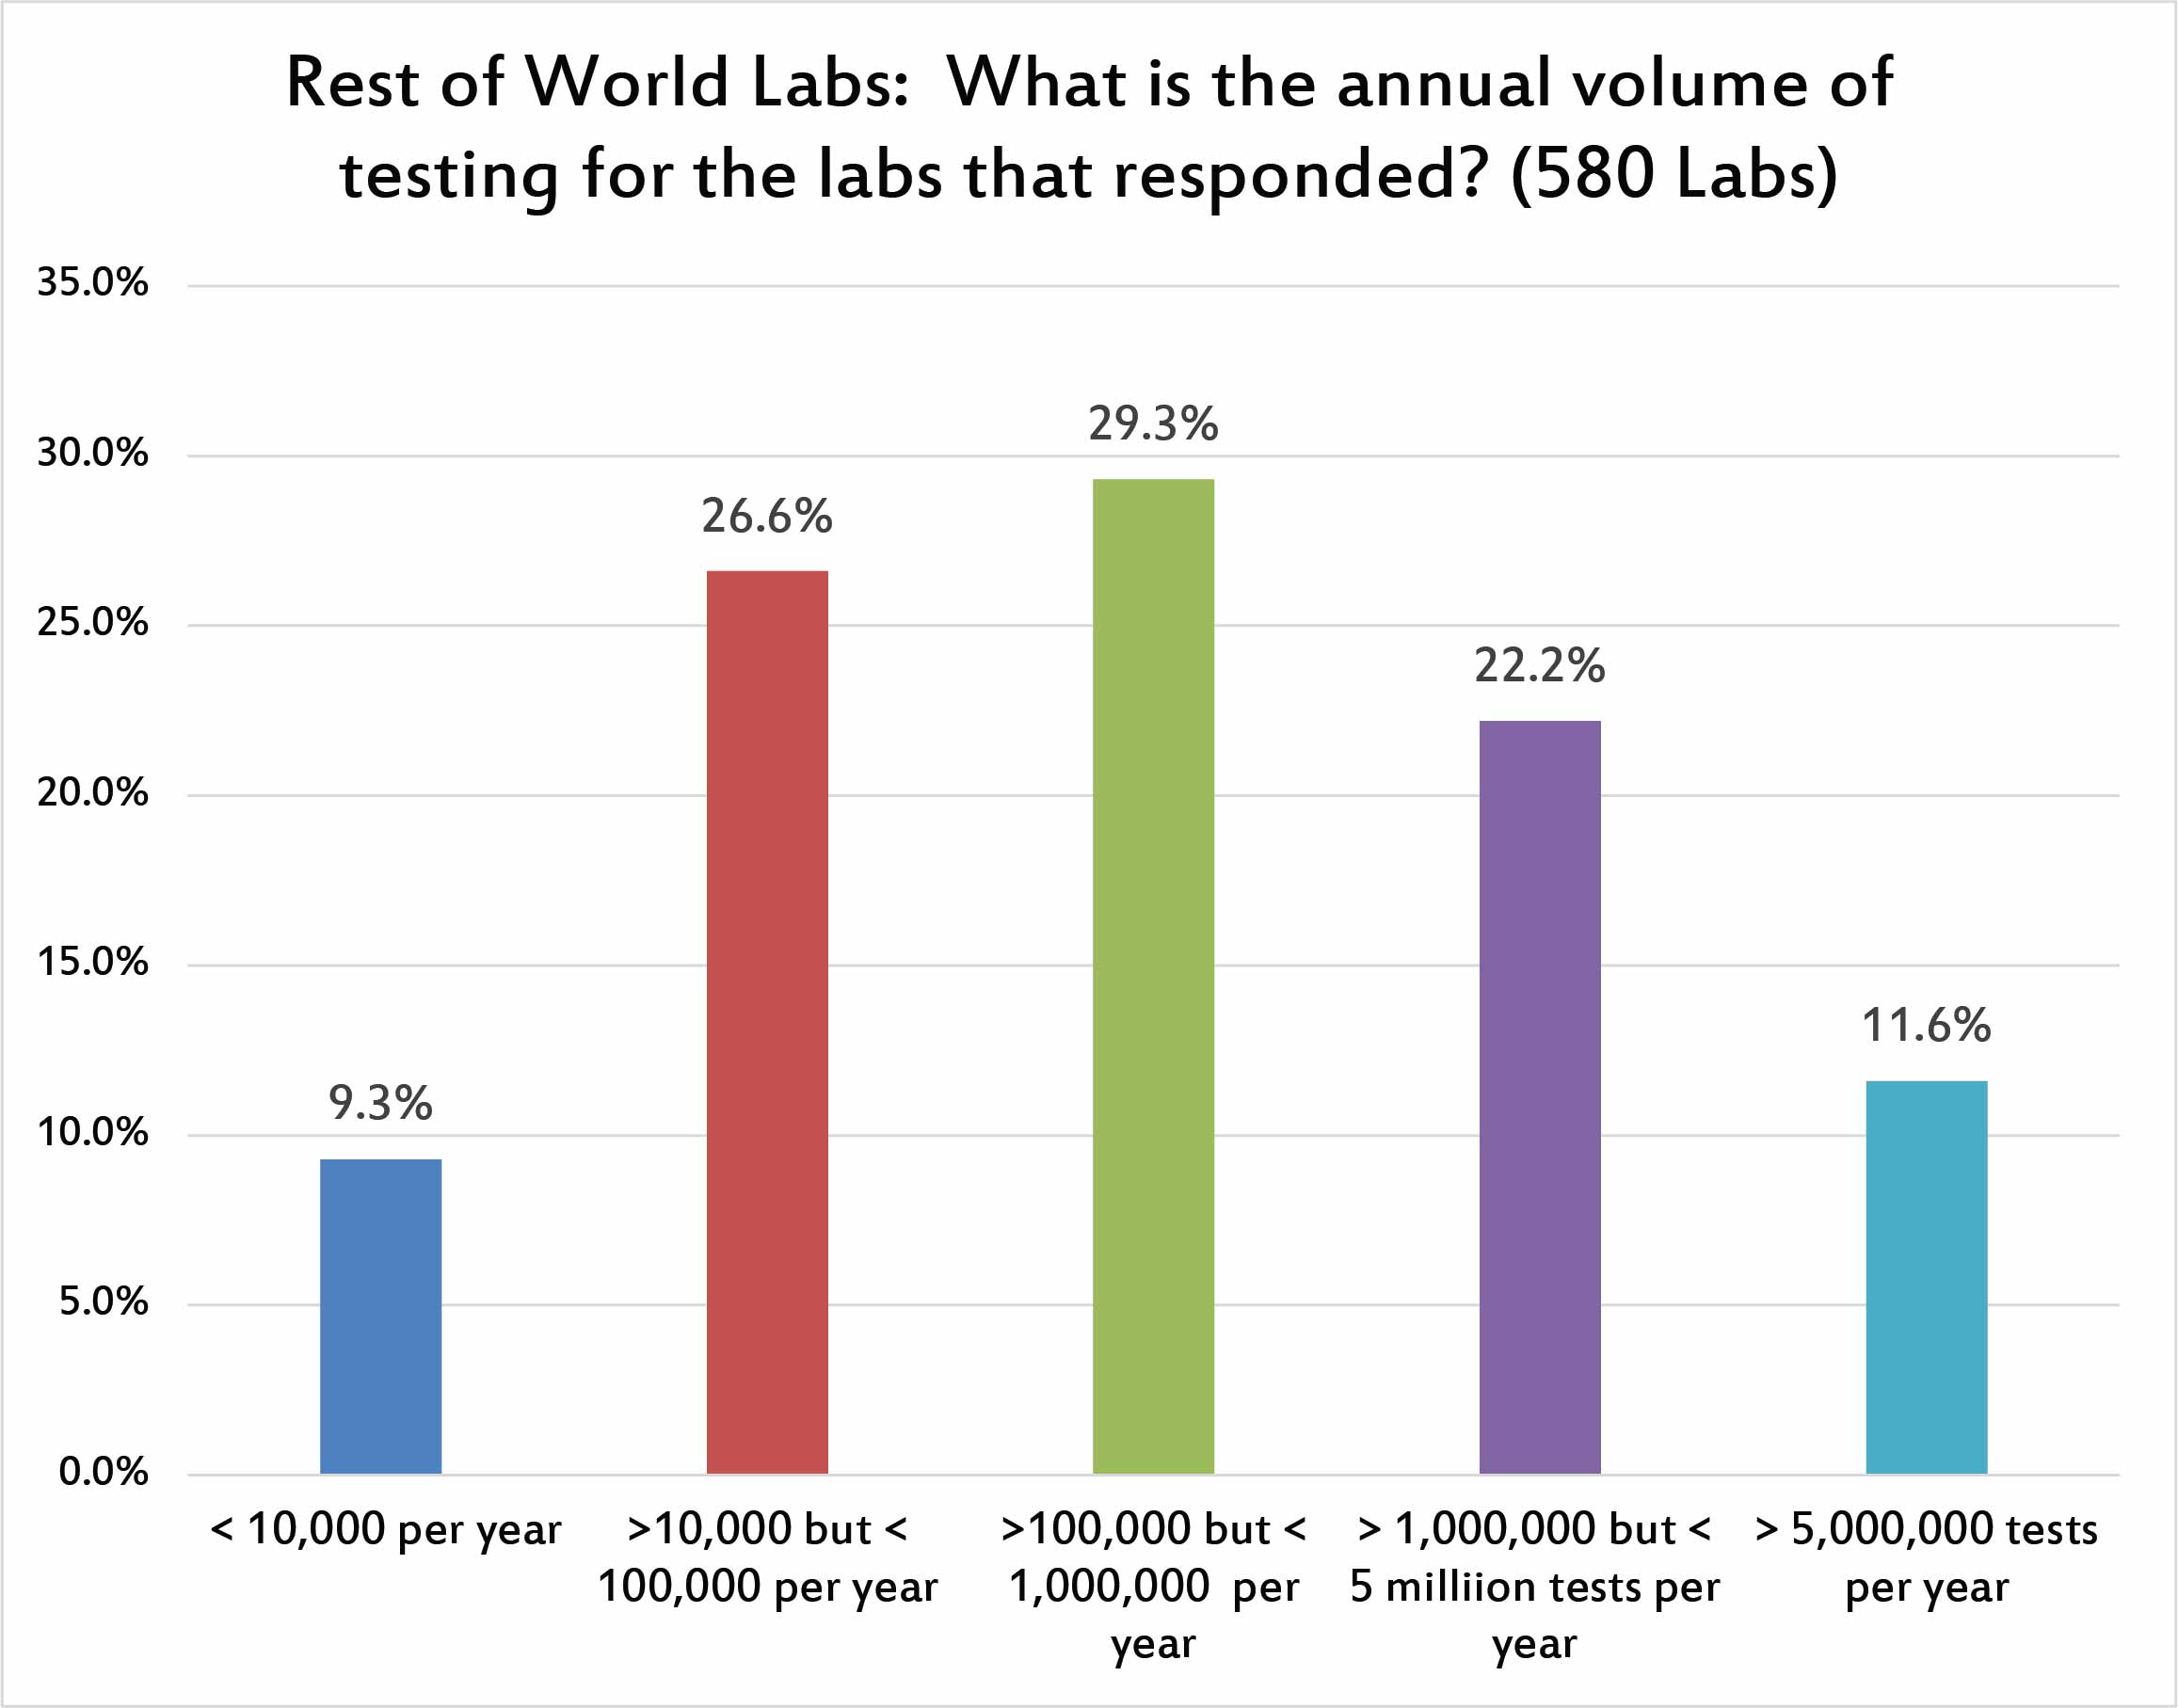
This breakdown is quite similar to the US distribution of responses. The largest number of answers came from hospitals running less than 1 million tests, but more than 100,000 tests per year.
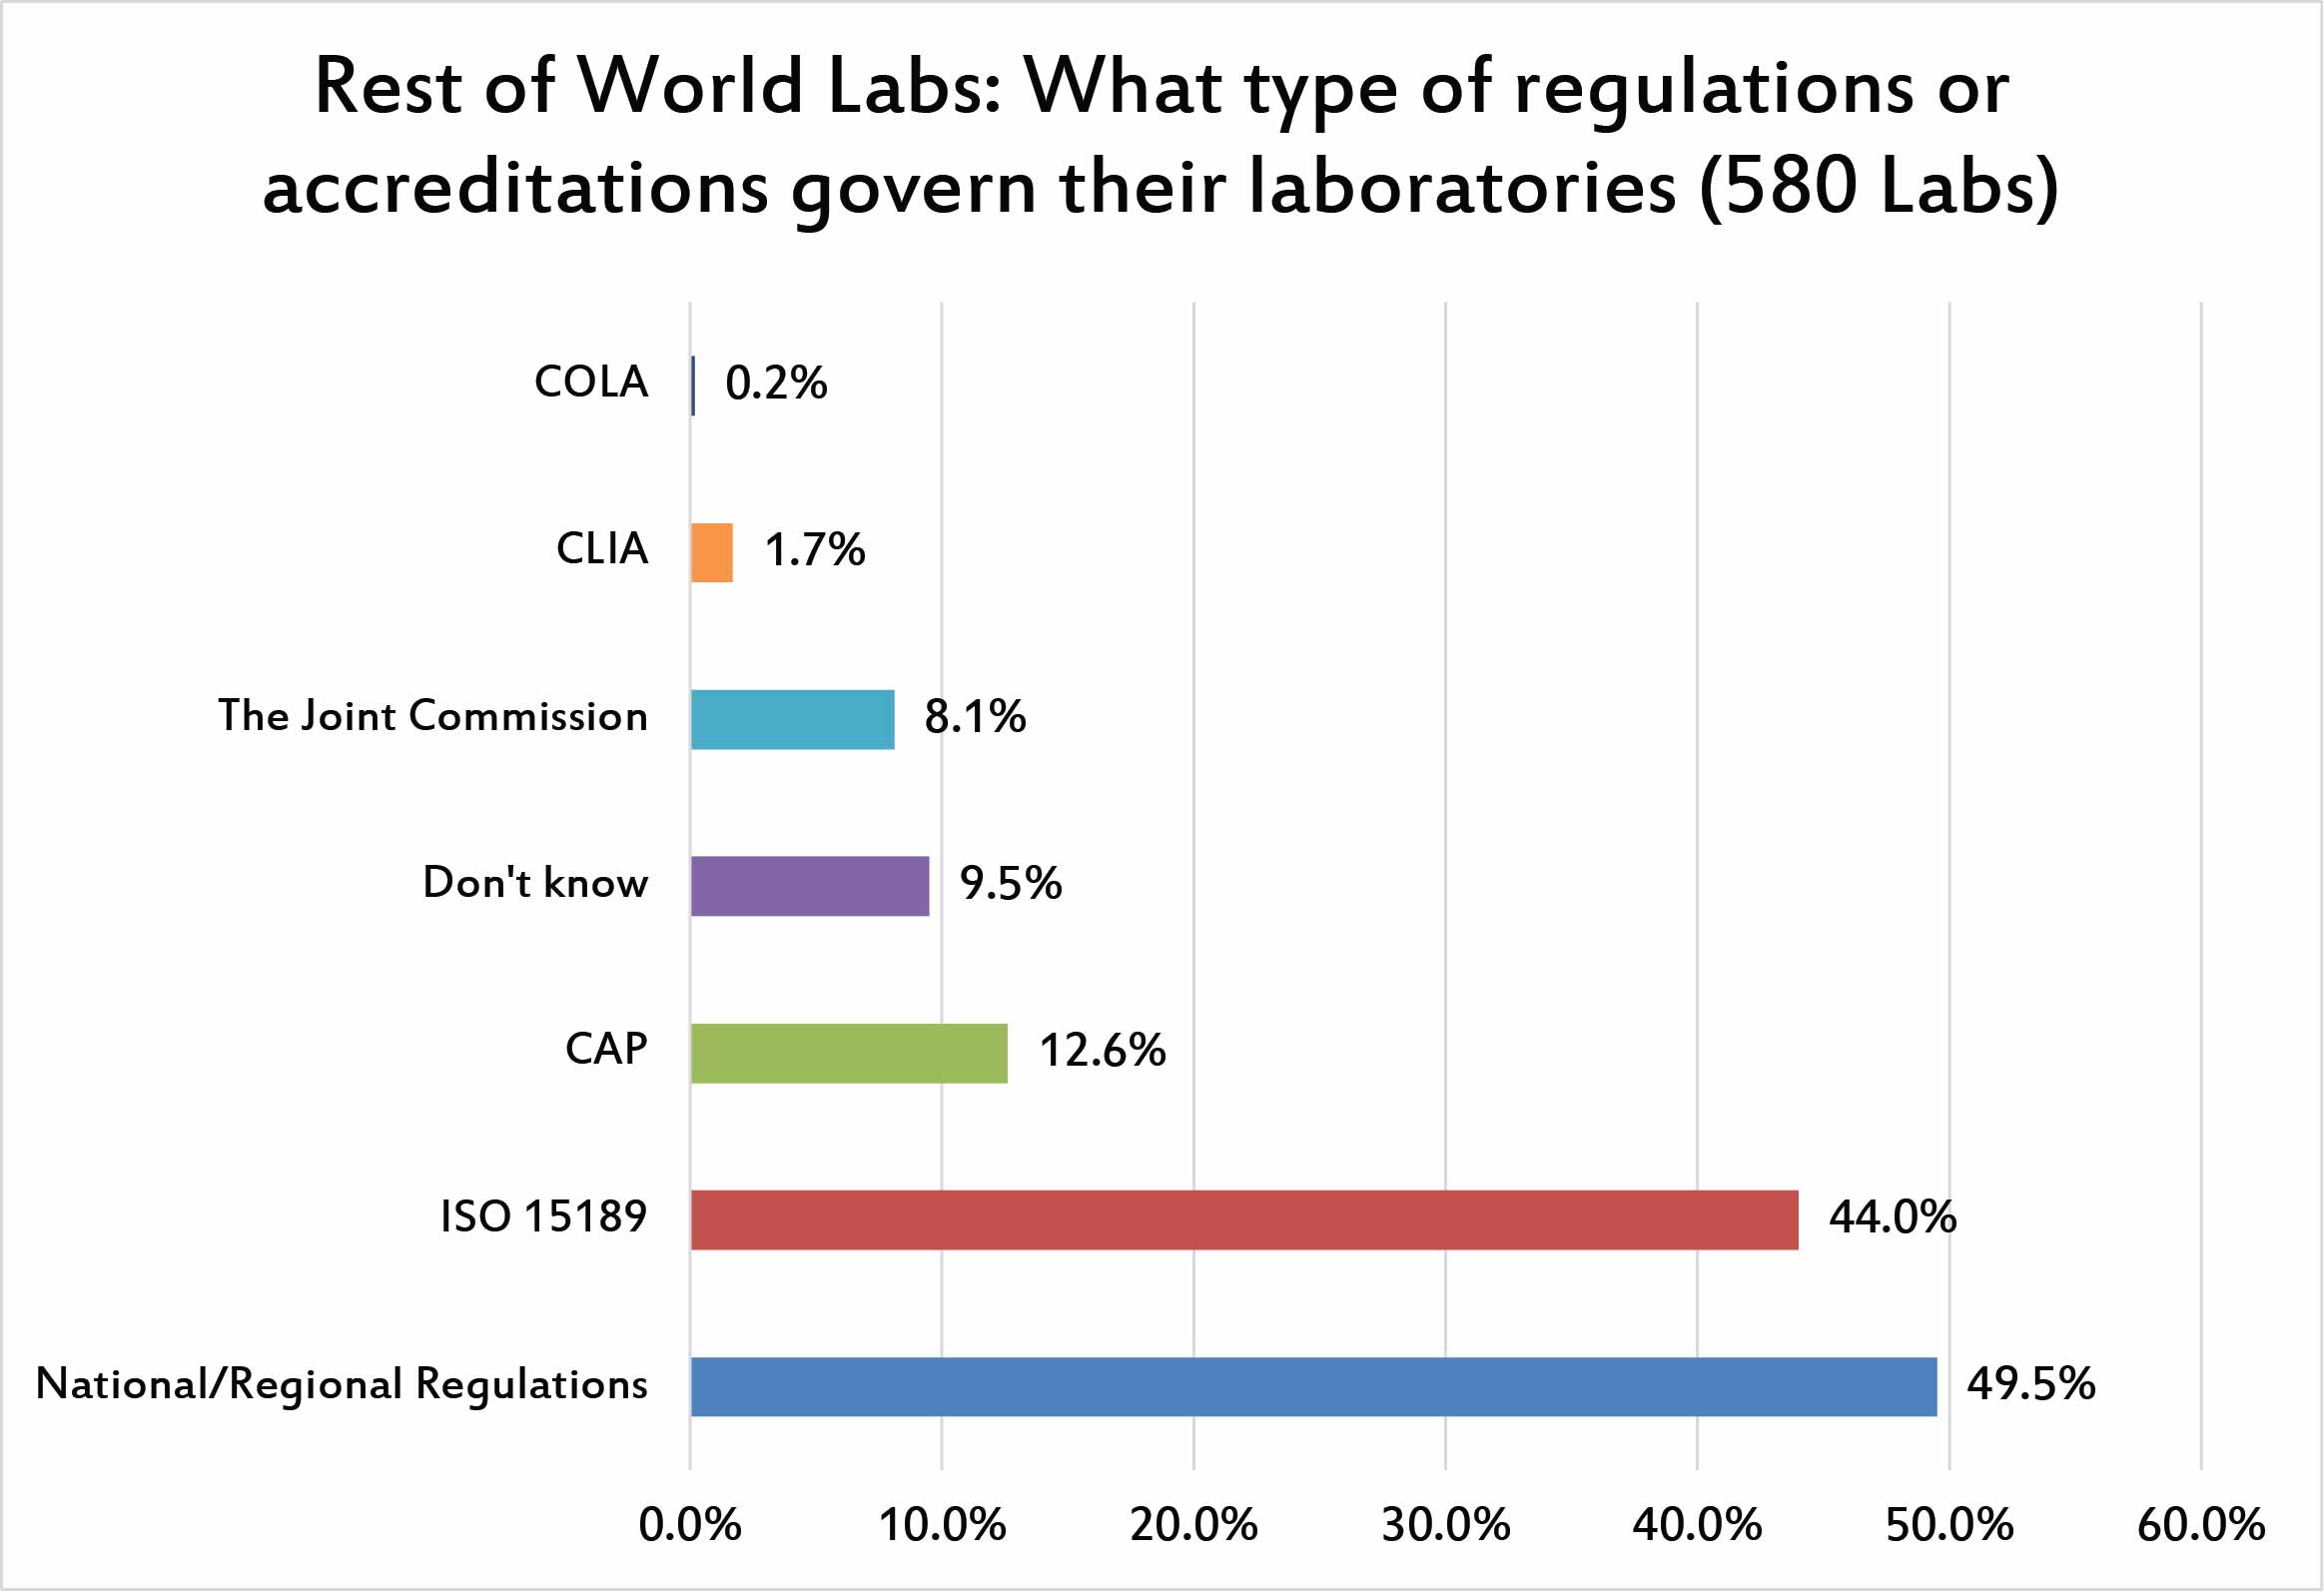
Not surprisingly, the dominant accreditation and regulations that govern a laboratory are their own country-specific policies, followed swiftly by ISO 15189. Nearly half of labs around the world are influenced by this ISO standard. Other accreditations from CAP, or JCI are much smaller in their role. And CLIA, which plays such a huge role within the US, has a miniscule impact on the rest of the world.
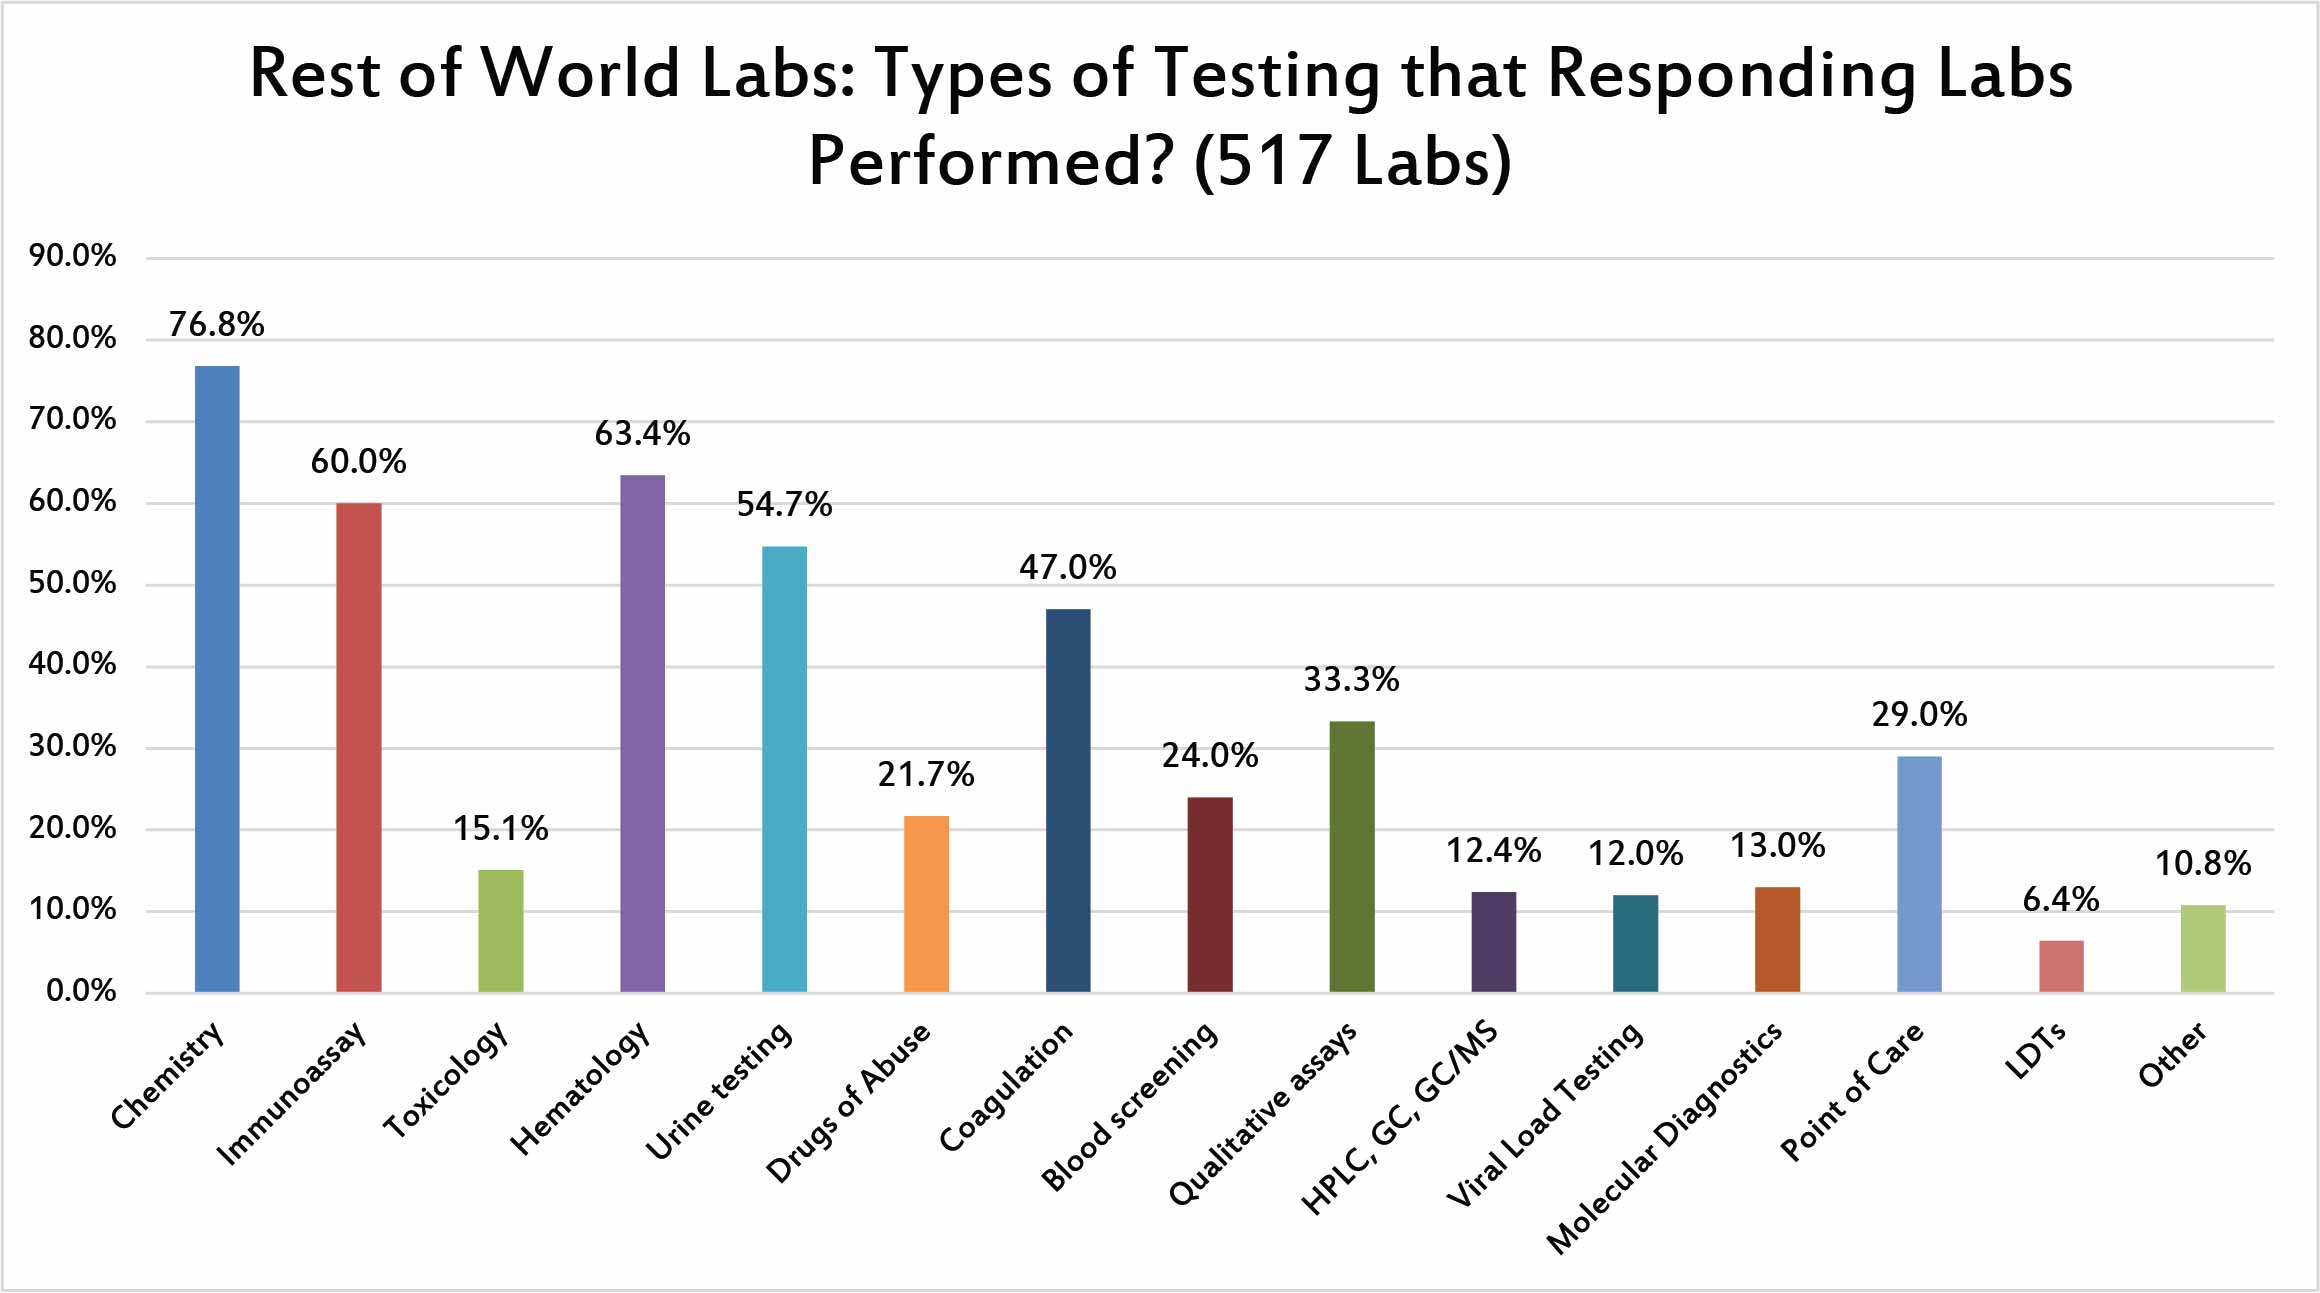
The predominant testing being performed by the respondents is very similar to the US respondents. Chemistry, hematology, immunoassay, and urine testing are the top four testing areas where they are involved.
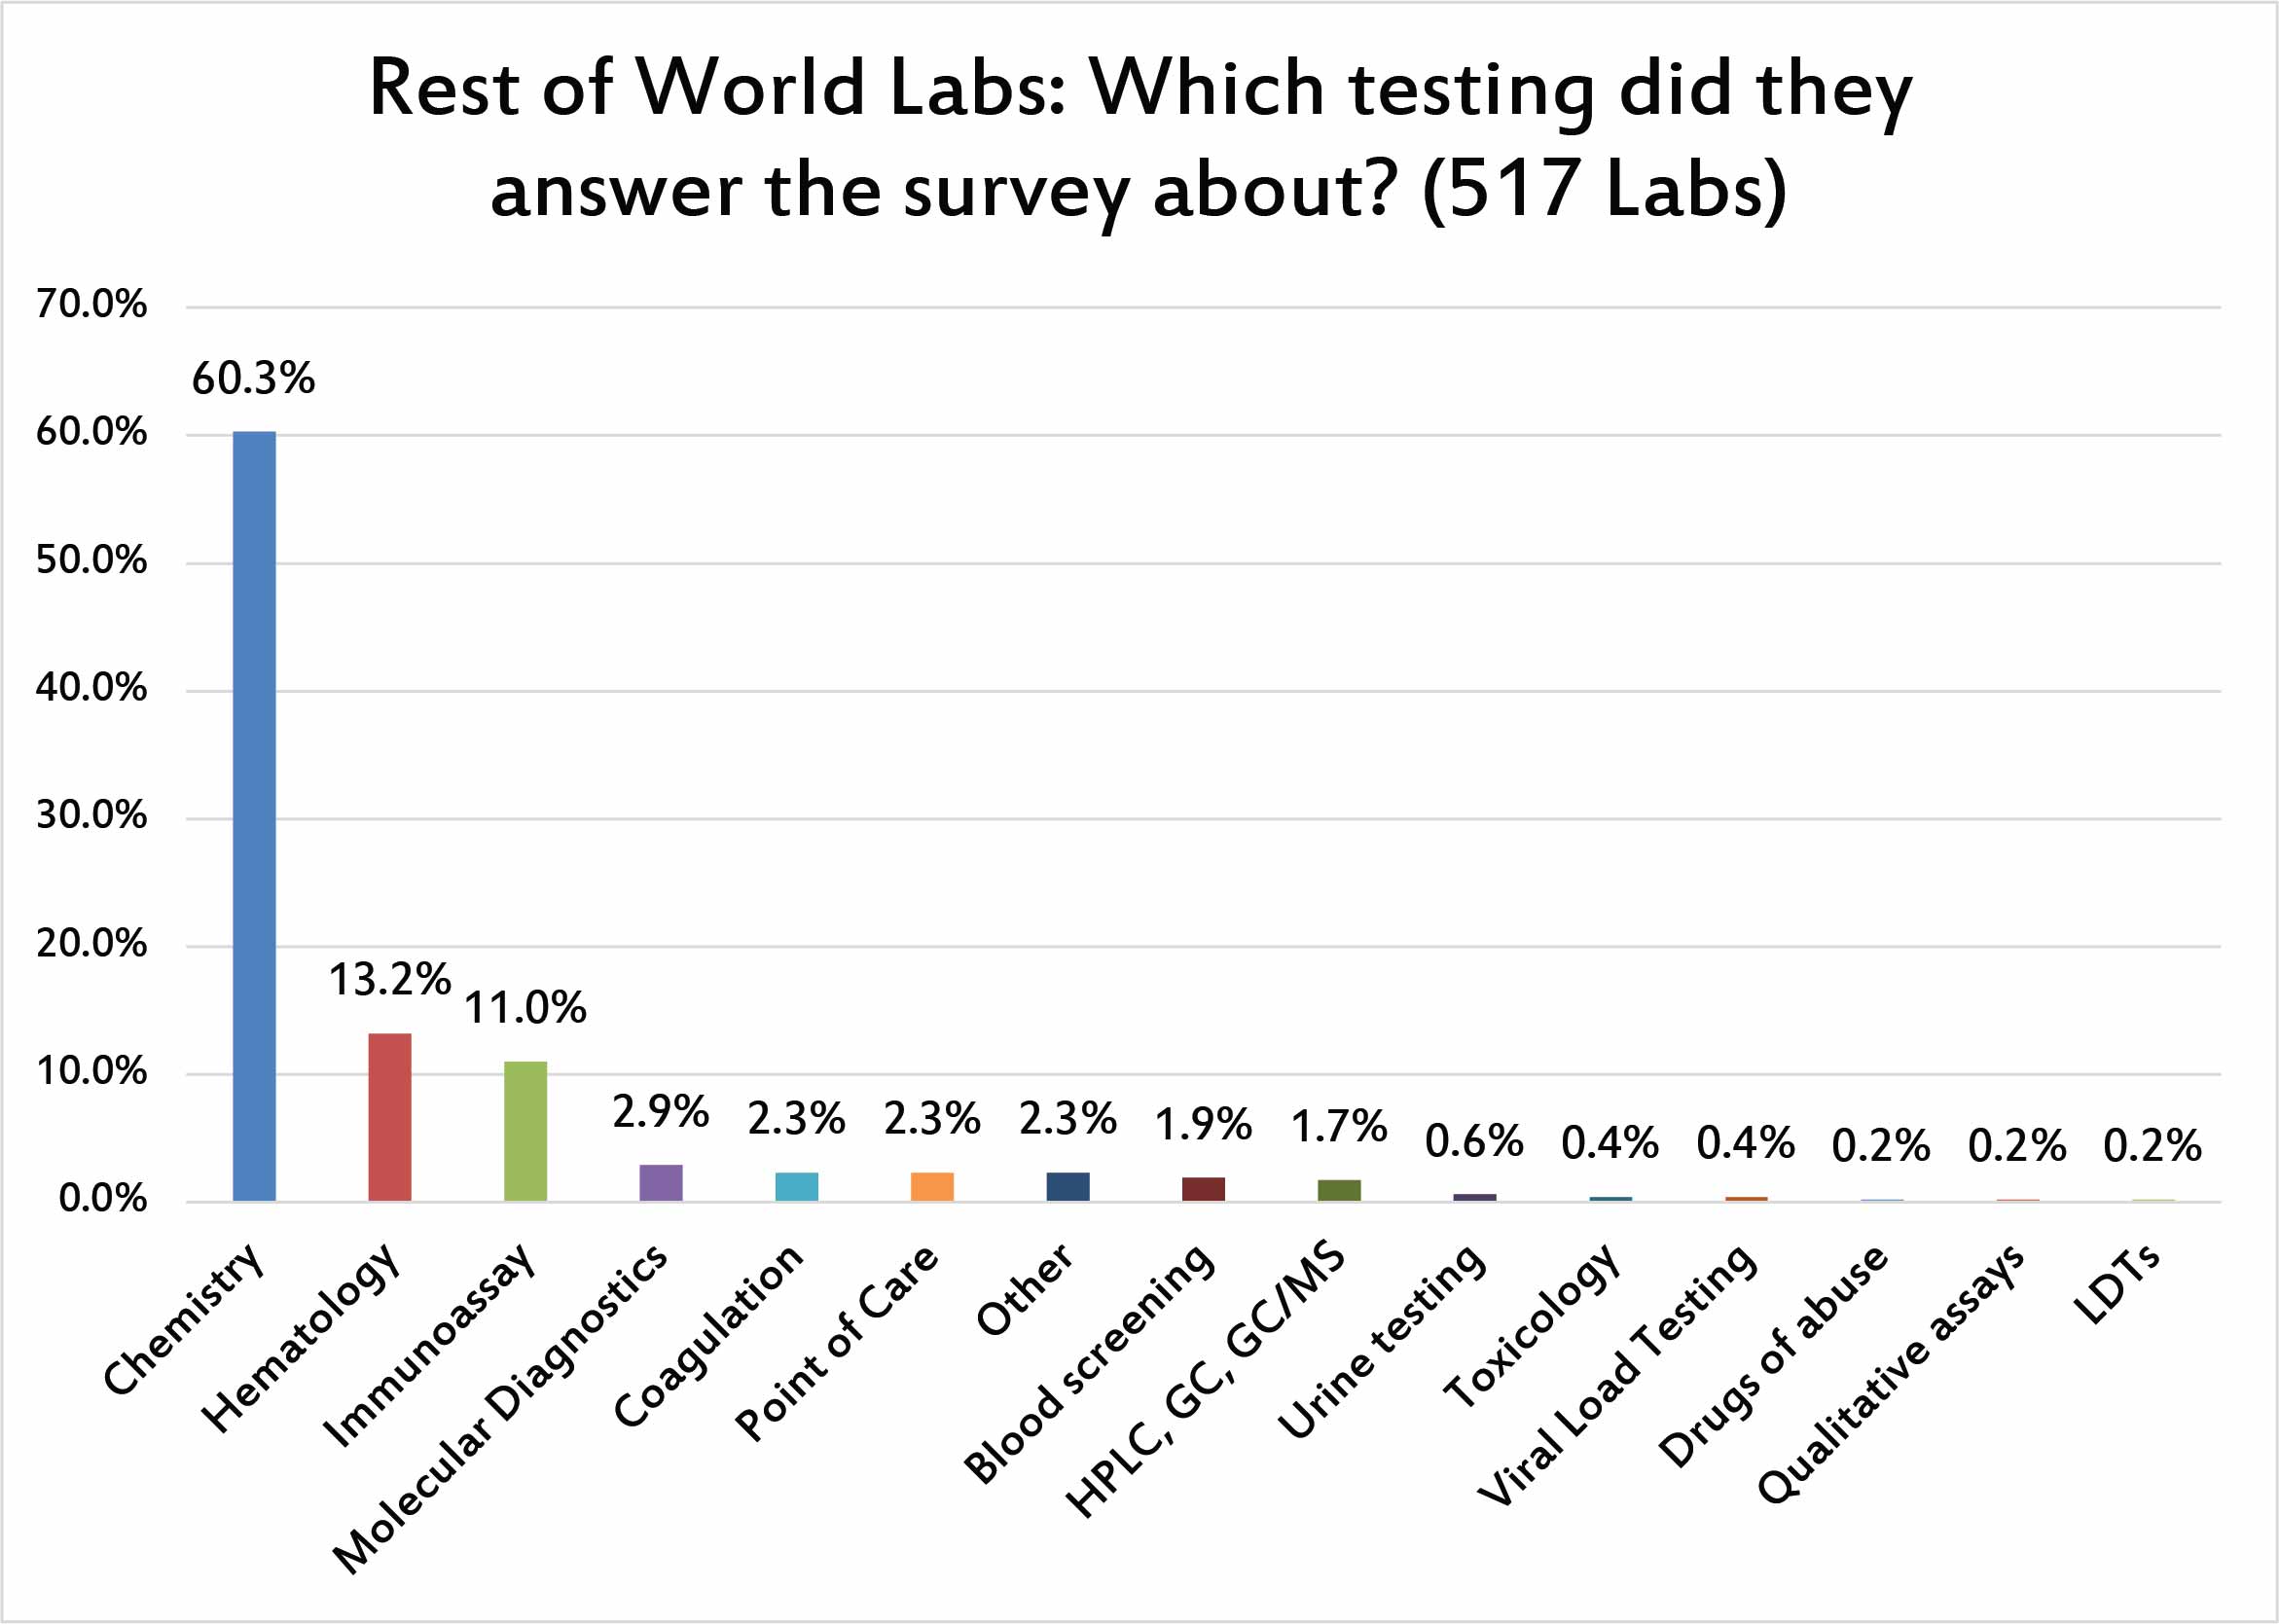
When we asked respondents to concentrate their answers on one particular type of testing, the dominant majority chose chemistry as the testing they will discuss.
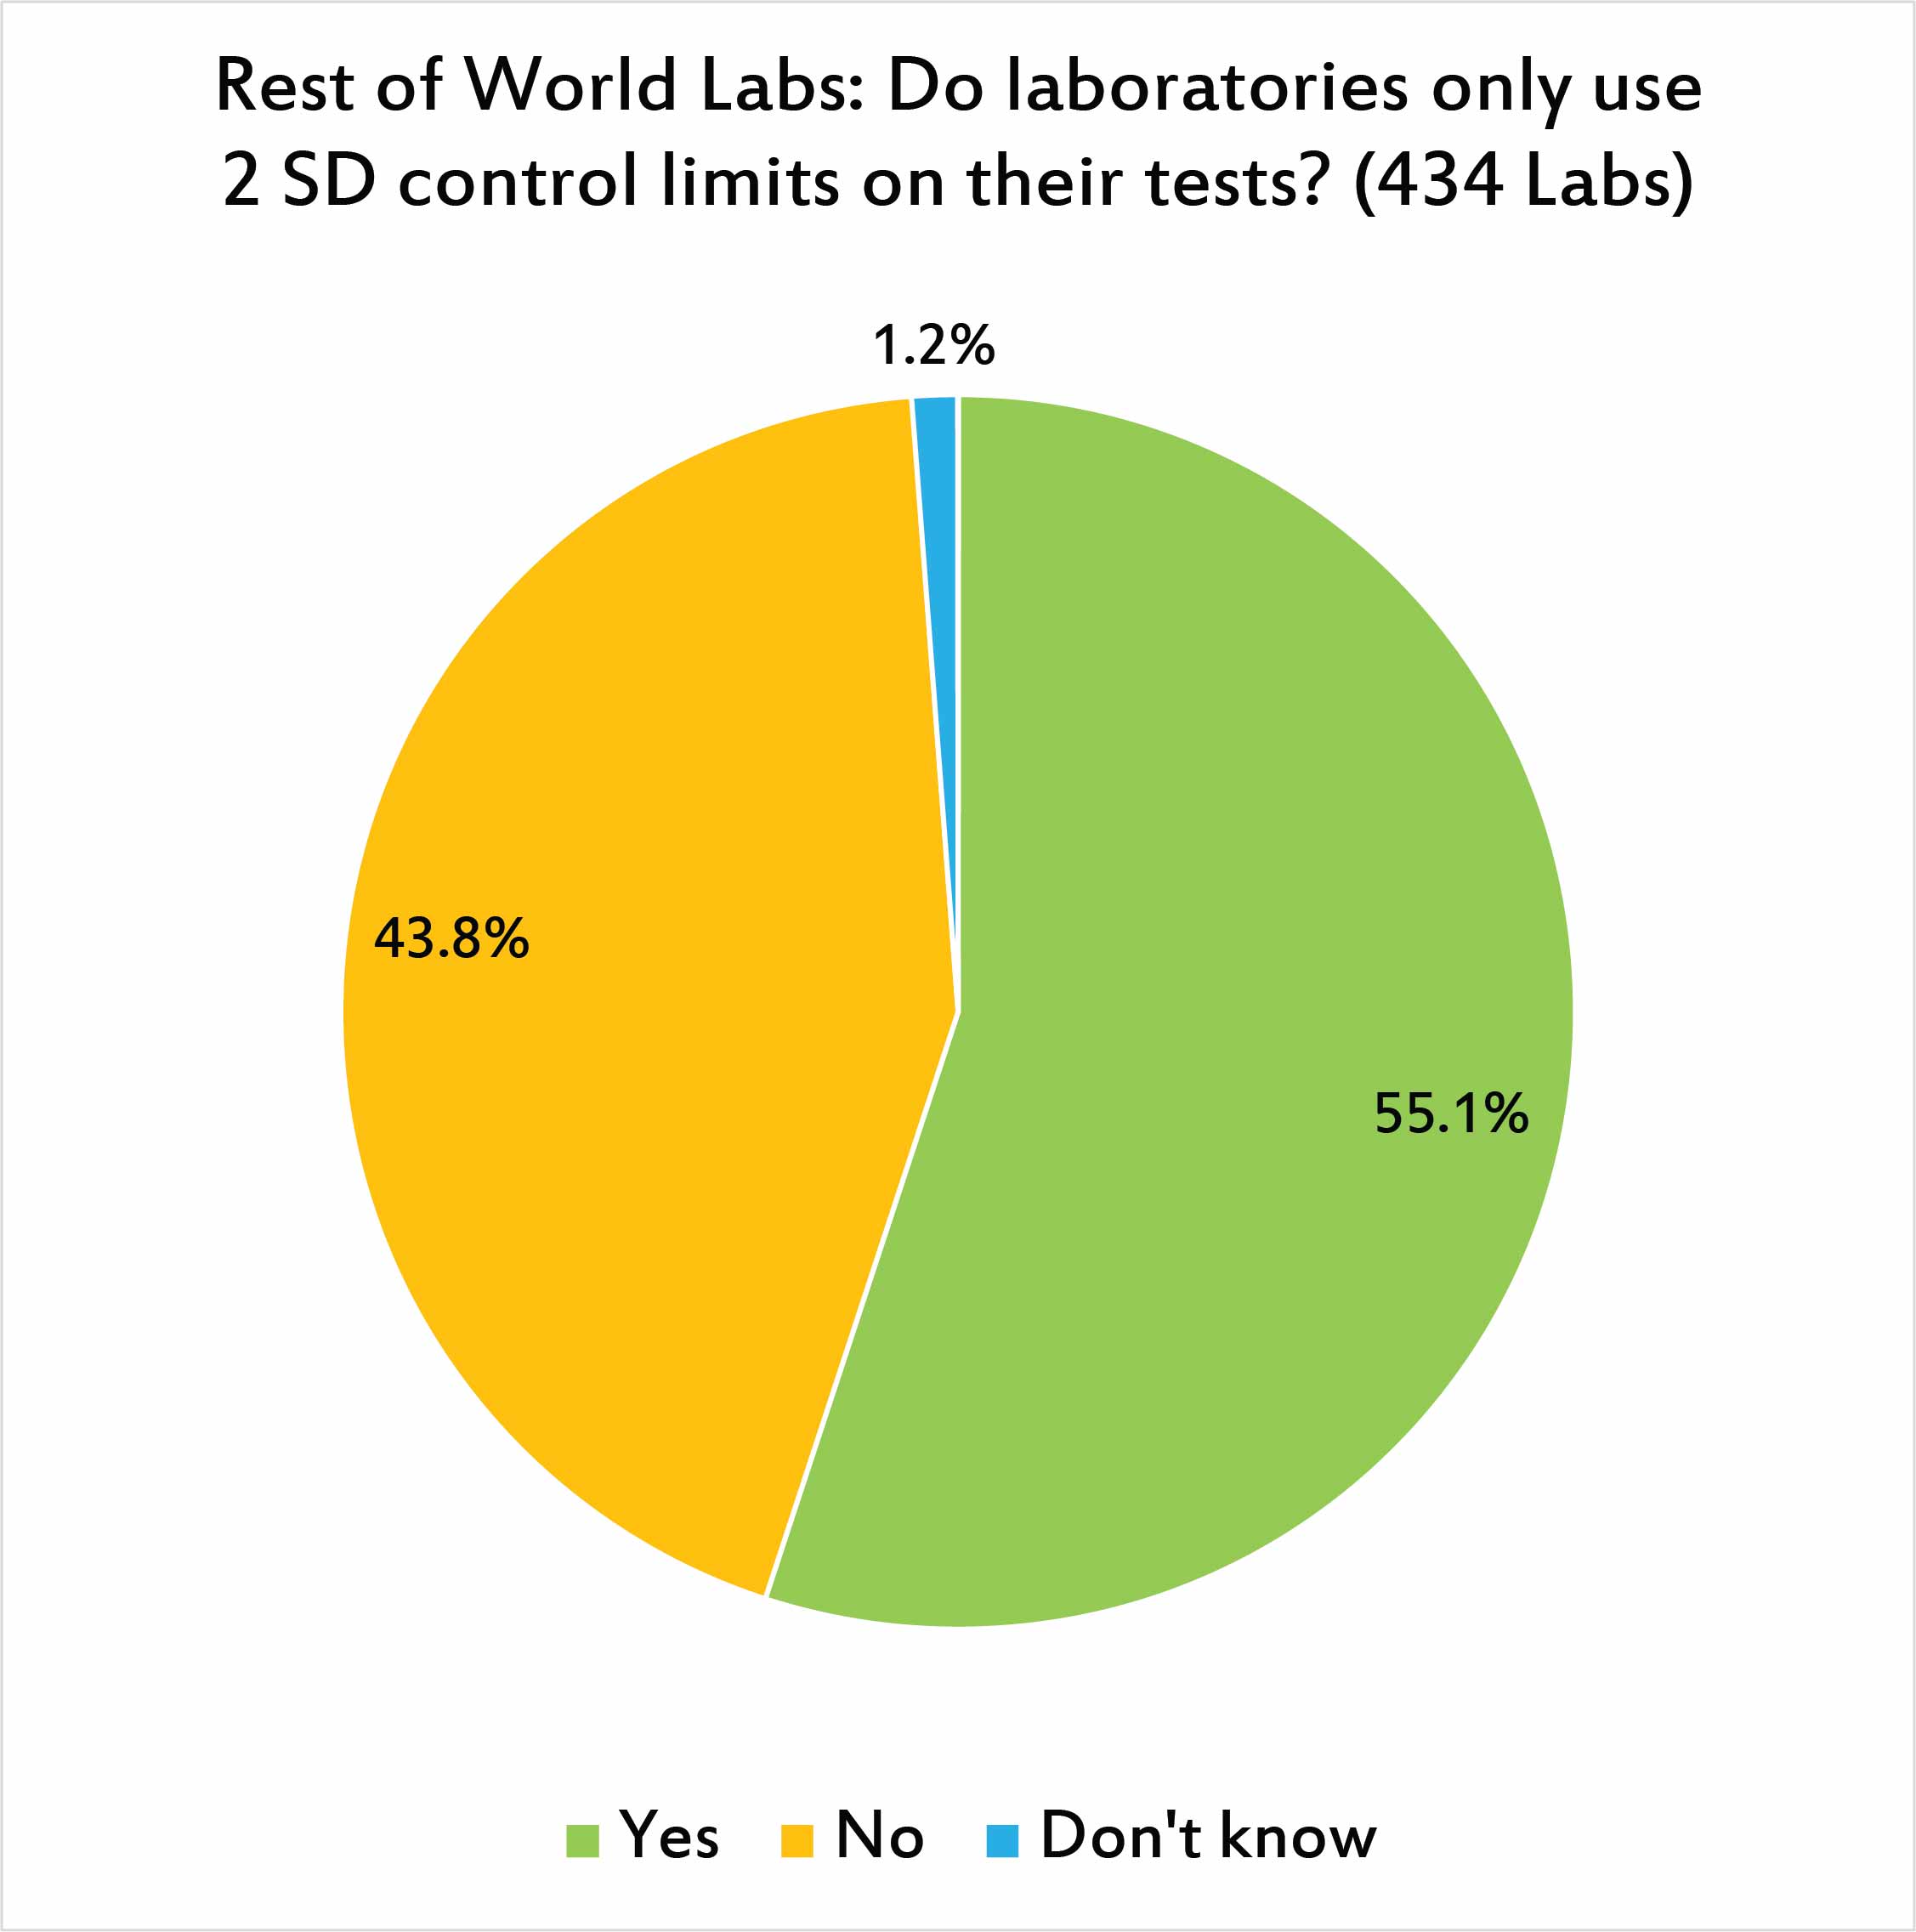
Just as the US labs answered, a majority of laboratories around the world are using the antiquated practice of setting control limits at 2 SD. This results in a lot of false rejections that may consume the laboratory's time and attention.
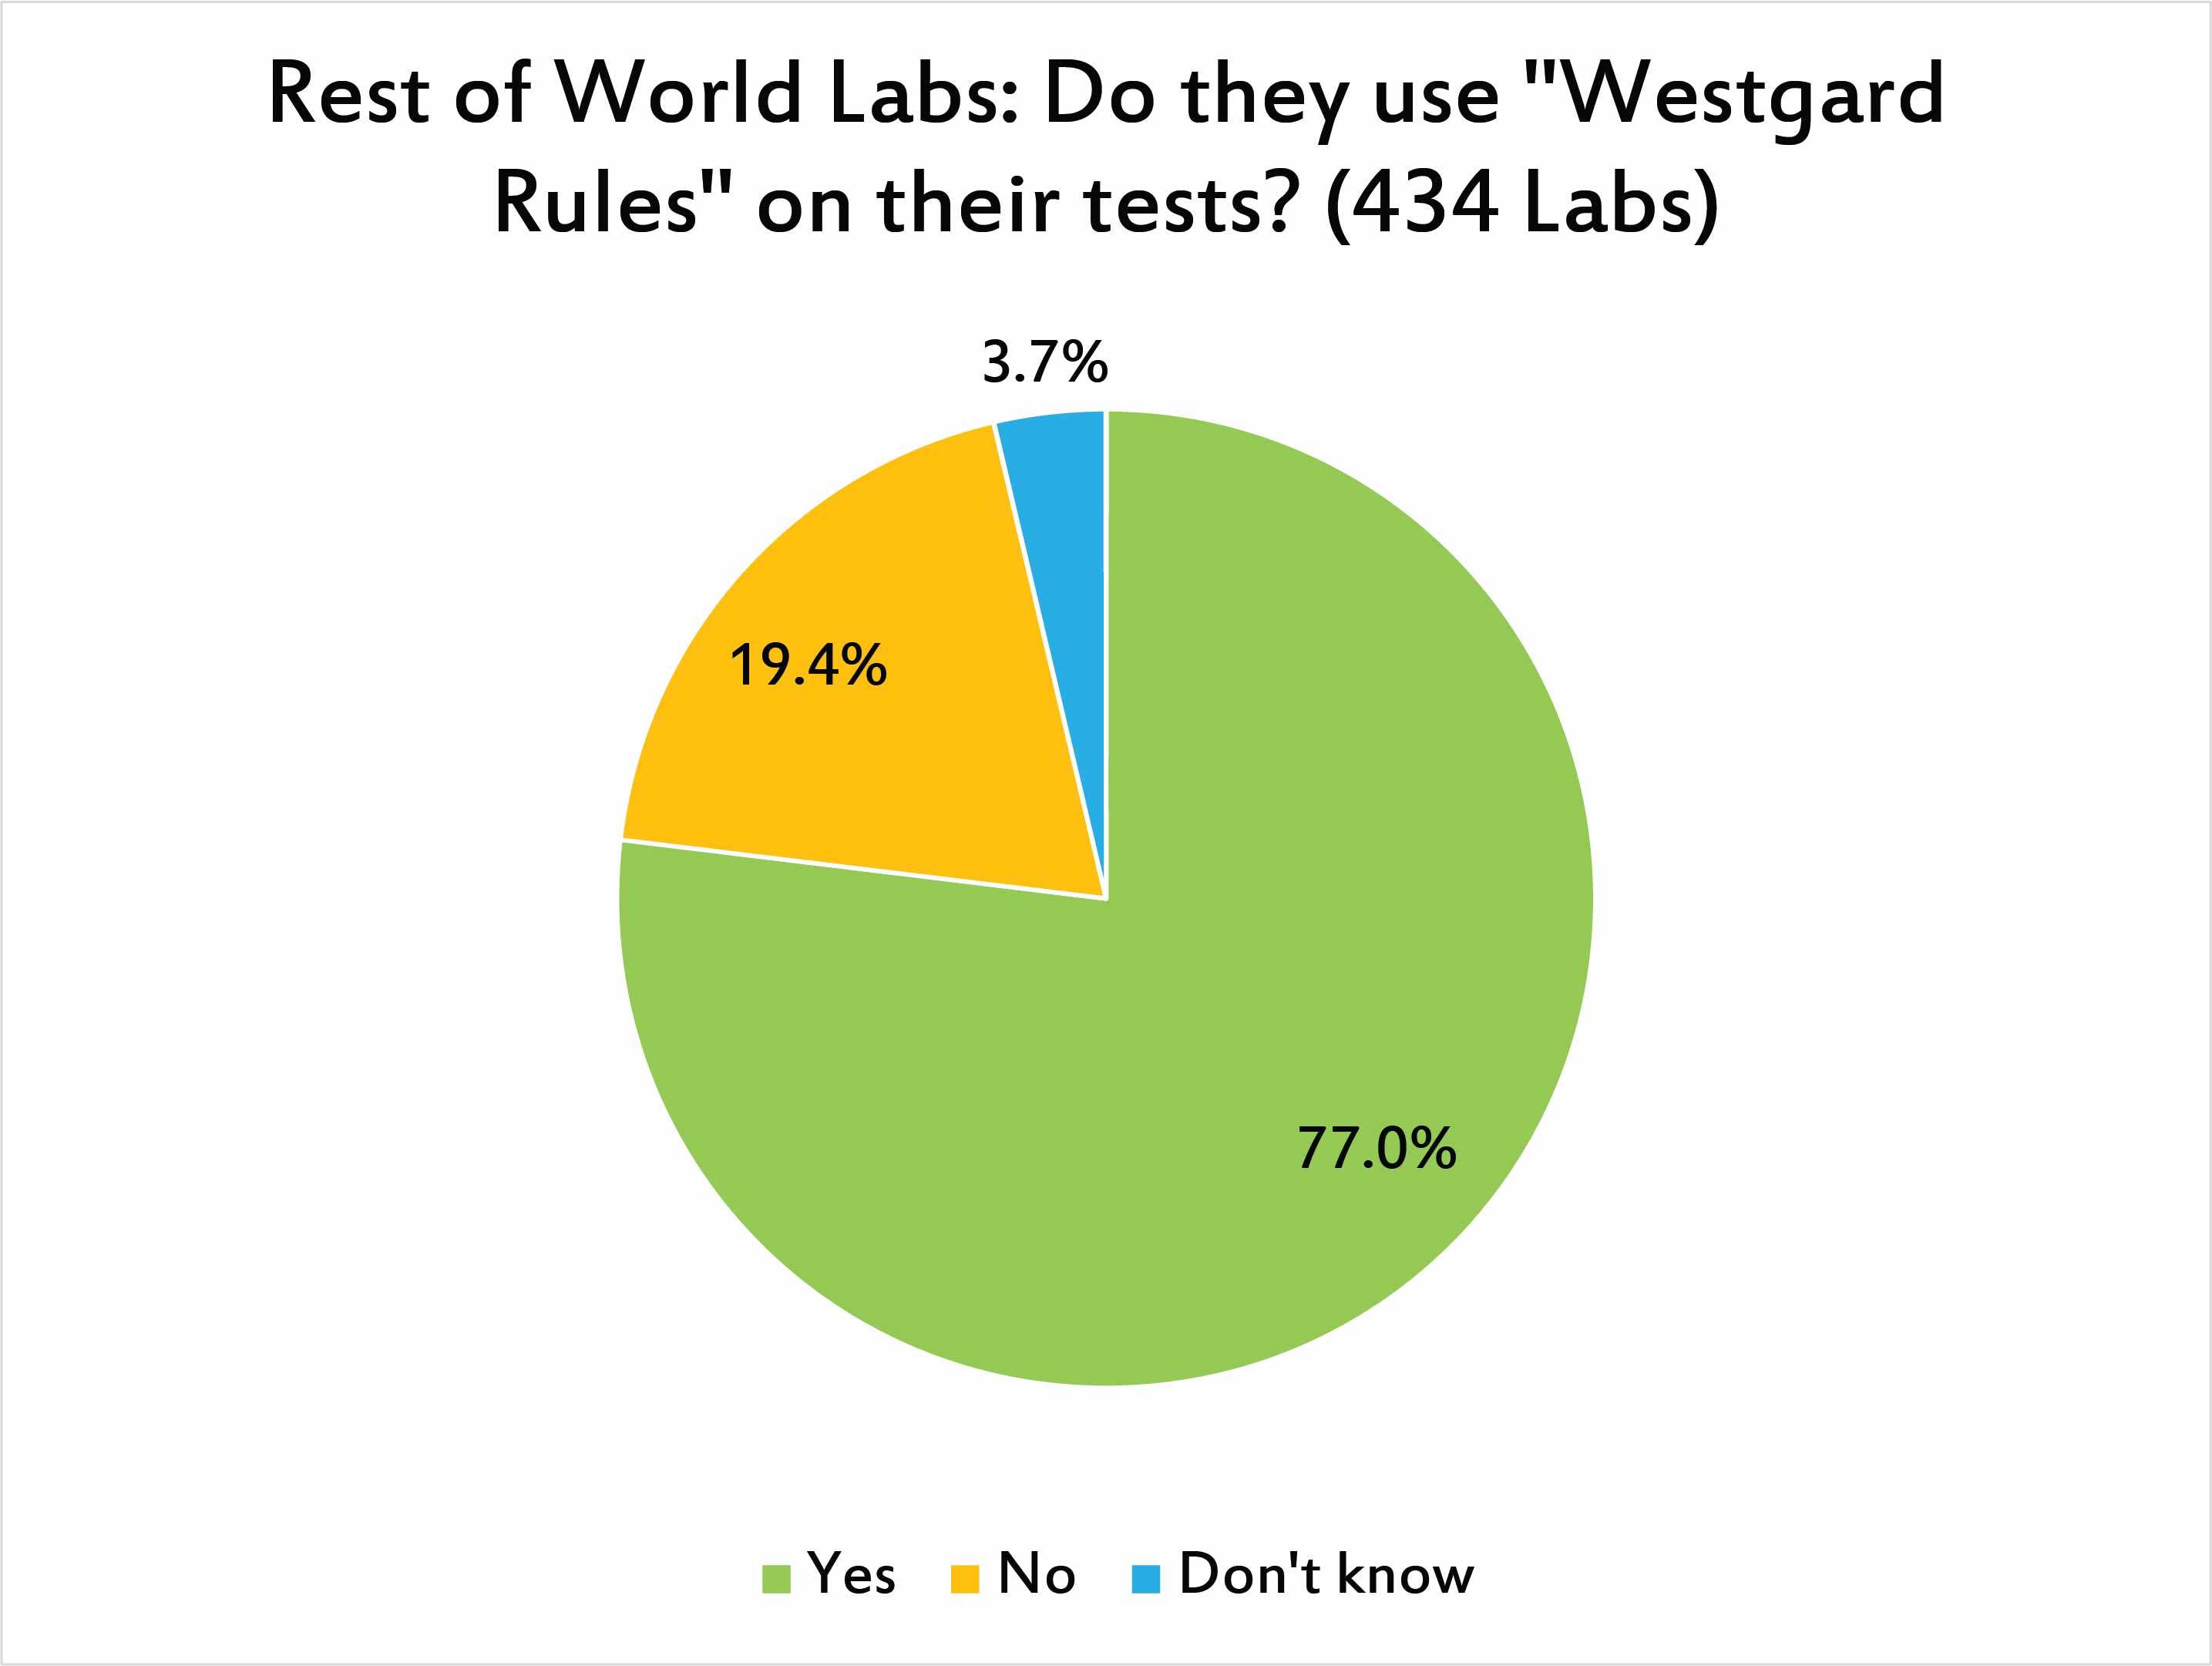
Just a slightly higher percentage of laboratories outside the US use "Westgard Rules" than inside the US. We suspect that the bare bones compliance mentality of the US depresses the use of "Westgard Rules", and at the same time, the stronger professionalism of laboratorians in the rest of the world means that they are willing to embrace more sophisticated approaches to quality control.
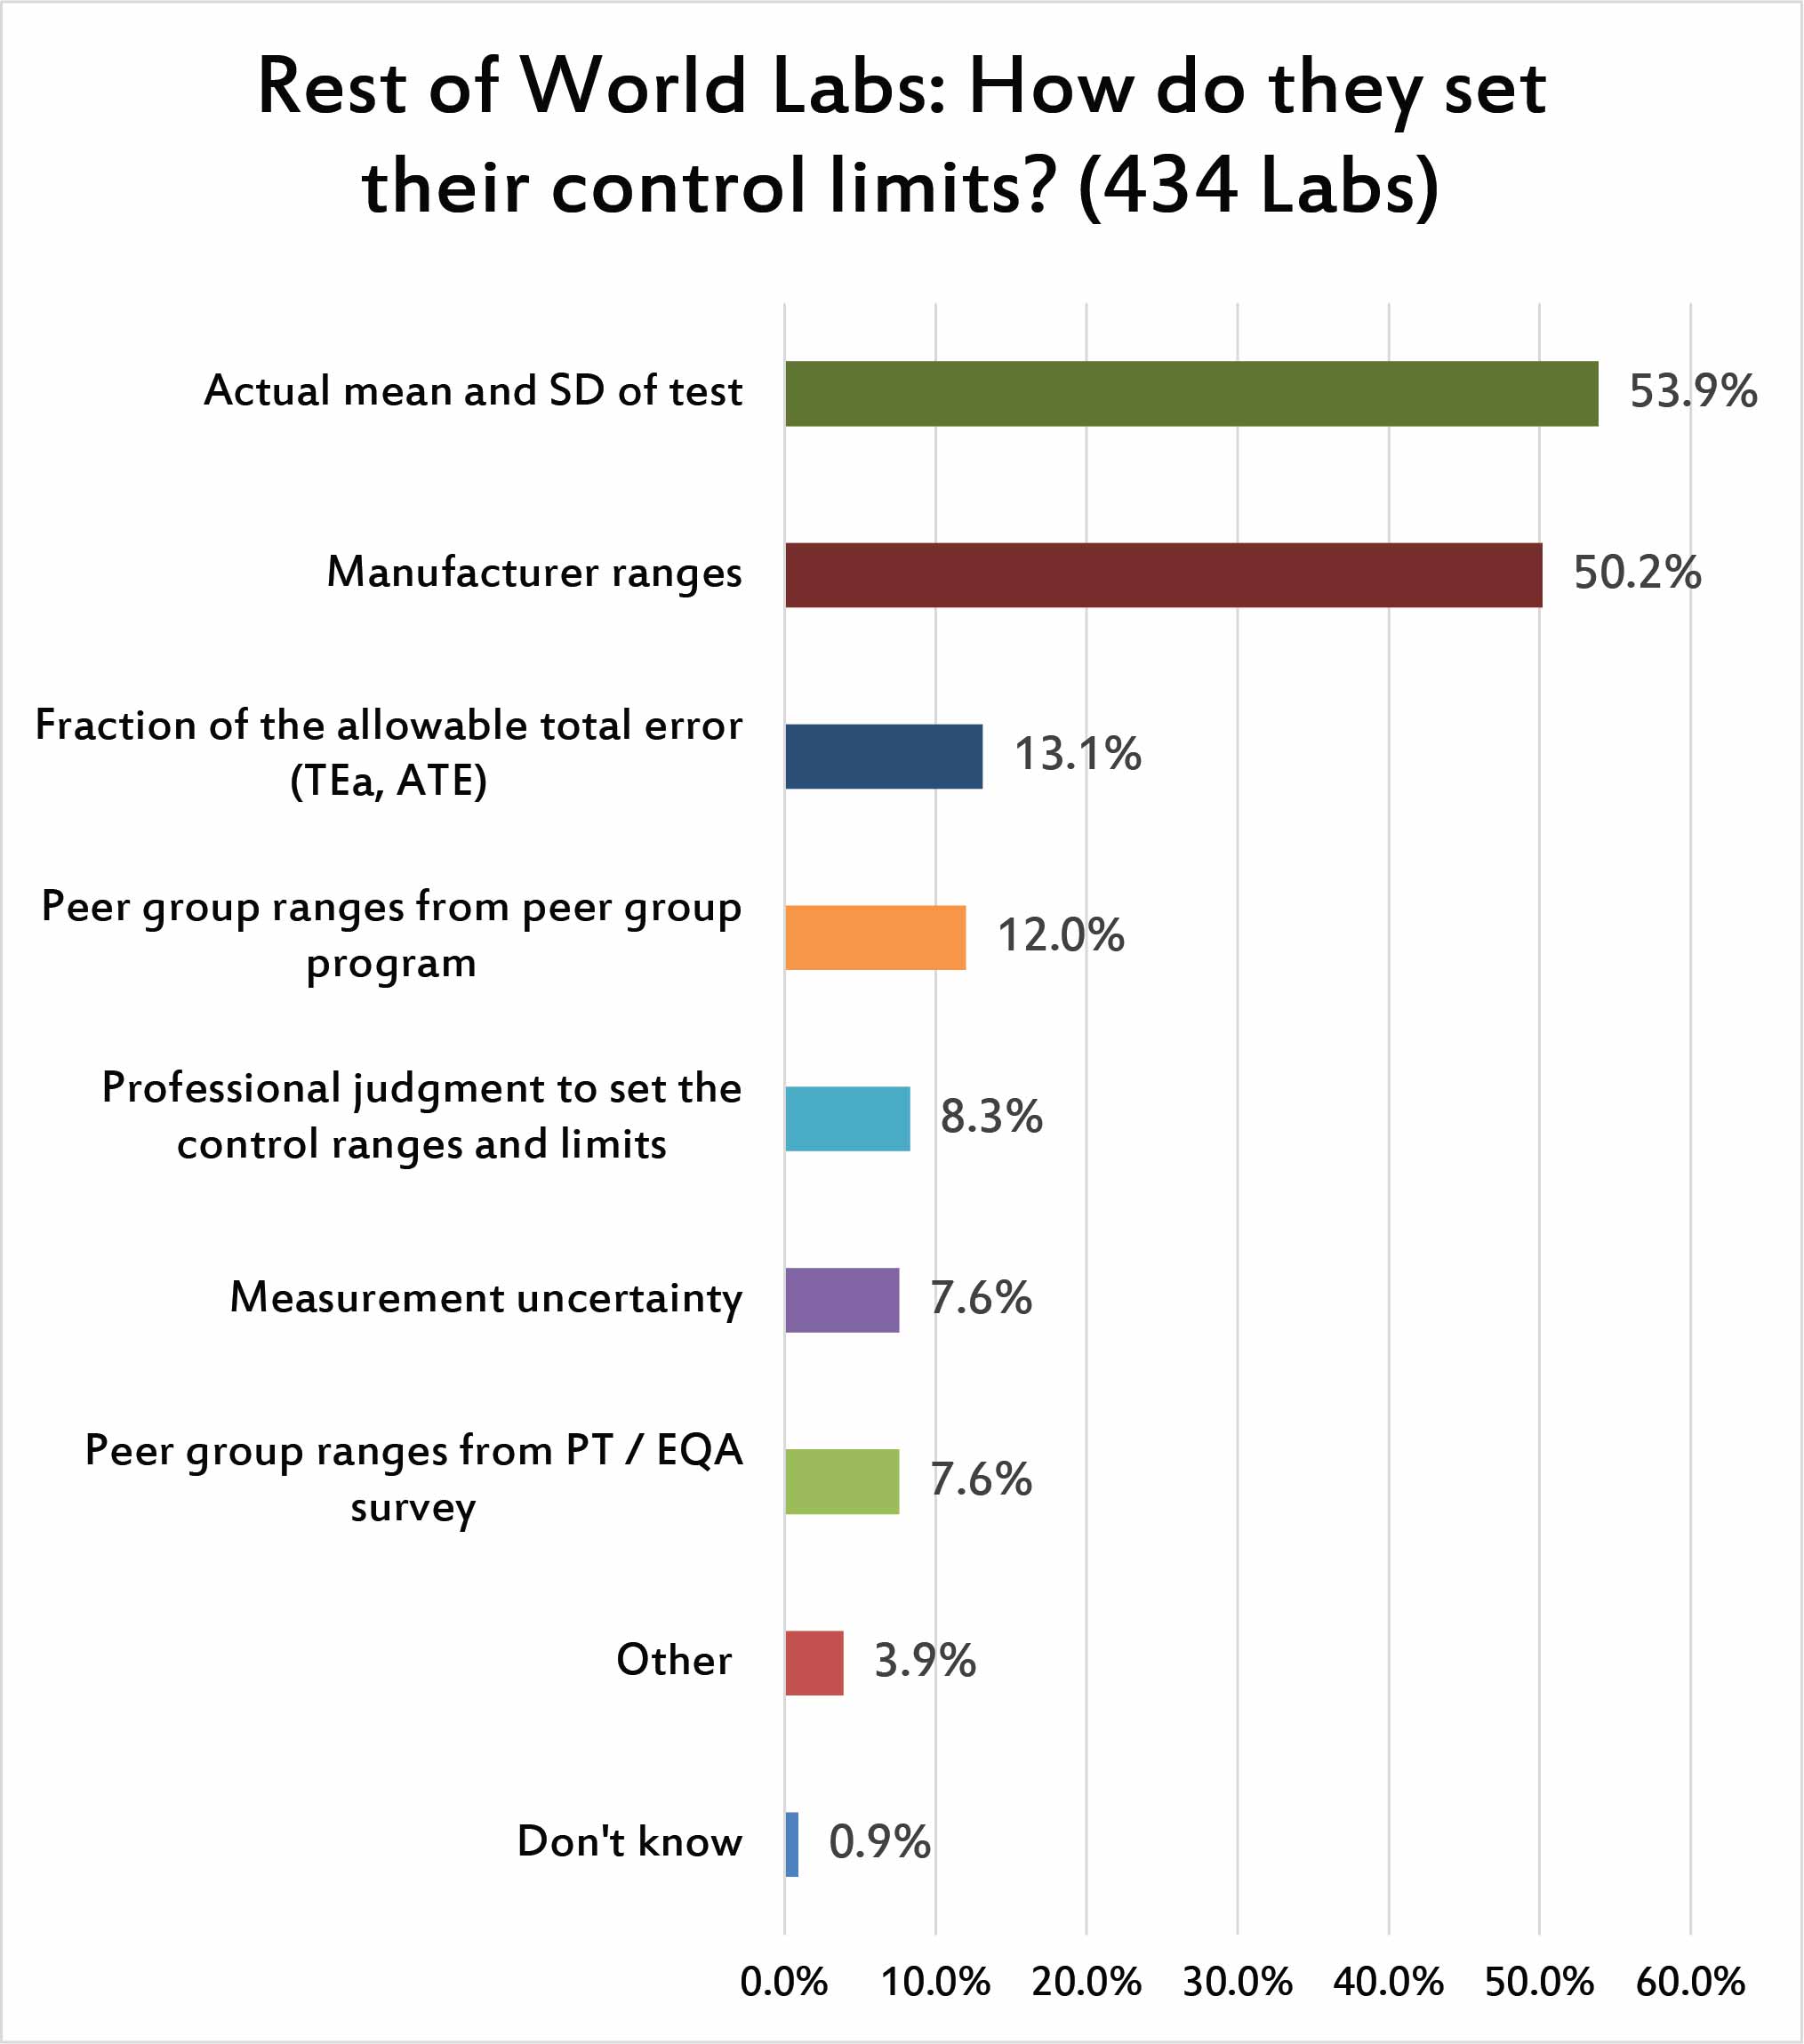
A smaller percentage of laboratories are using their own mean and standard deviation when setting up their control limits, ranges, and charts. However it's still a majority of laboratories are implementing this best practice. It's distressing that a majority of laboratories are still using manufacturer ranges on some of their testing. Those manufacturer ranges are typically too wide, sometimes more than twice as wide as the should be if they reflected the real SD of the laboratory.
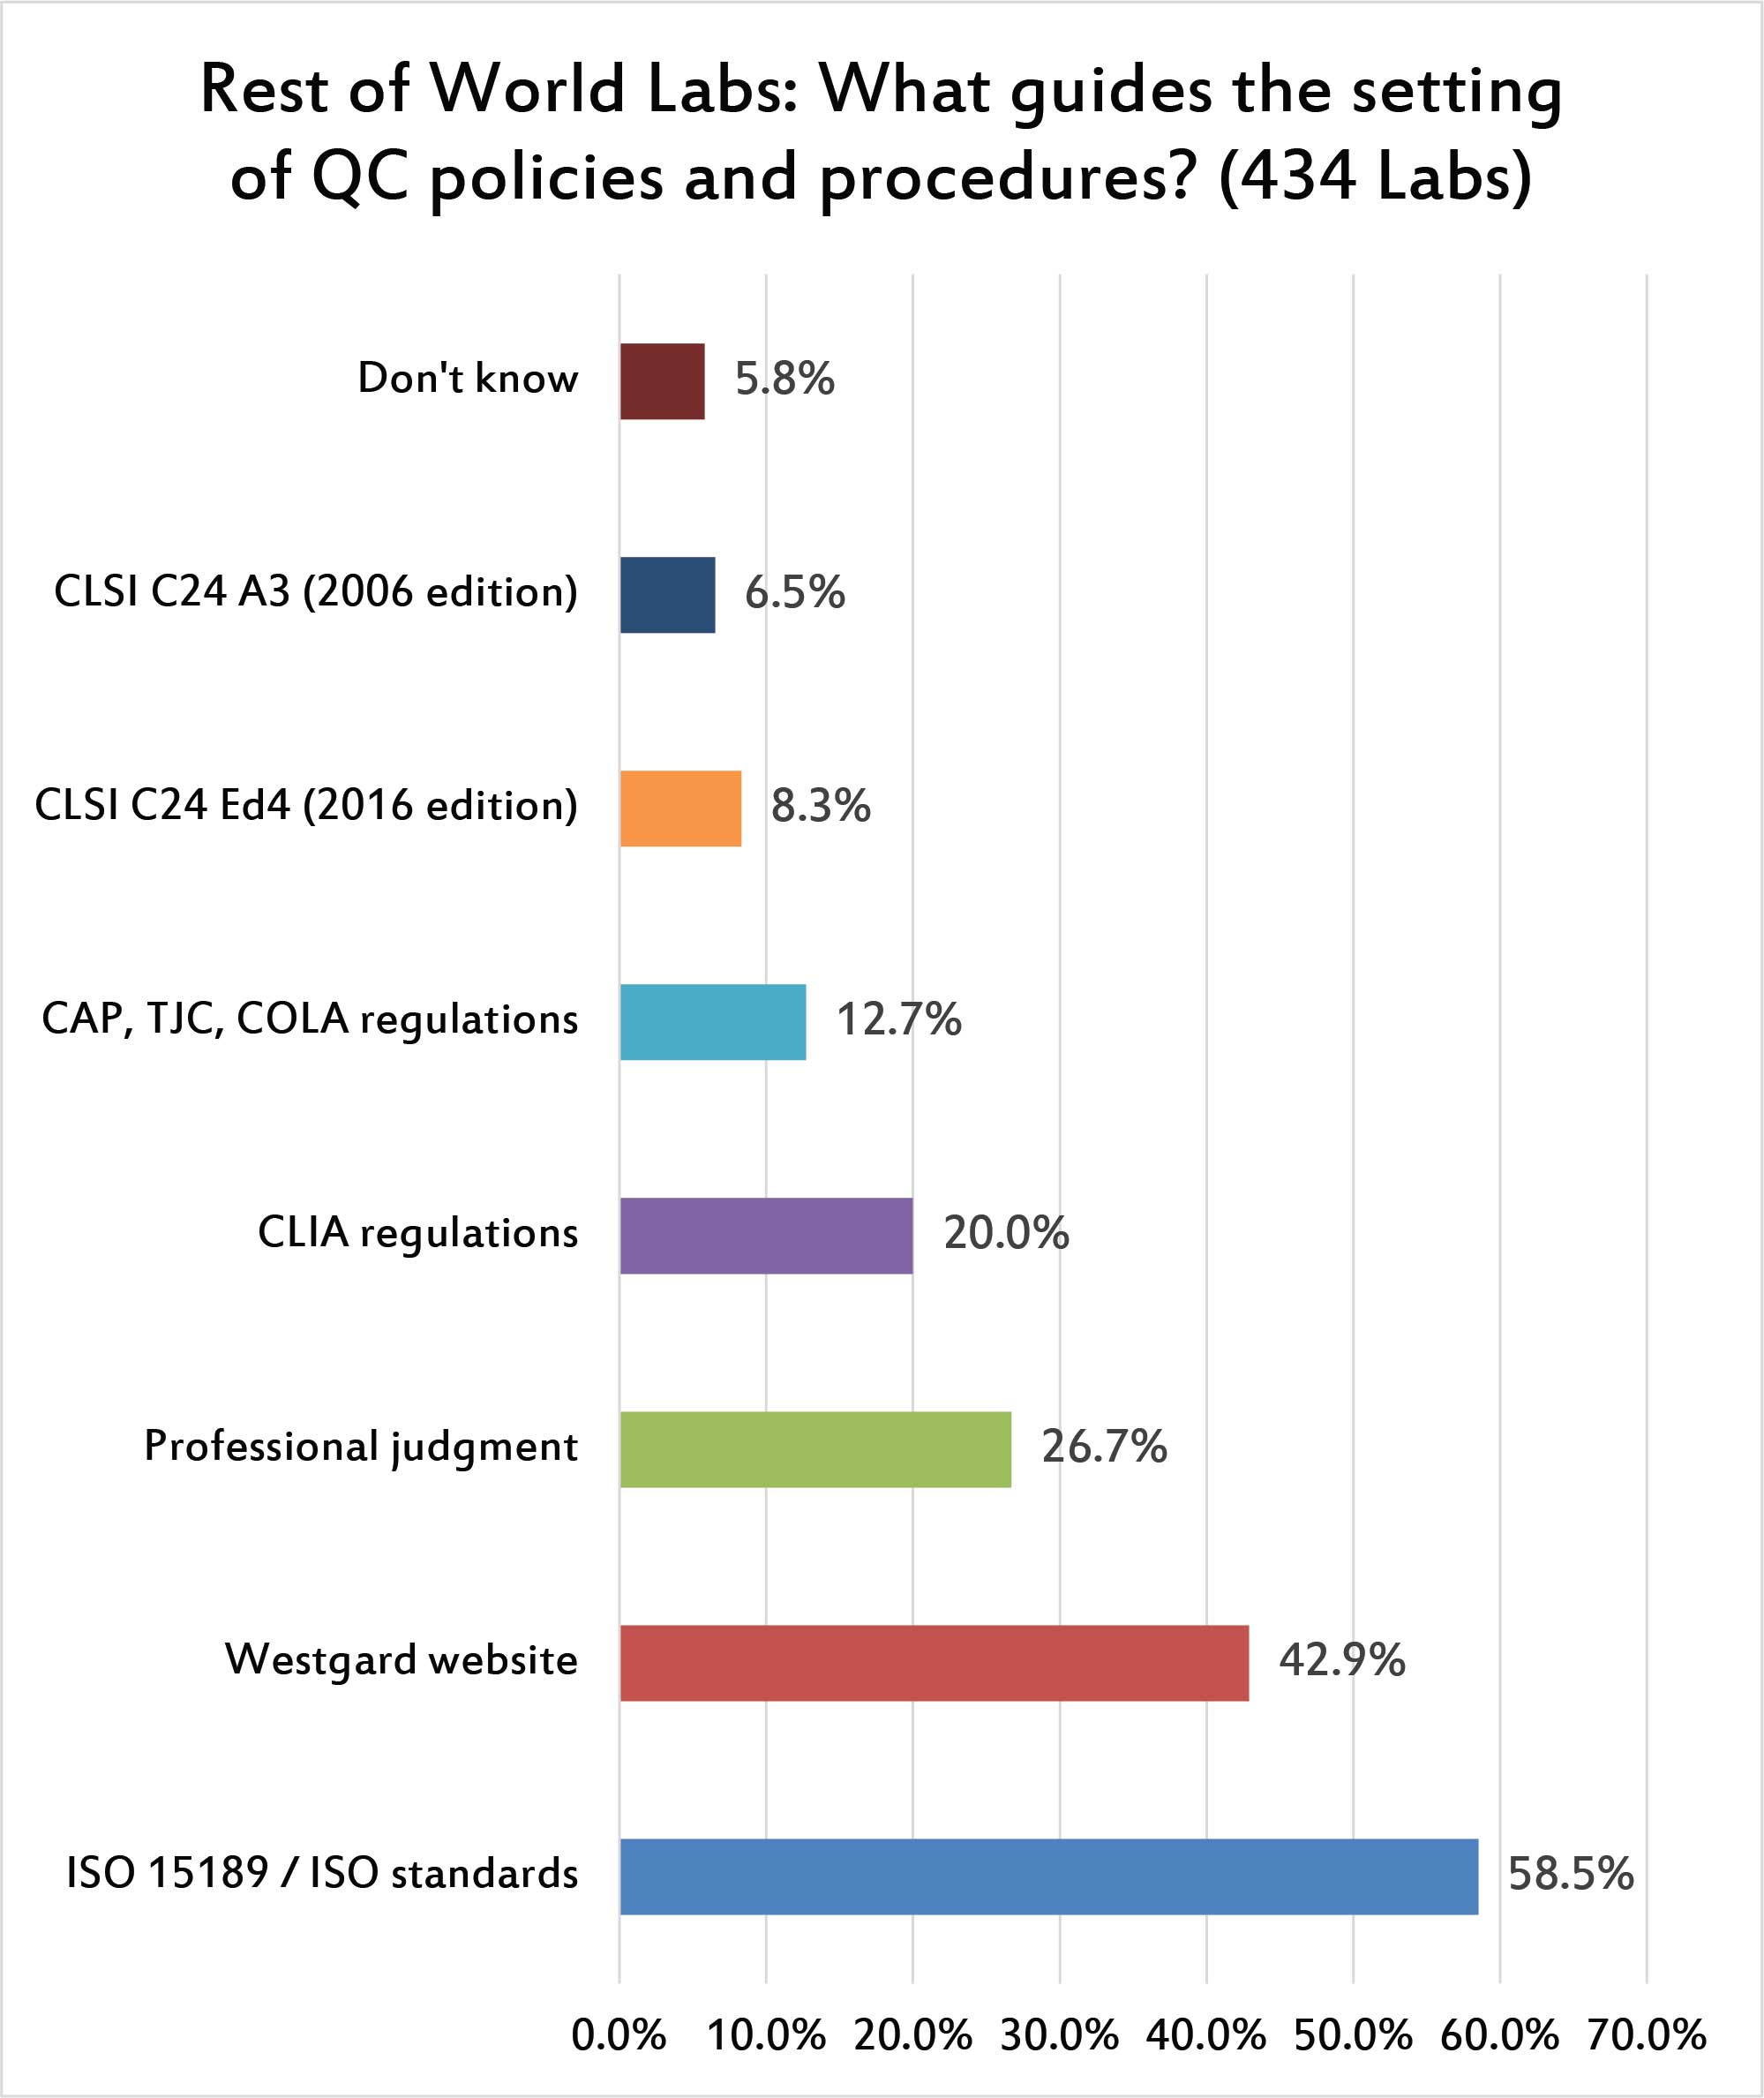
When specific regulations are considered, ISO 15189 is the dominant standard that is referenced for setting control limits in laboratories. Of course, that standard only gives general advice - not specifics about what SD and mean to use. Curiously, the Westgard website has a stronger influence on global laboratories than even the guidelines from CLSI. More than a quarter of laboratories rely just on their professional judgment to set ranges. CLIA regulations, while they have minimal influence on the overall laboratory environment, appear to have a stronger impact on the setting of control ranges.
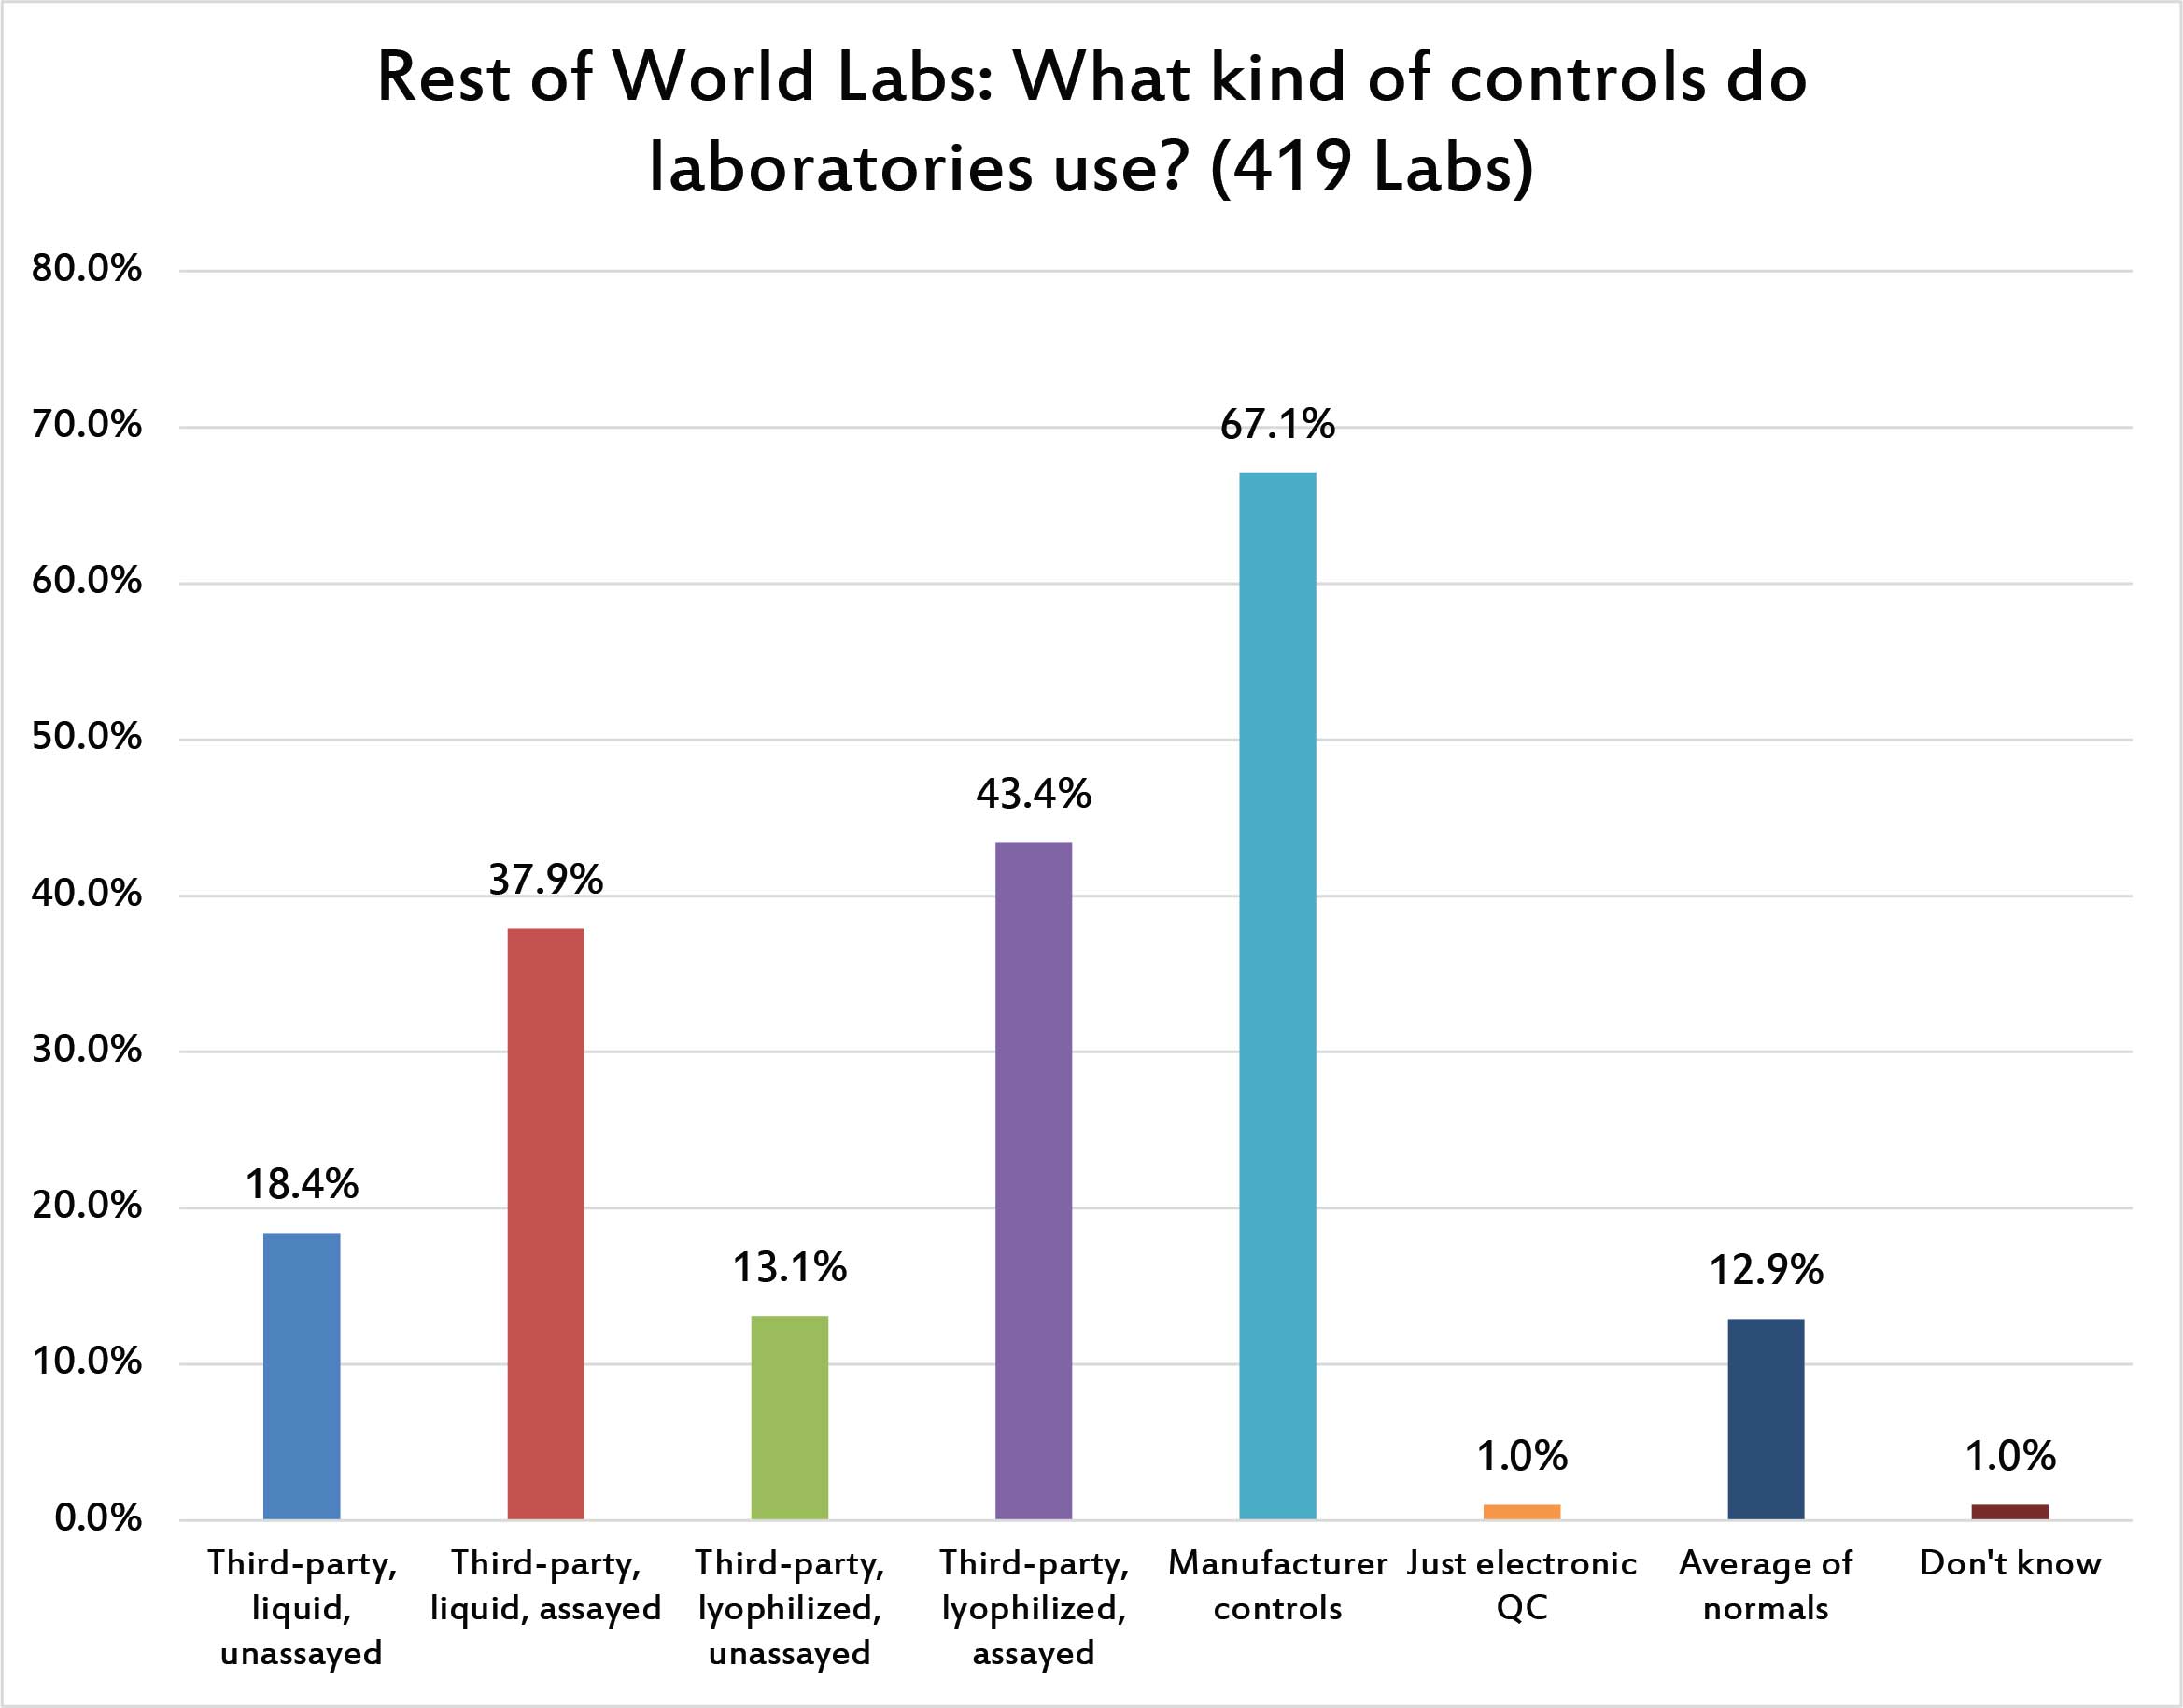
Over two thirds of laboratories are using manufacturer controls, despite the strong recommendation from ISO 15189 and other guidelines to use independent, third-party controls. The second-most popular type of control in use around the world is the lyophilized, assayed control. In the US, liquid controls are more popular the lypophilized, but outside the US the opposite is true. For many labs that have challenging logistical chains, a lyophilized control is actually more reliable than a liquid control. Other significant findings here include (1) only a small number of labs are implementing average of normals procedures, despite all the talk and discussion about them over the past several years; and (2) a very tiny percentage of laboratories are using just electronic QC. In the US, where POC devices are proliferating, the electronic QC is often the only practical method of controlling quality. Outside the US, POC usage is not as high, and so fewer labs use electronic QC.
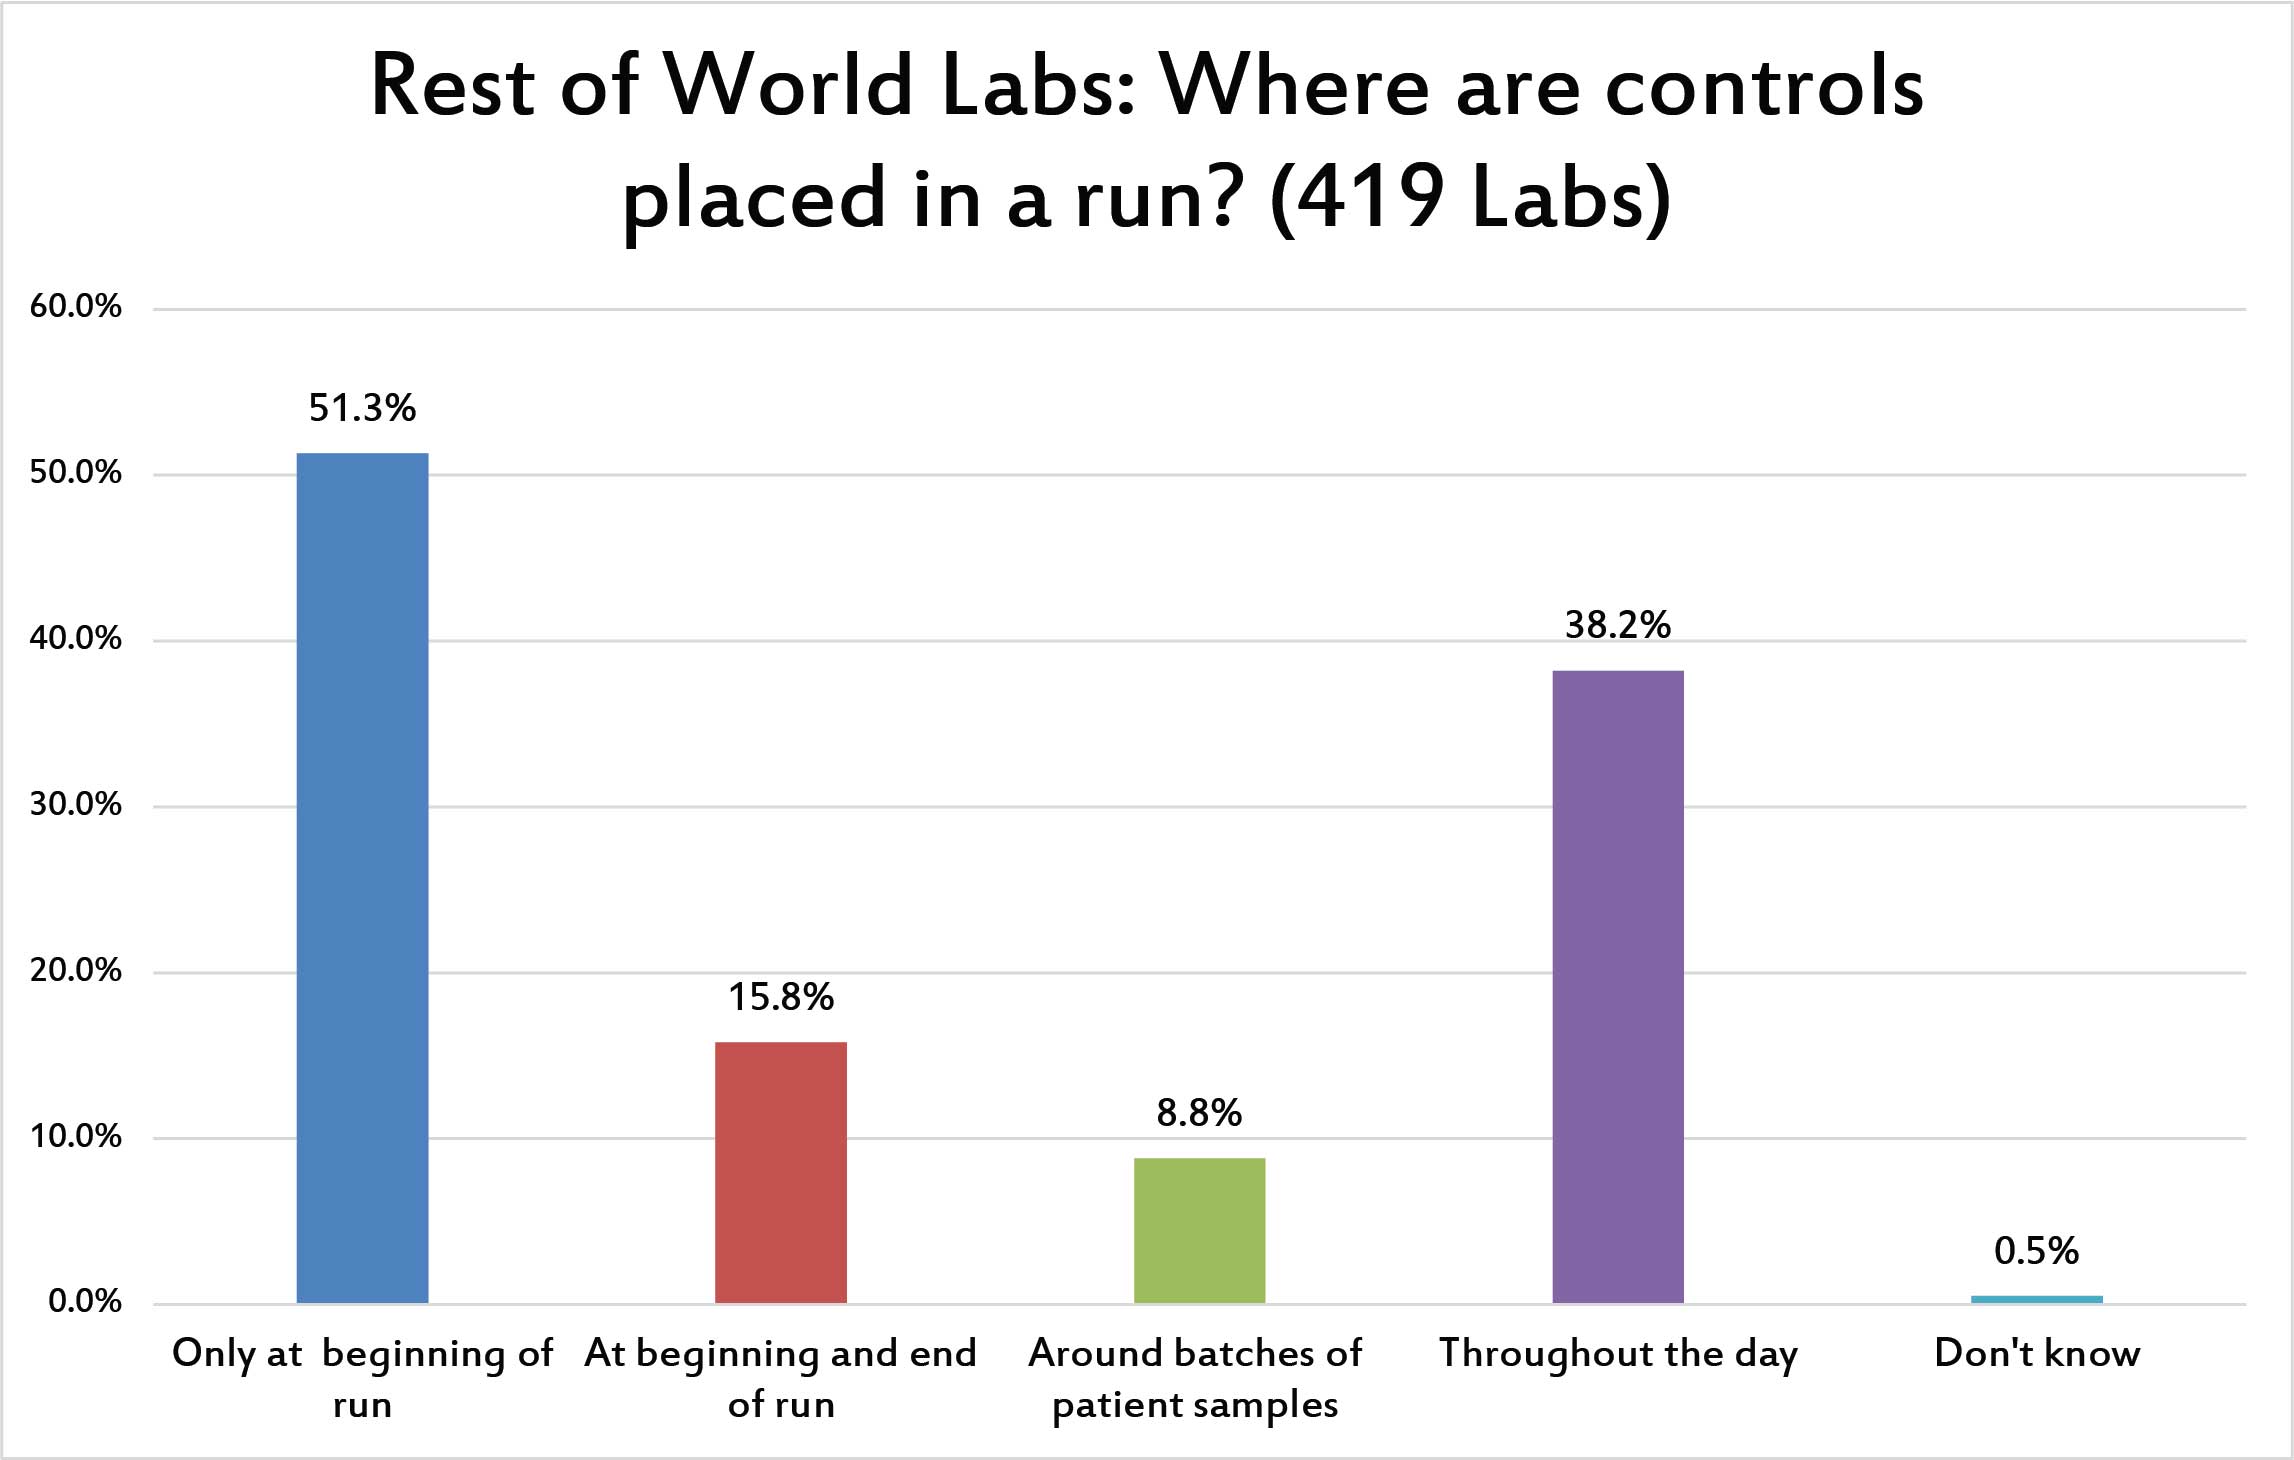
A majority of laboratories place controls only at beginning of the run. But more than a third do so throughout the day, suggesting multiple runs per day have been defined. Smaller percentages of labs bracket their QC or base their control usage on the volume of patient specimens they are testing.
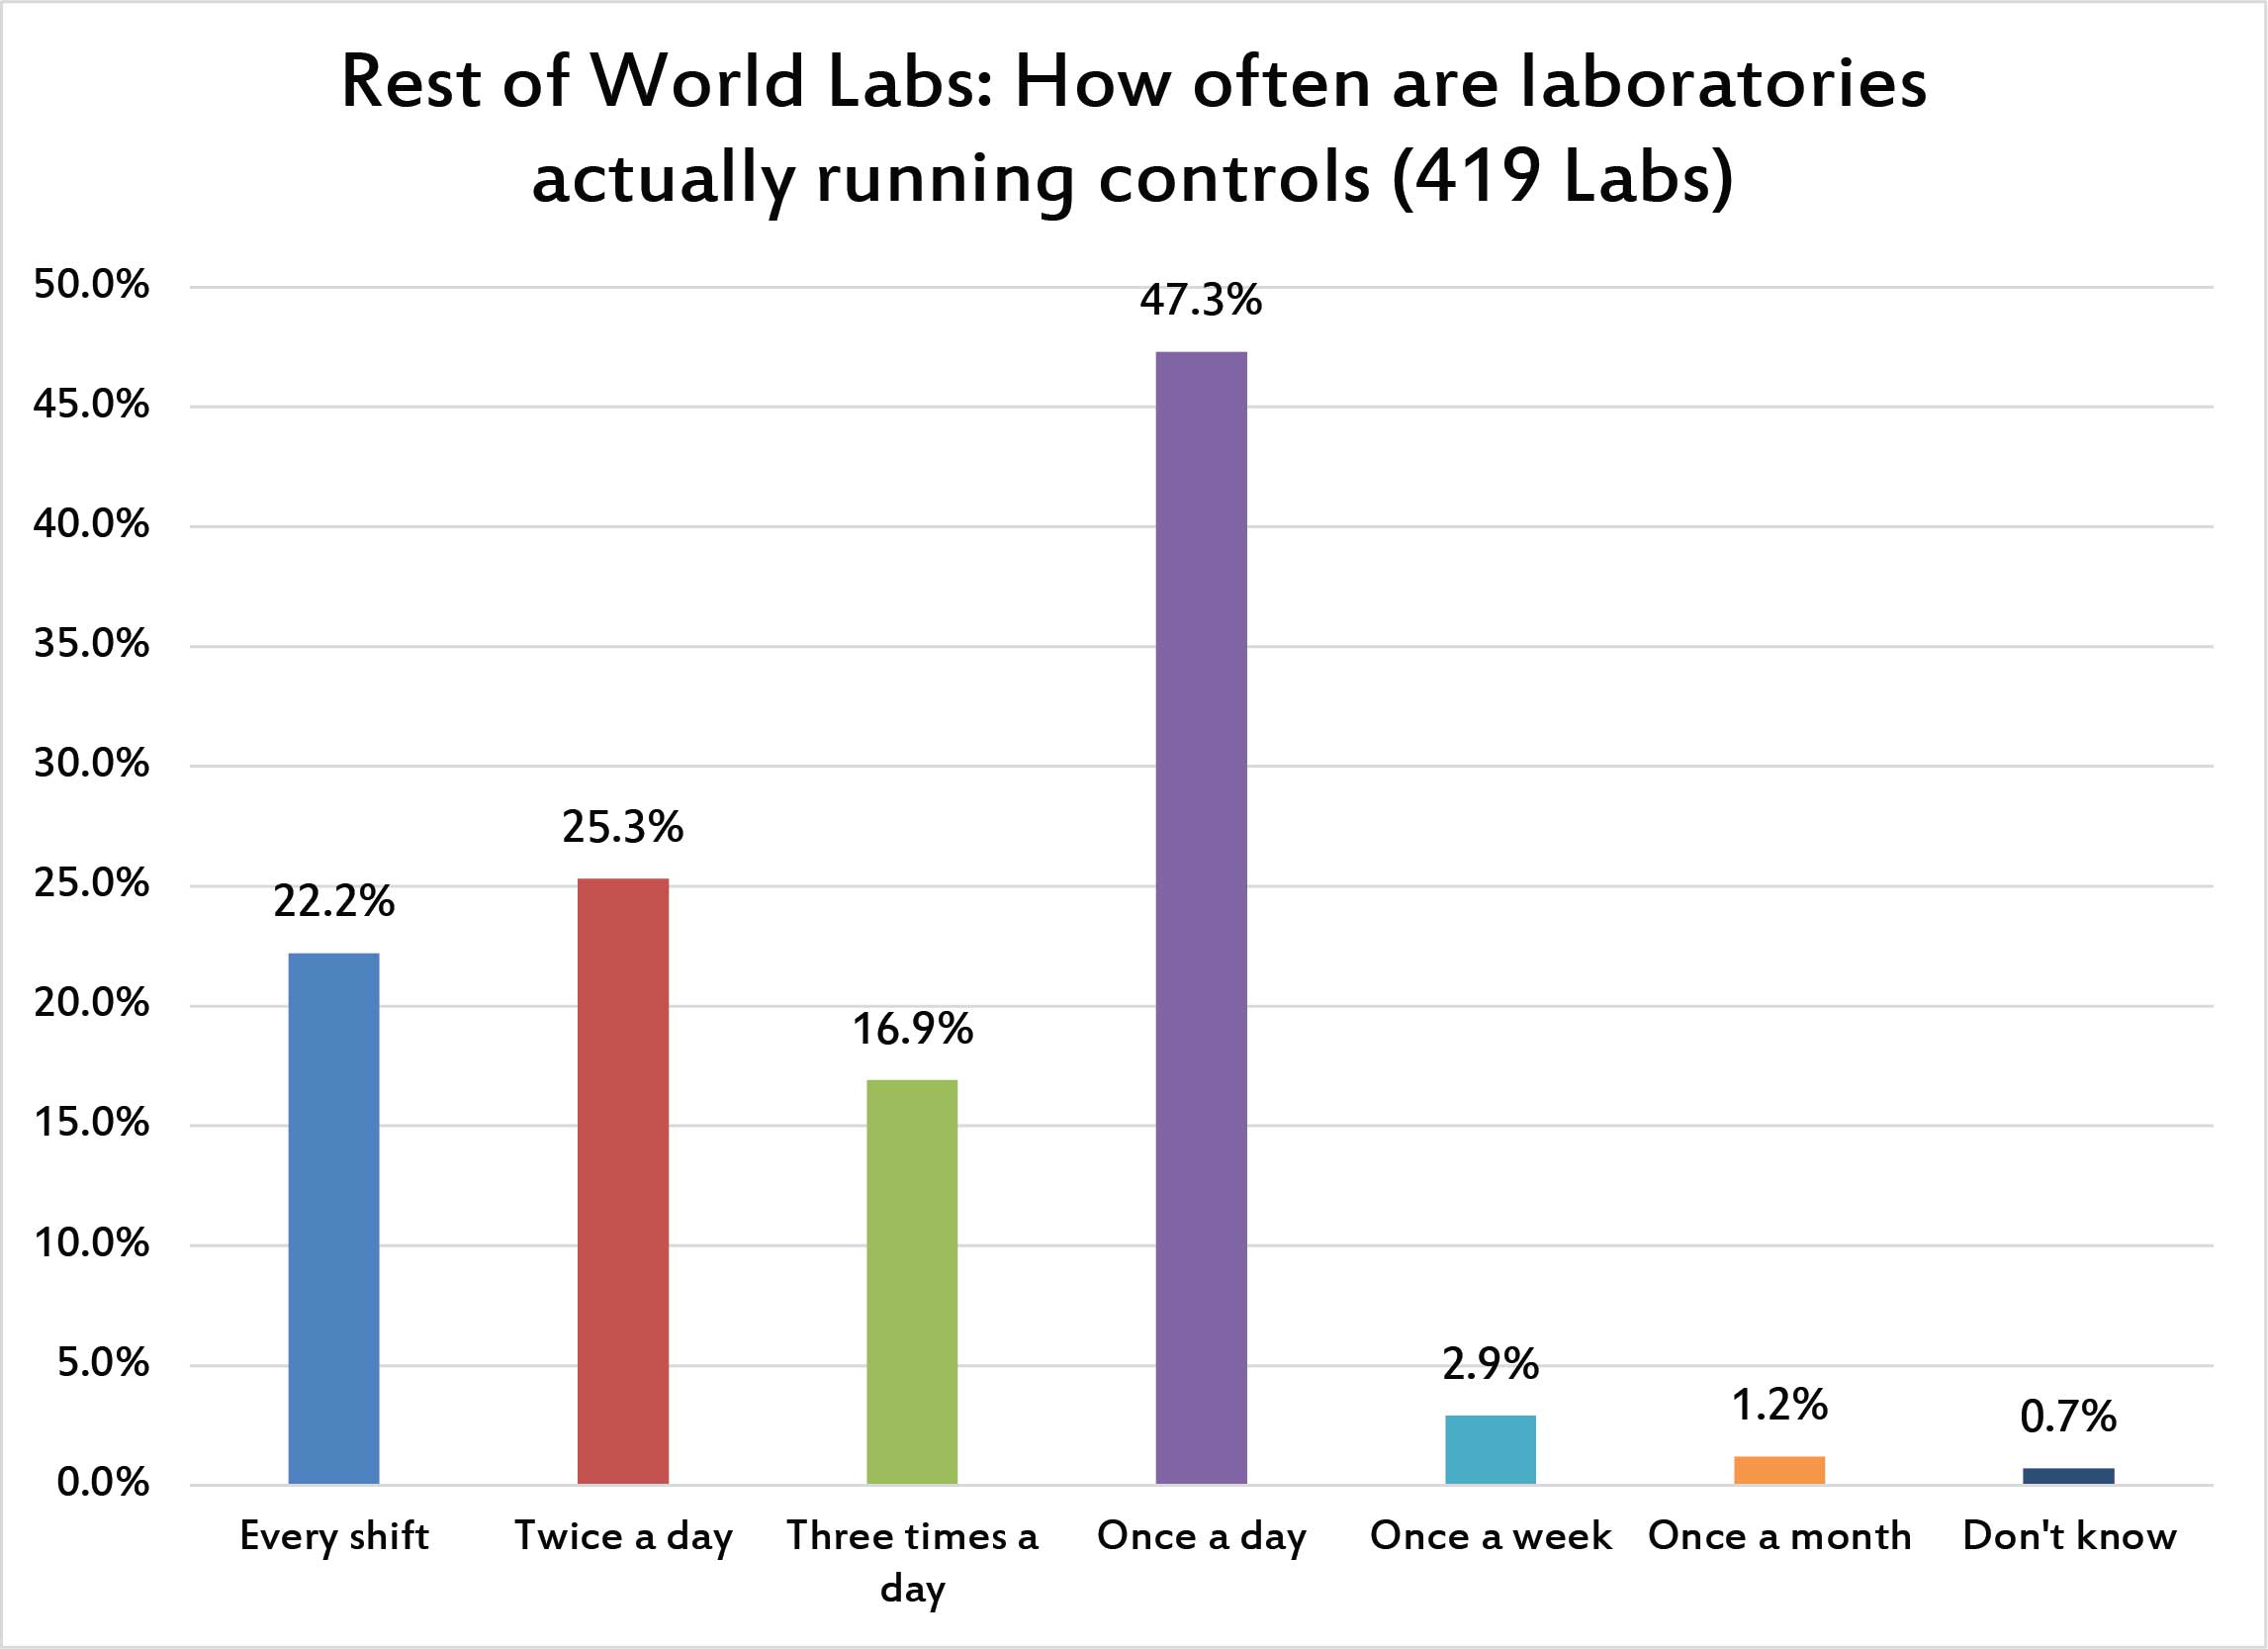
Beyond the placement of controls, what is the actual frequency of controls per day? Like the US, the most common answer is "once a day". But where 58% of US labs run once a day, only 47% of labs in the rest of the world do. So there is a significant practice difference - more labs outside the US are running controls more frequently. In fact, while less than 9% of US labs report runing controls twice a day, more than a quarter of labs in the rest of the world are running twice per day. That's a big difference, proof that the CLIA "minimum" standards became compliance maximum practices. CLIA helped labs in some ways, but in quality control practices it really lowered the bar. The rest of the world is running their controls more often.
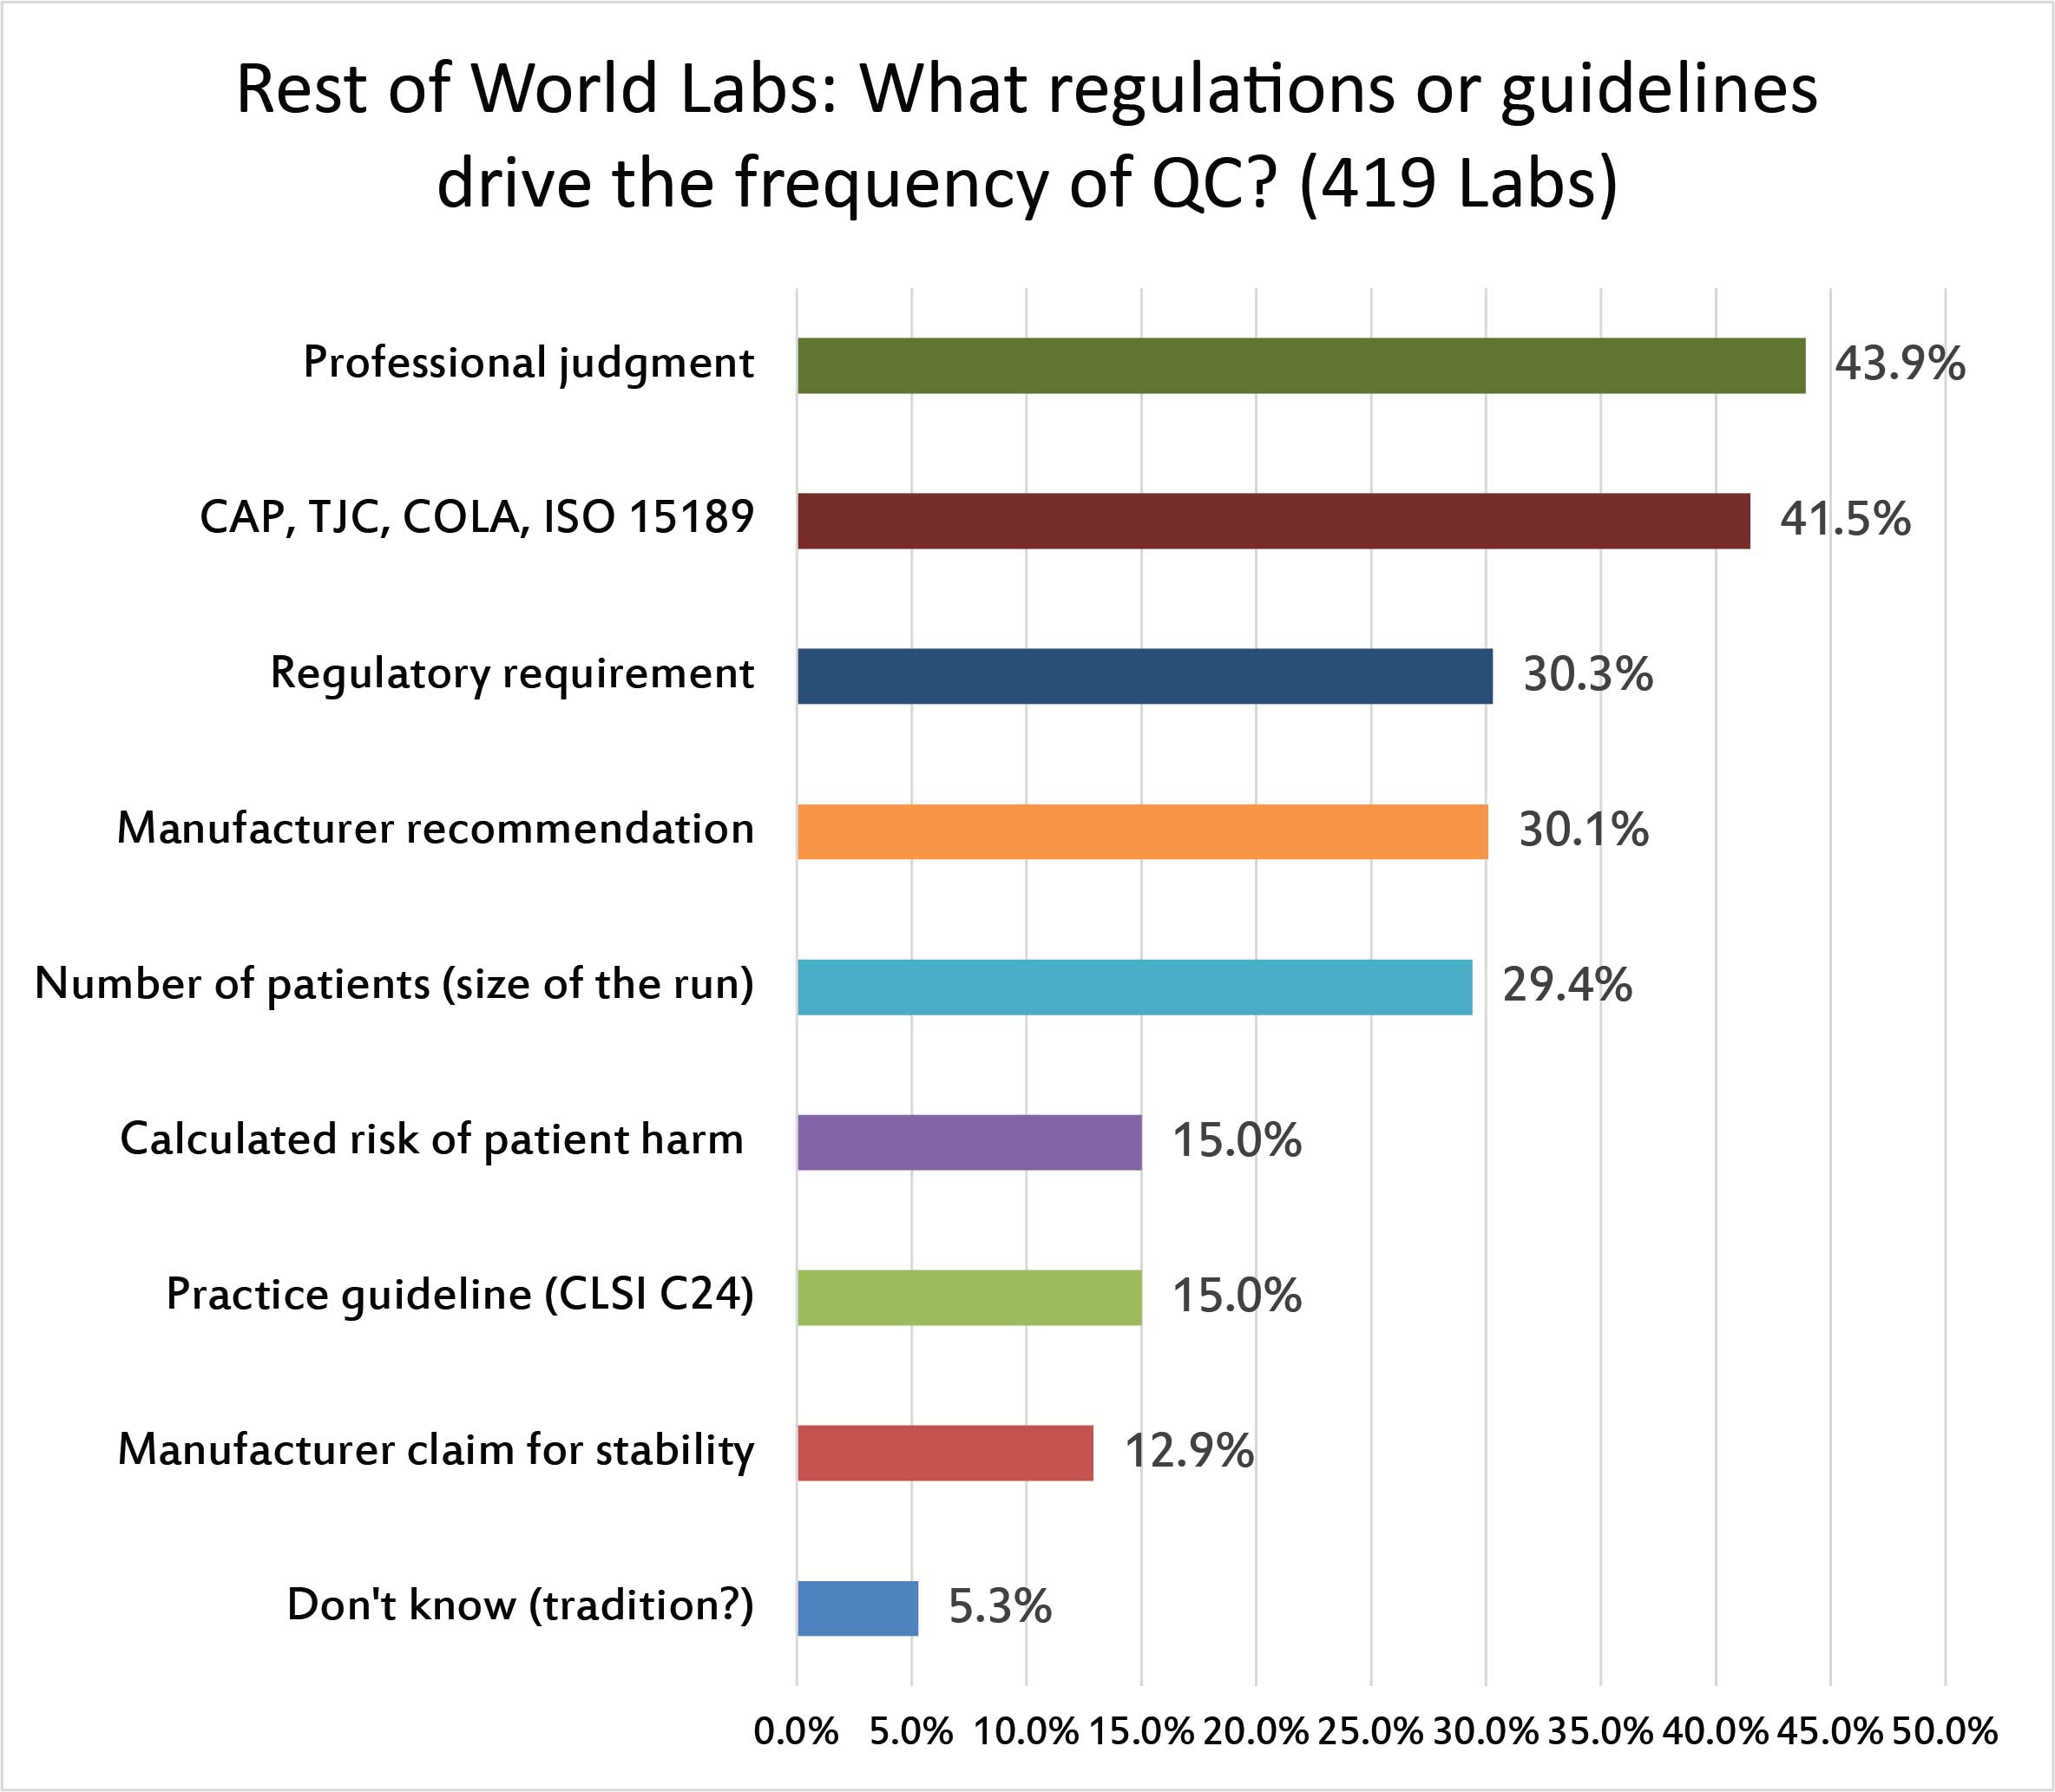
For the majority of laboratoires around the rest of the world, professional judgment is the biggest element that shapes the QC frequency policy, followed by the accreditation guideslines of CAP, JCI, and ISO 15189. The manufacturer's QC recommendations, the local regulations, and the volume of patients being run have about equal an influence on the frequency of QC.Few labs are using CLSI C24, or calculating their QC frequency based on Risk Assessments.
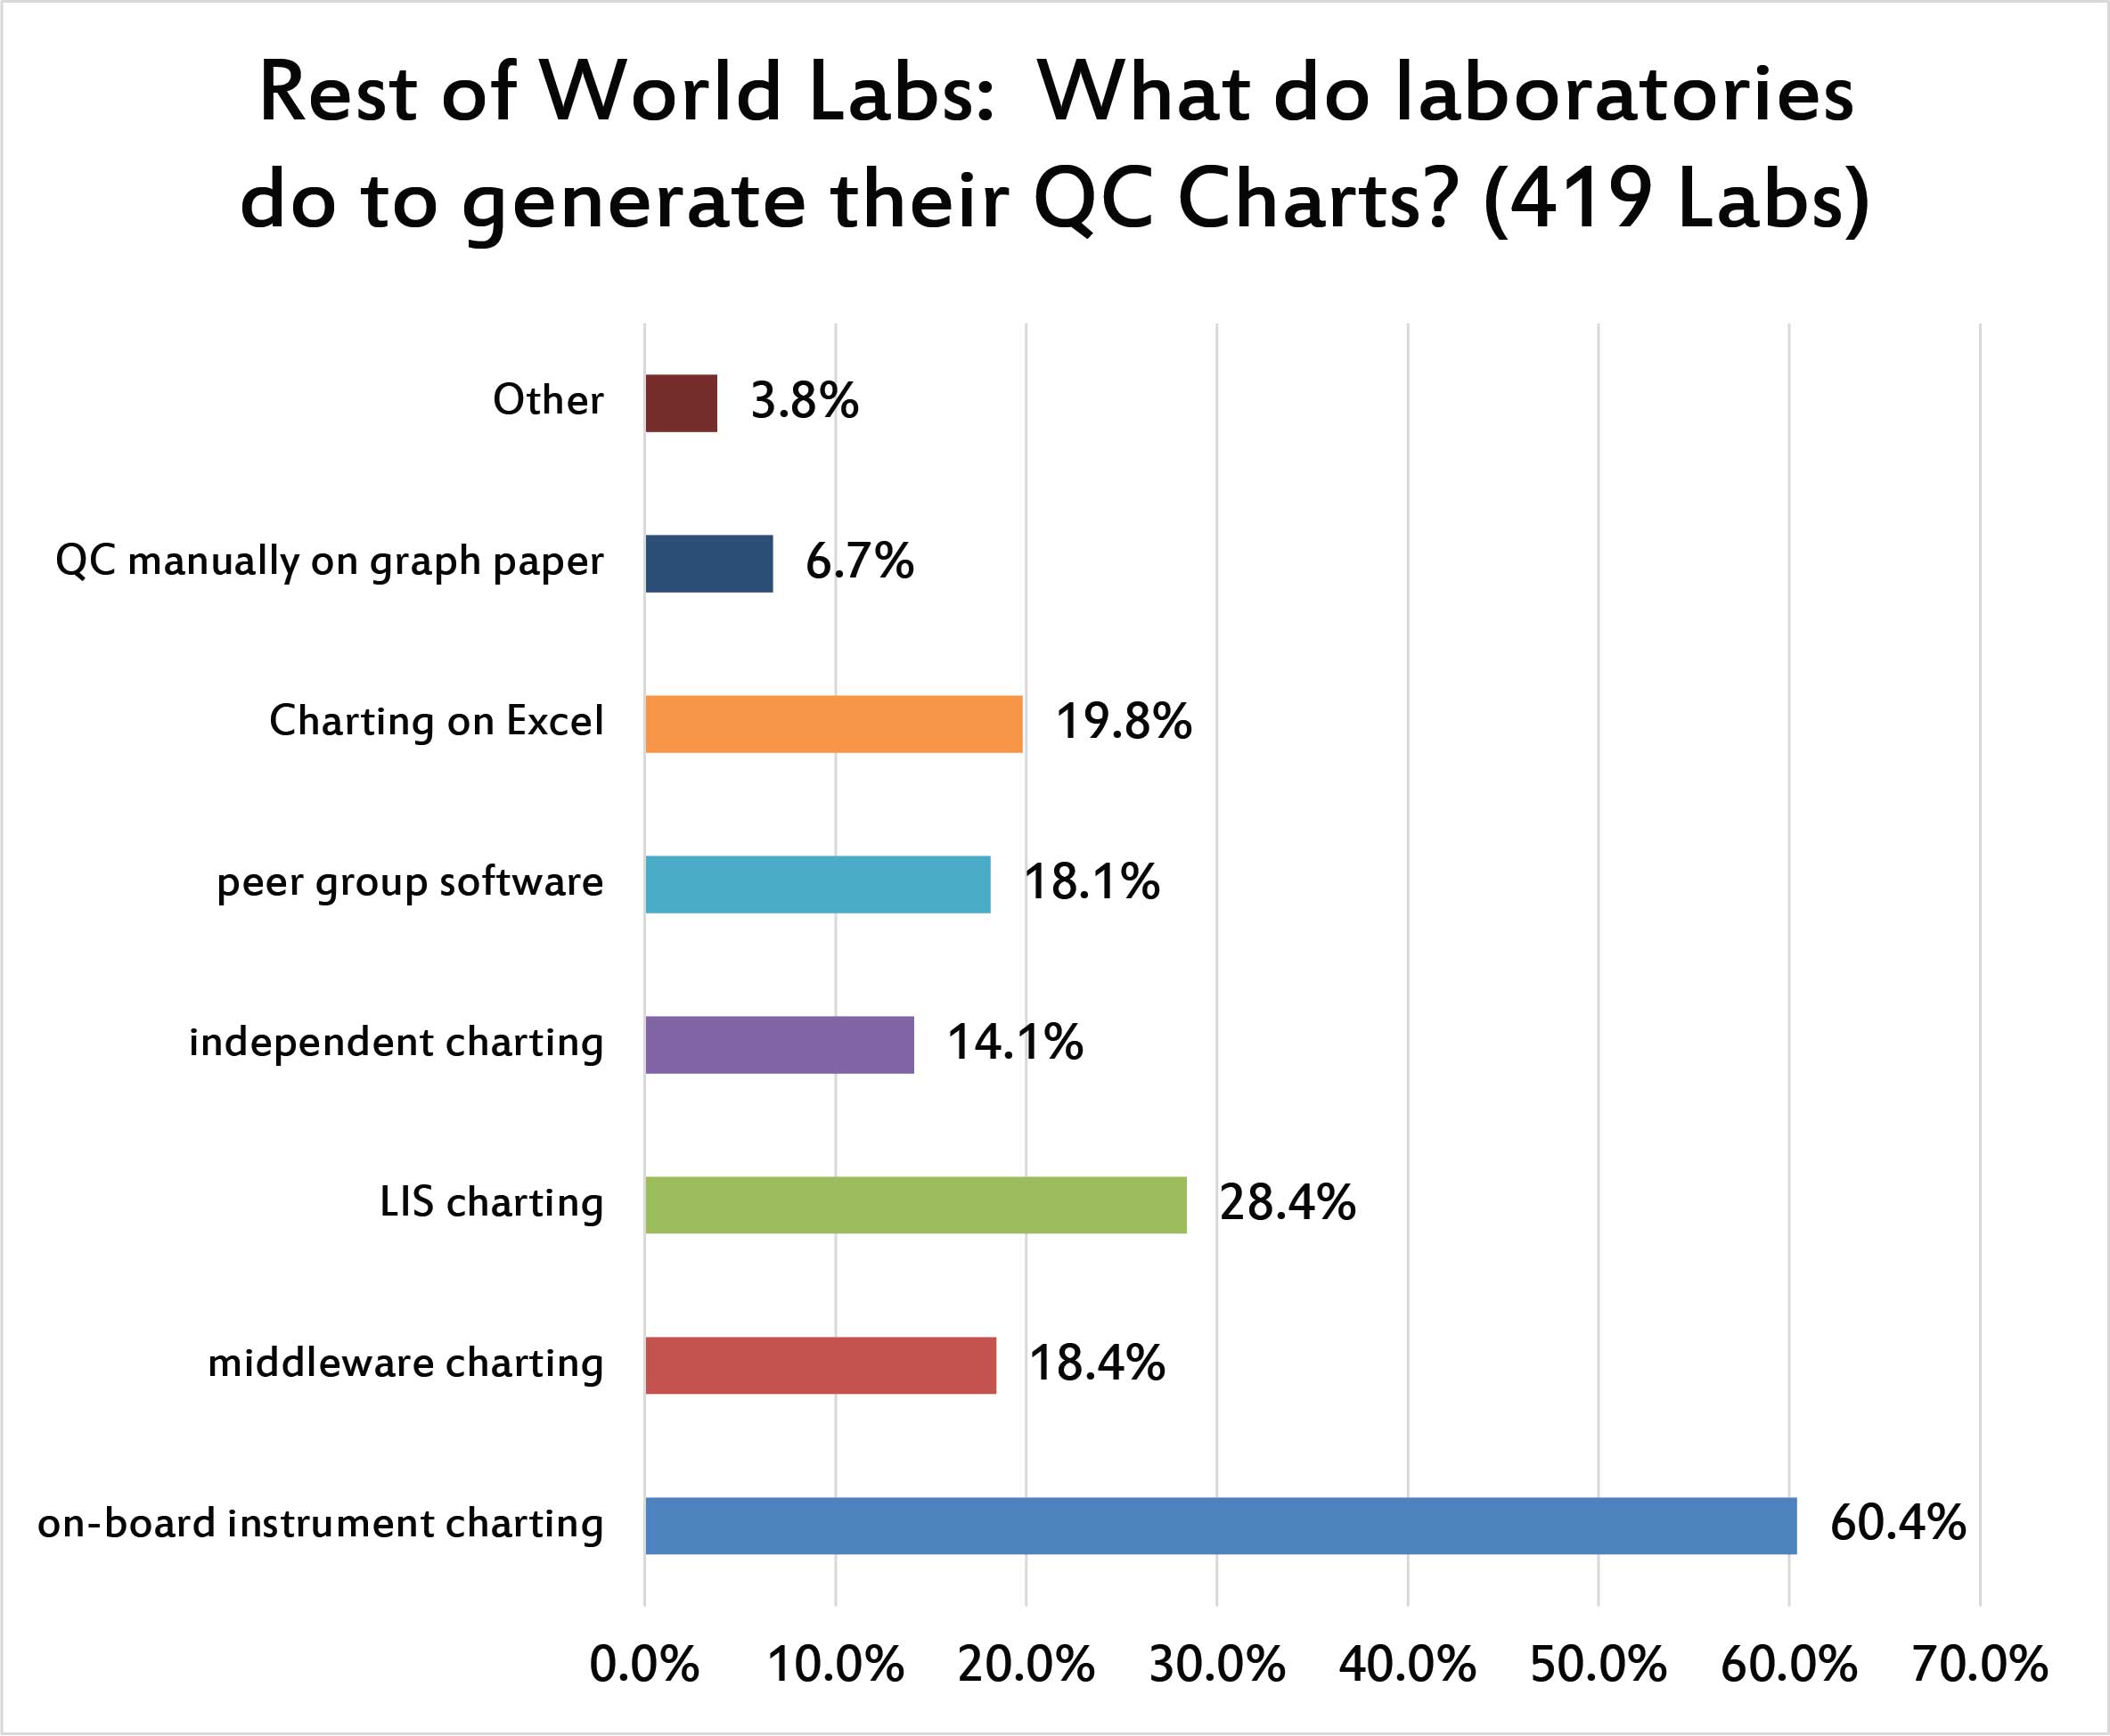
Similar to the US, the top source of QC charting is found in the instrument itself. LIS charting is more popular than middleware charting. But more laboratories are likely to chart their QC on Excel than to use middleware for that purpose. This is a big difference from the US, where relying on Excel is a much smaller percentage of laboratories. Smaller still are the number of laboratories that are using QC charting found at the level of their peer group program, or using an independent charting program separate from the instrument or LIS.
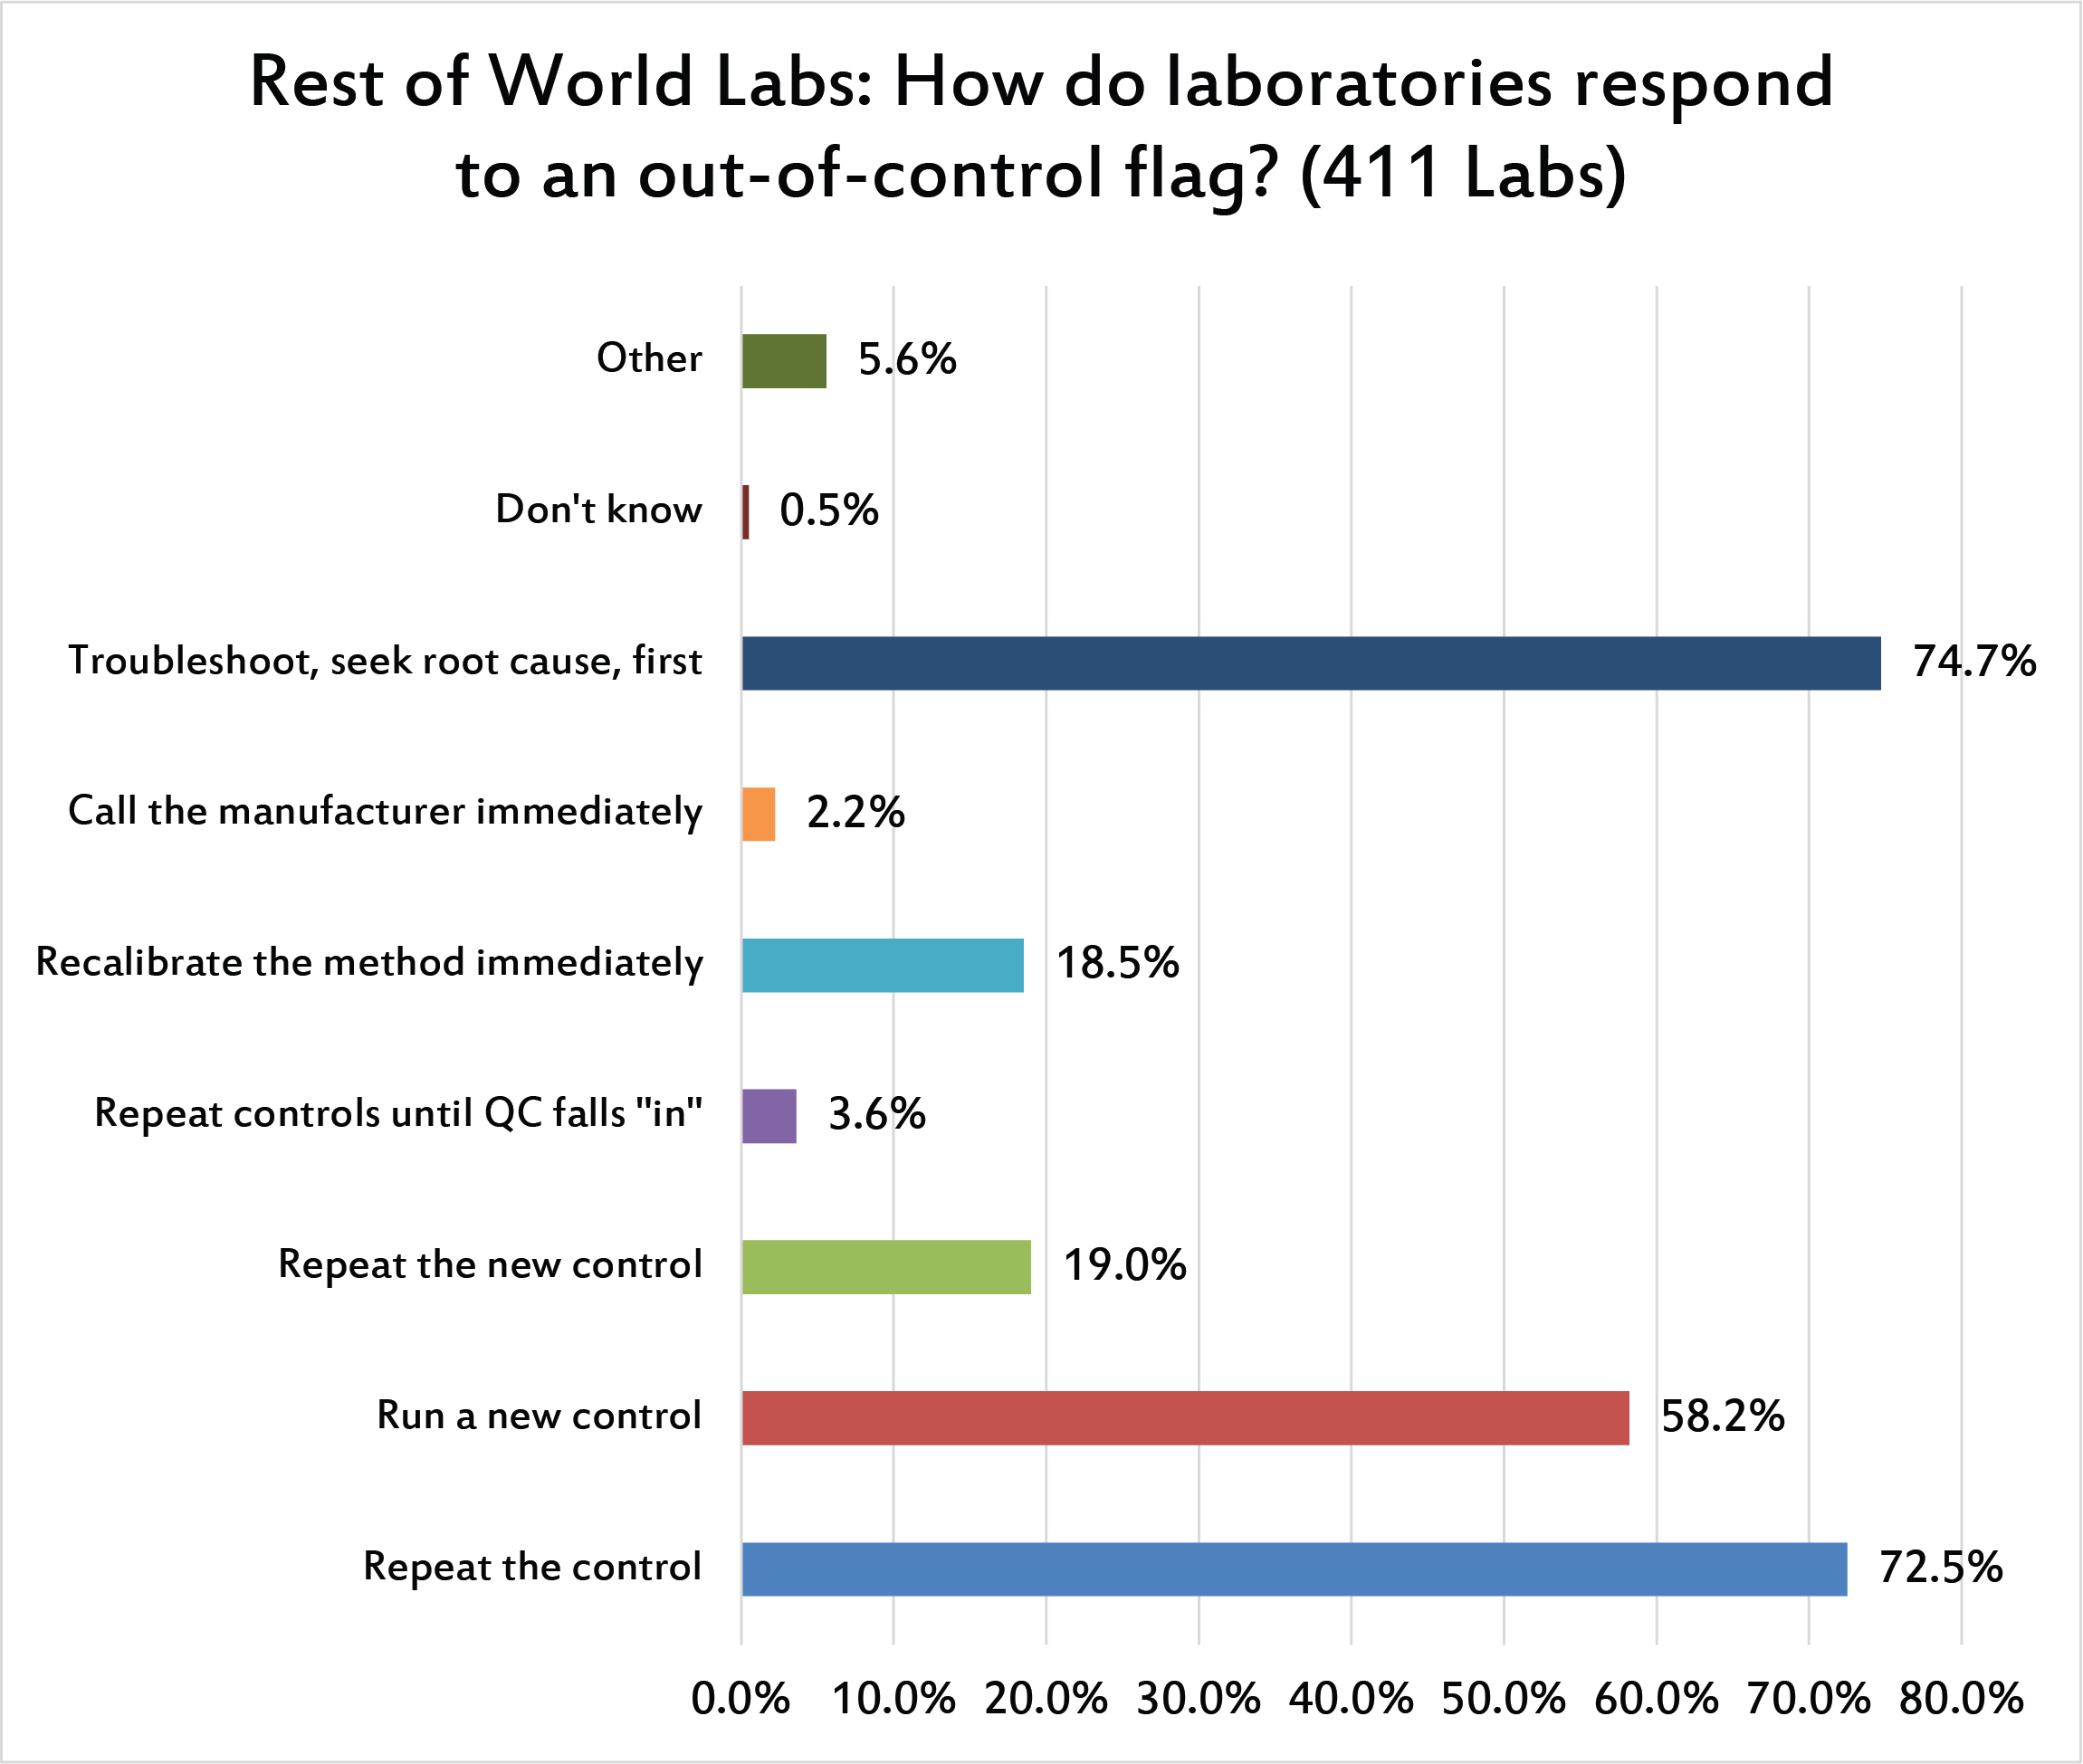
When there is an out-of-control flag, nearly three quarters of labs outside the US respond with the correct action: trouble-shoot first, seek a root cause, etc., before trying any repeated controls. But close behind that option is the repeating of the control, following by a majority of laboratories willing to run a new control if the repeat is still out, then followed again by repeating the new control even if it's out. close to 1 in 25 labs simply, disastriously, repeats and repeats and repeats until one value falls "in" and they can ignore all preceding "out" flags.
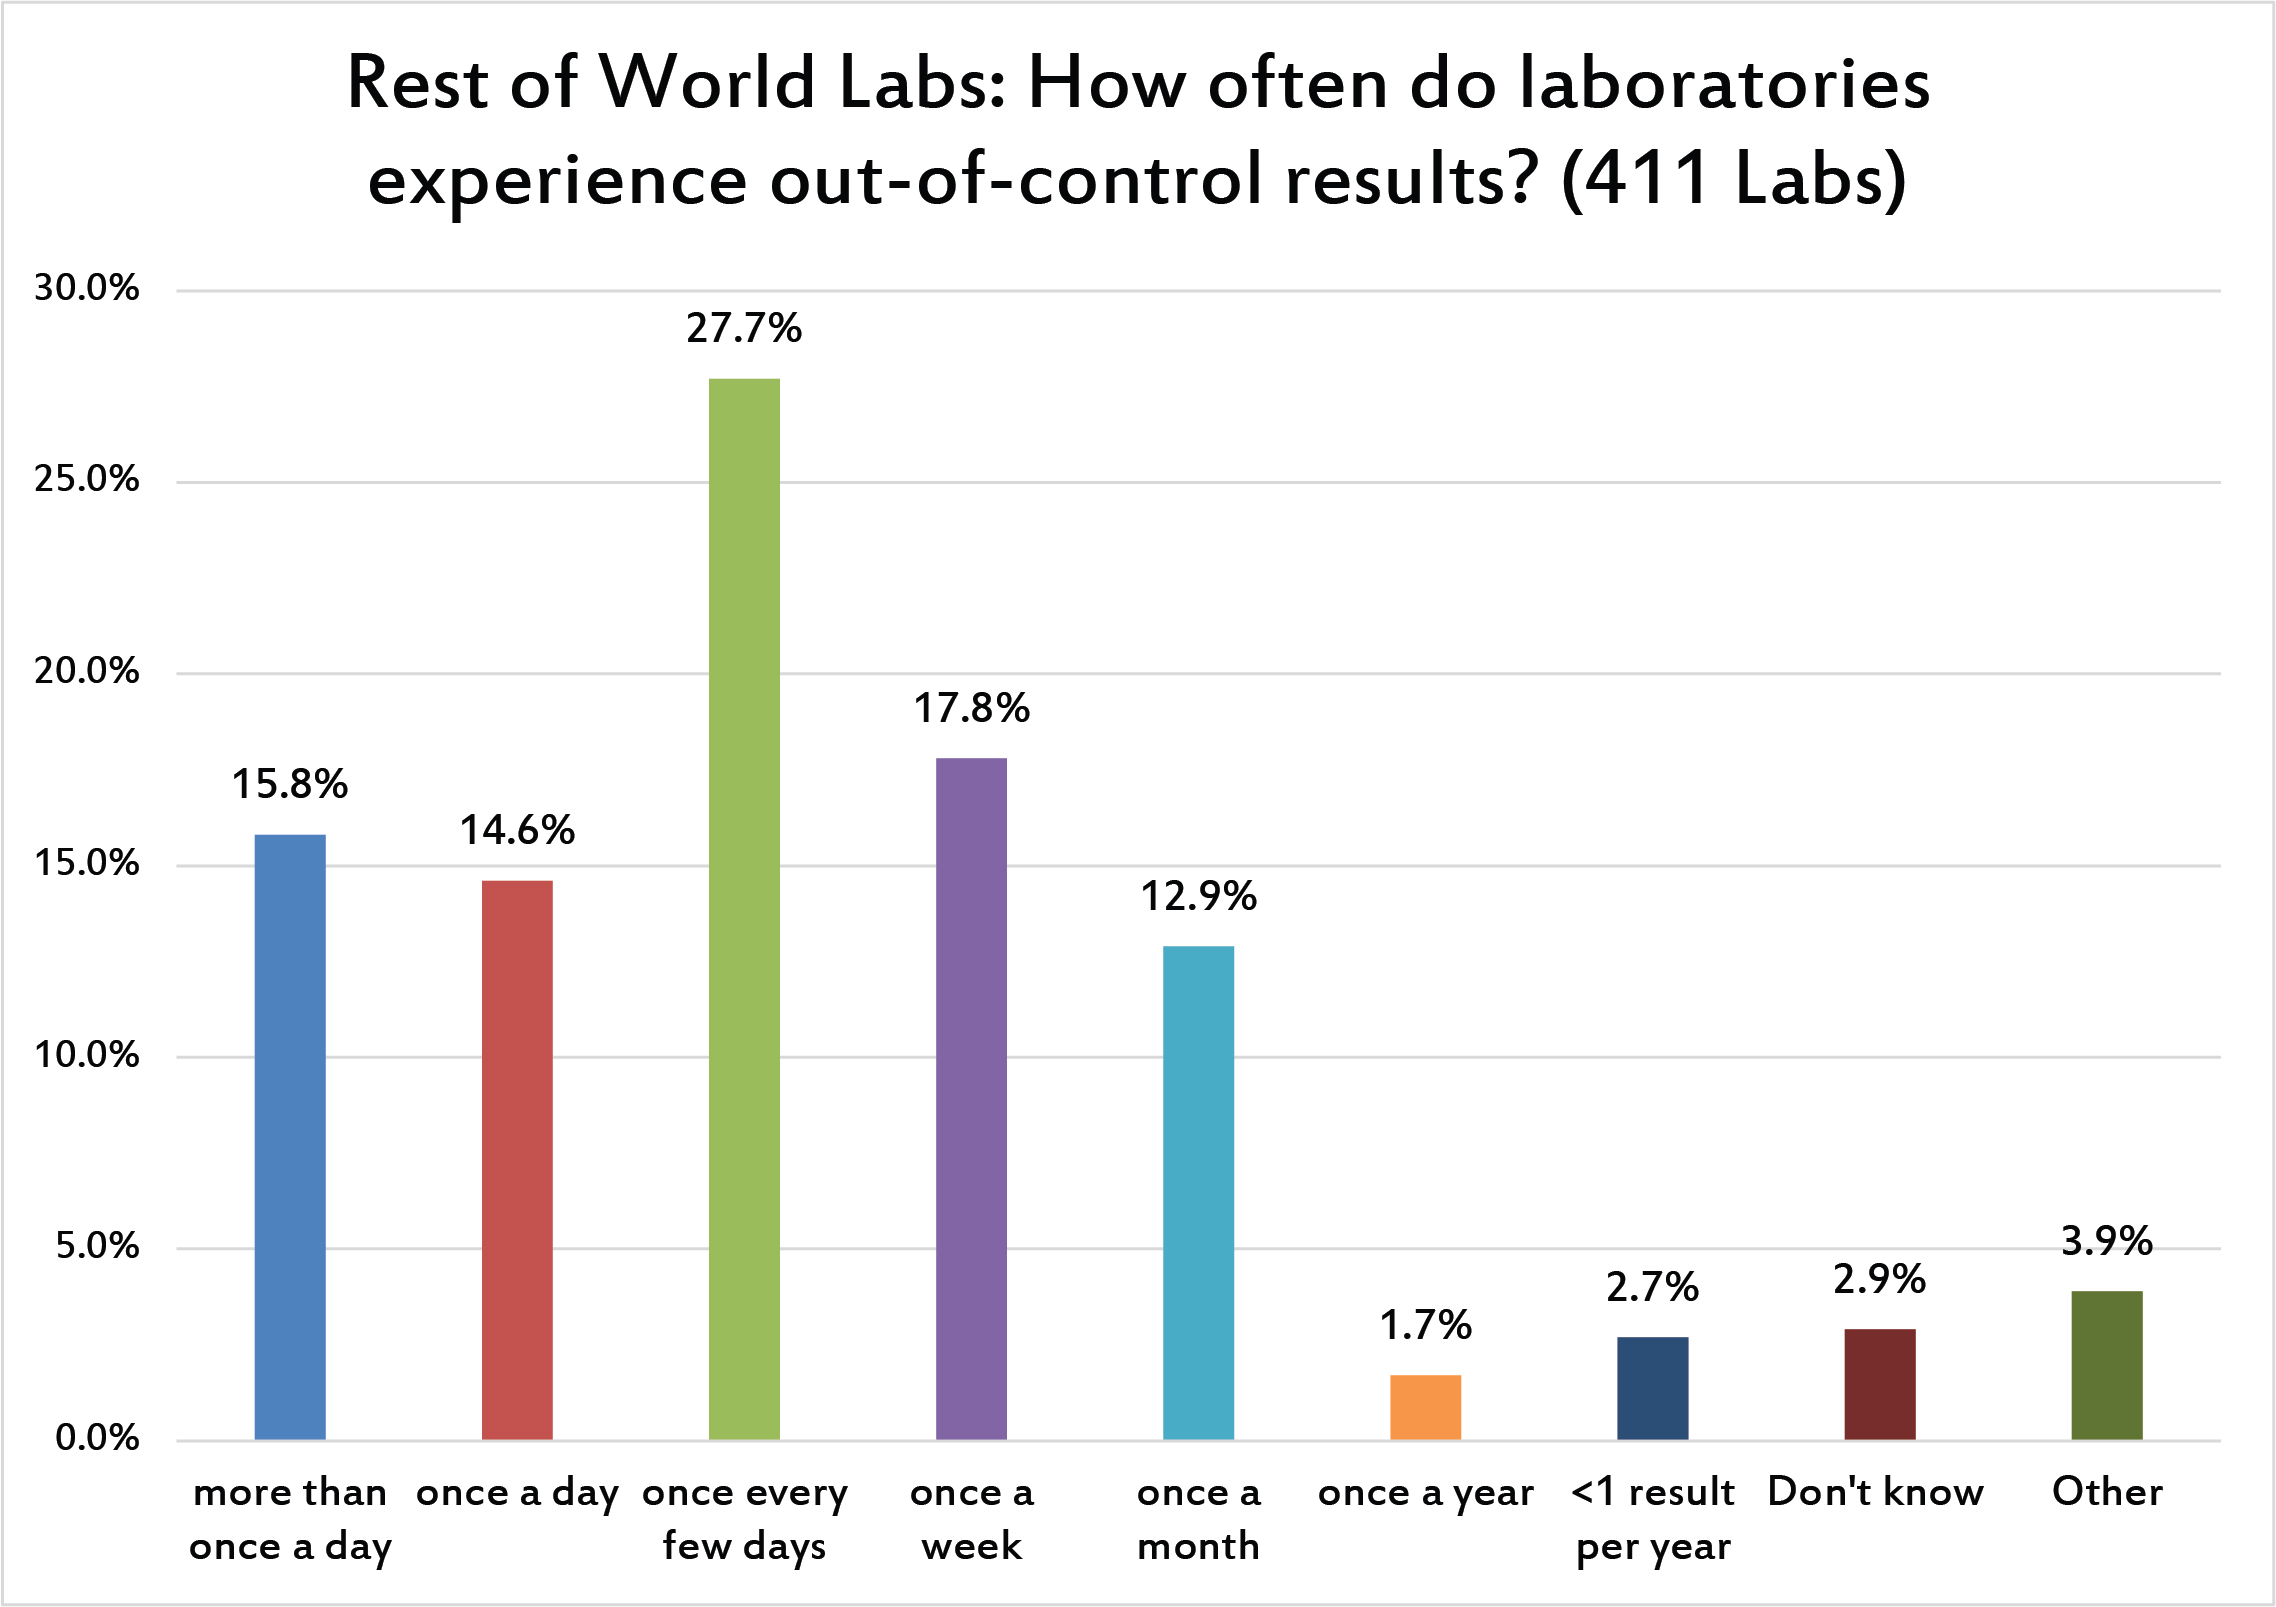
Similar to US laboratories, an out-of-control problem occurs at least once a day for more than a third of labs worldwide. A majority of laboratories experience multiple flags every week. This is a very high number of out-of-control flags, and that amount of noise risks defeaning the laboratory workers. They suffer from "alert fatigue" and begin ignoring the errors or treating them as less serious.
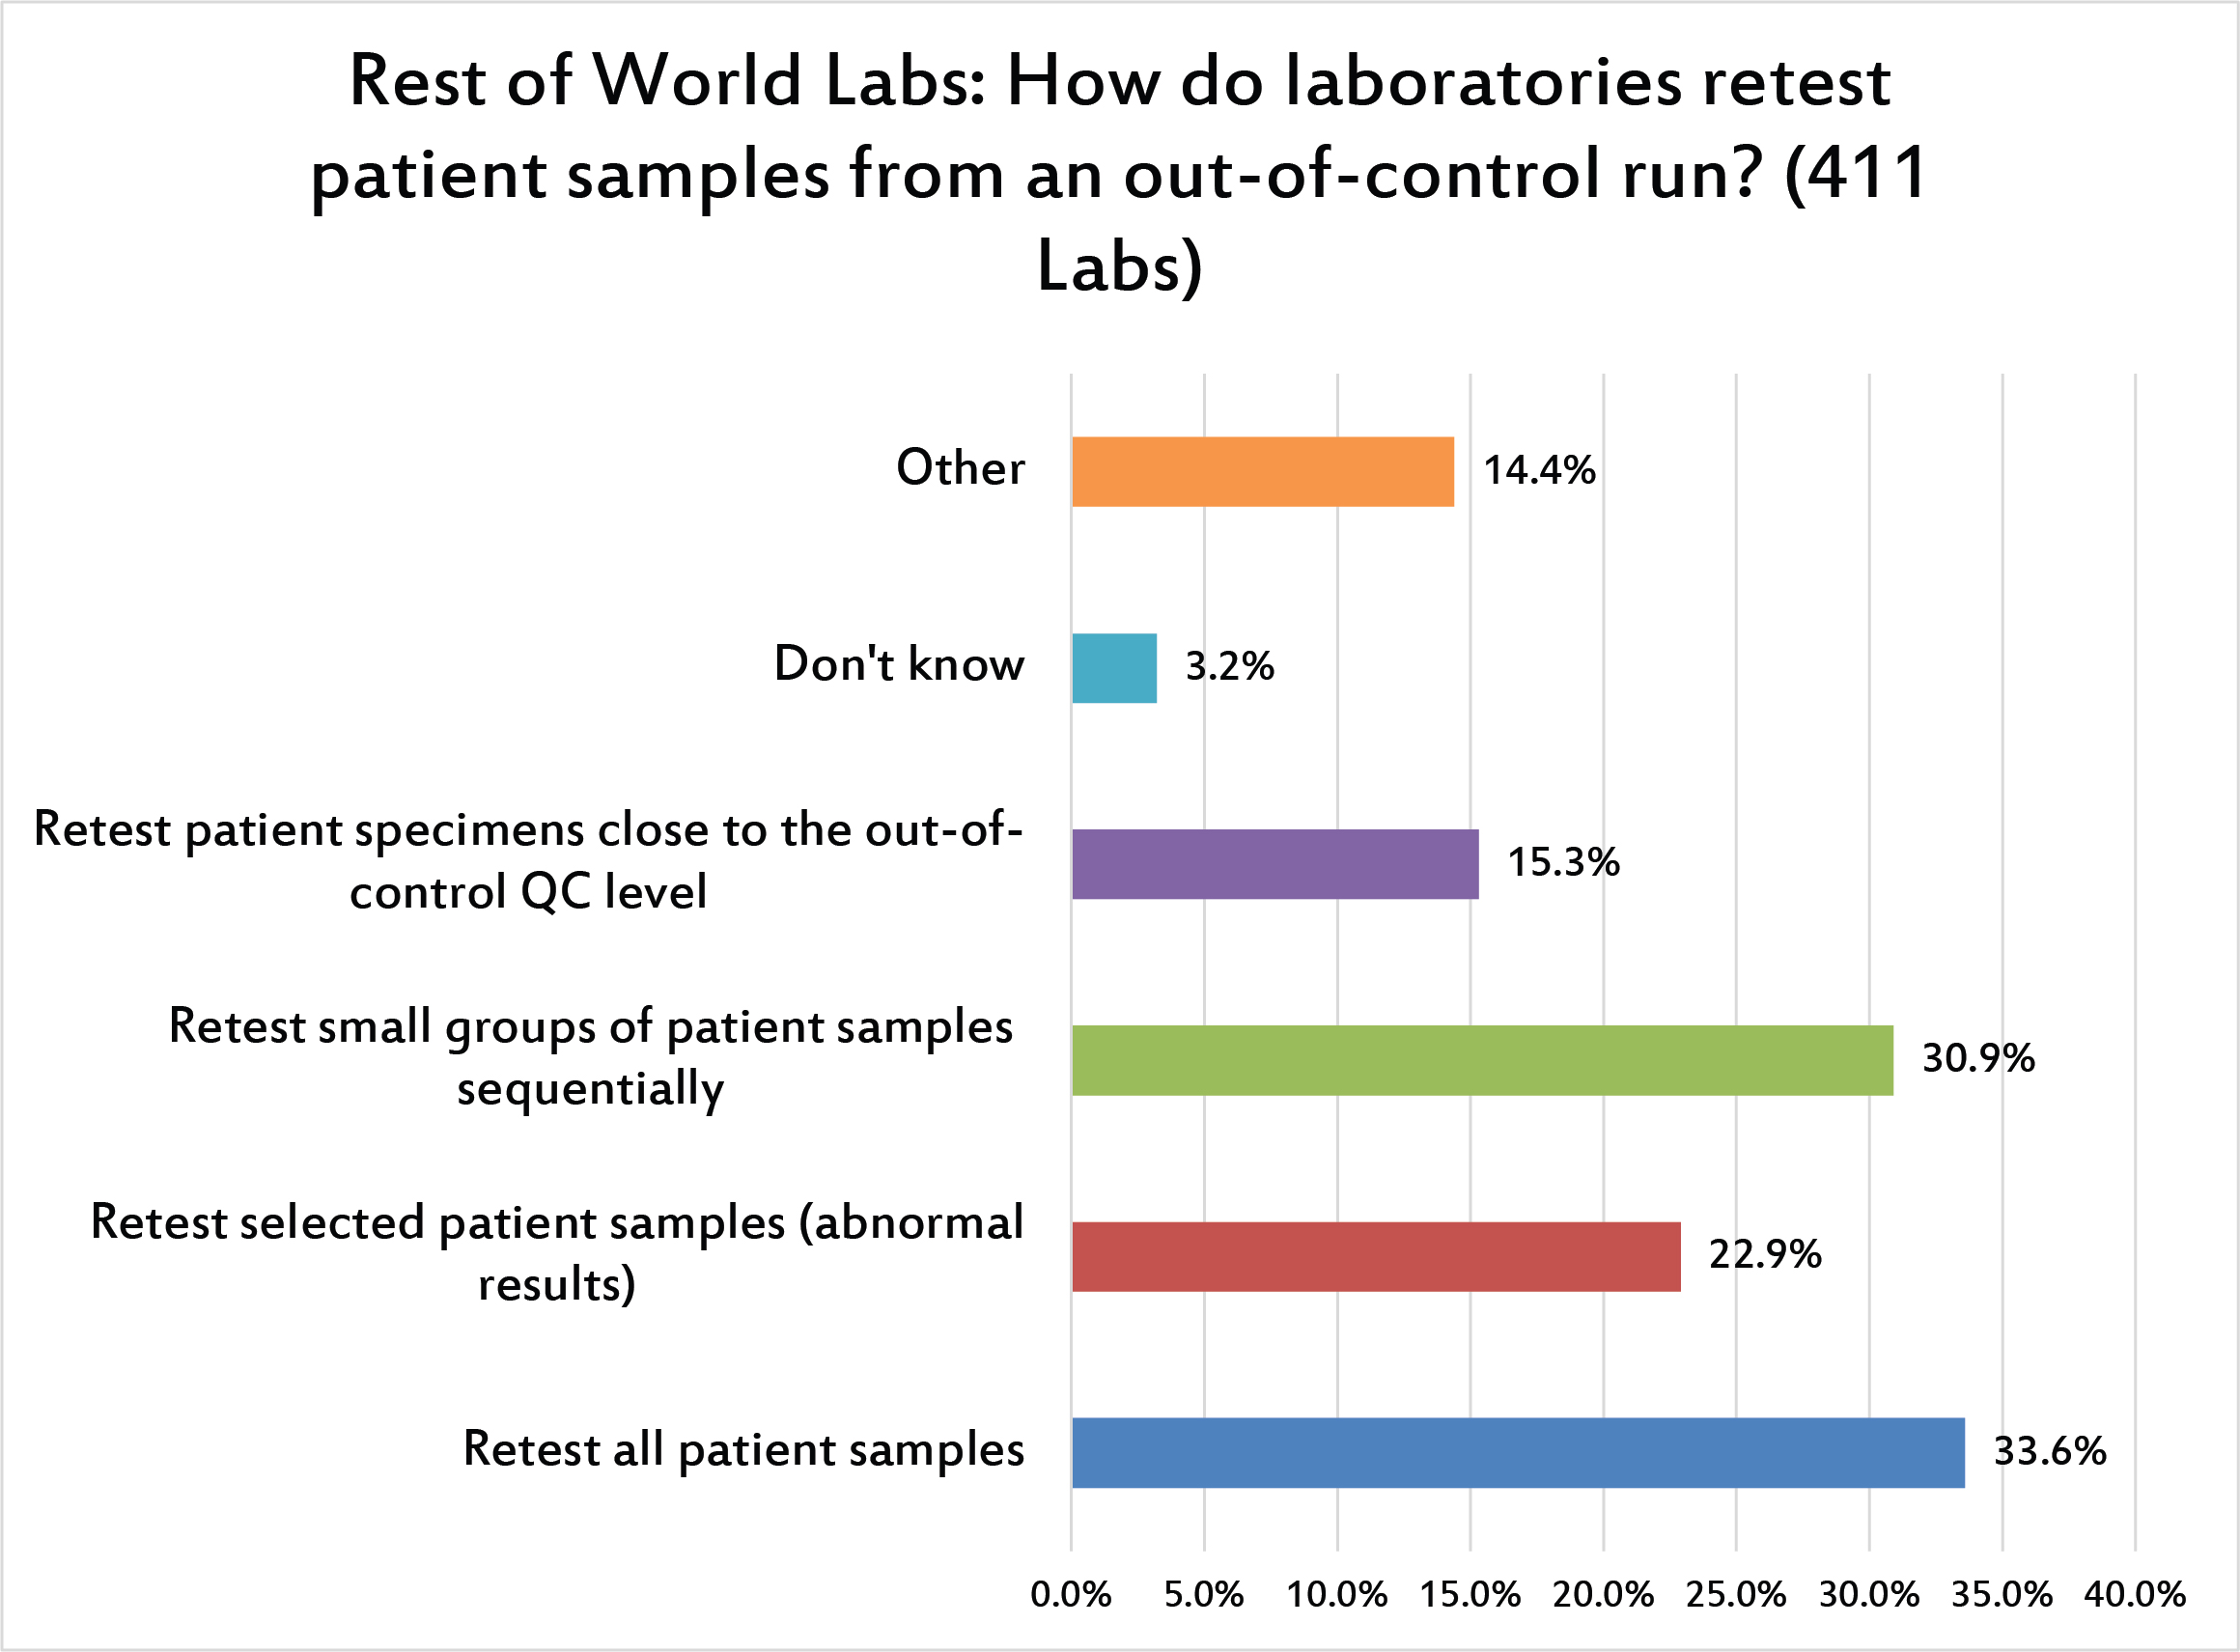
When there is an out-of-control run, about a third of laboratories worldwide will repeat all the patient samples in that run. A slightly smaller portion of laboratories will just retest small groups of patients from that run. The next most popular response is to only retest patient samples that are abnormal.
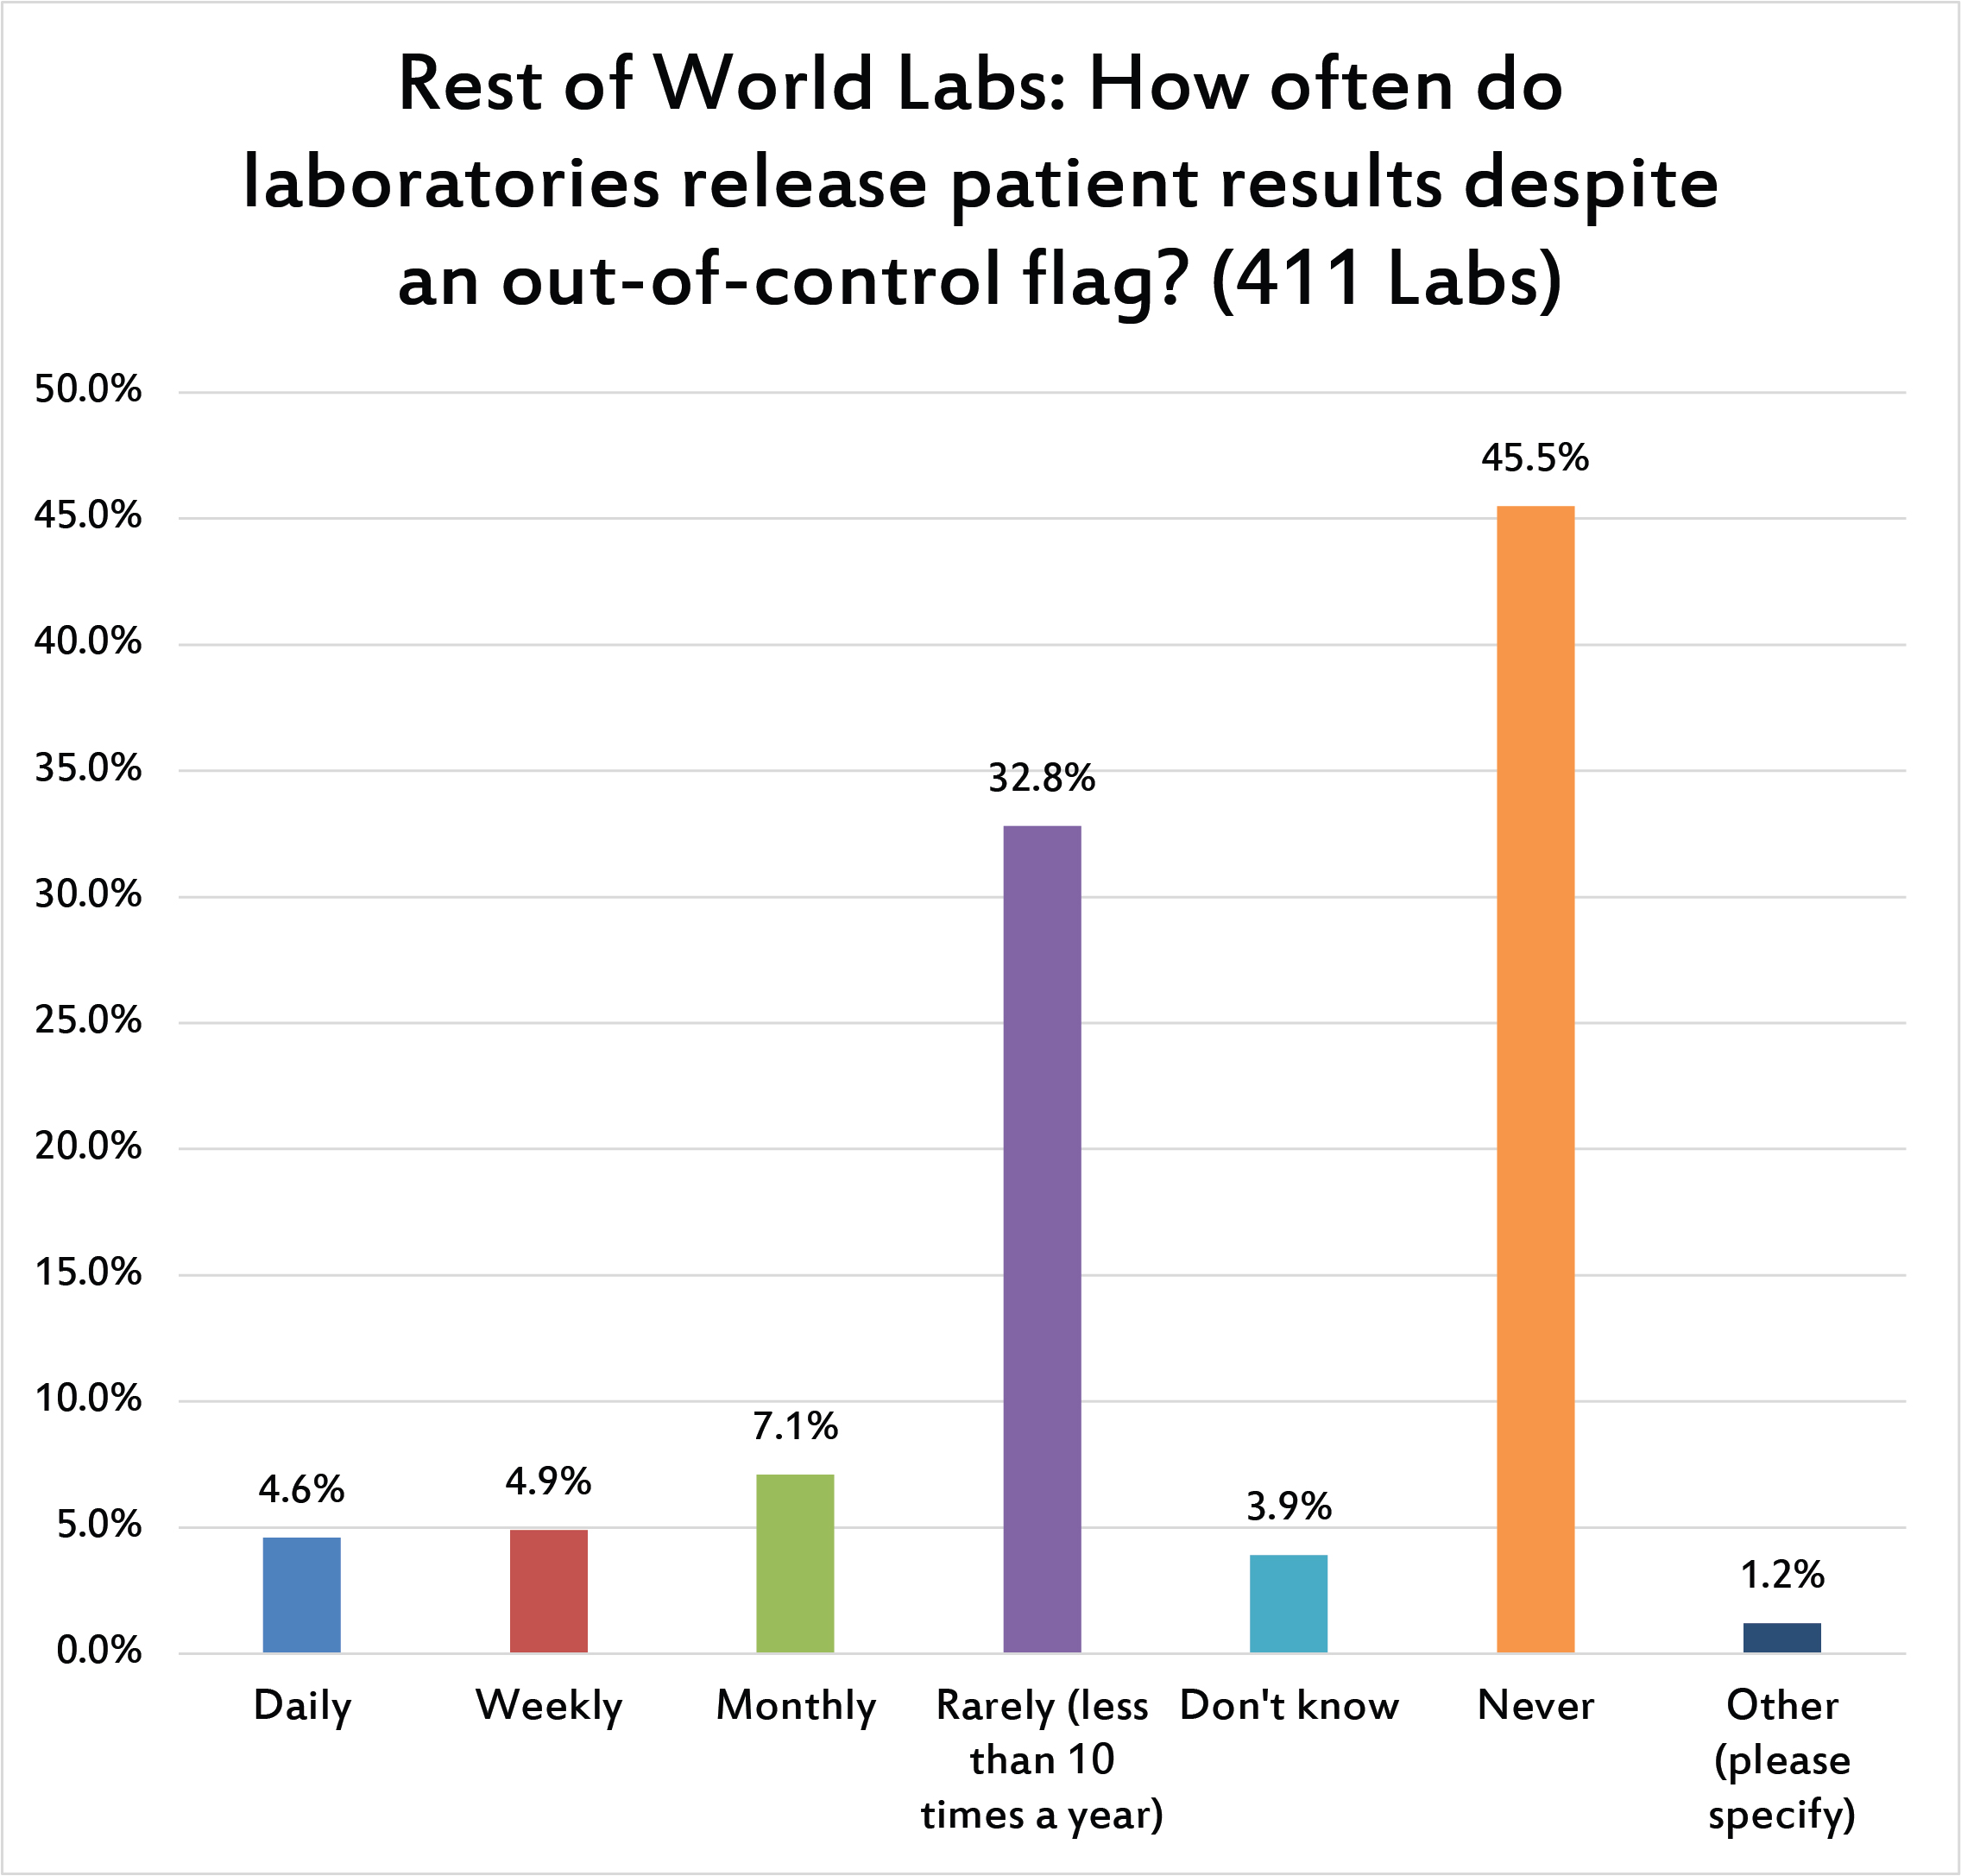
Here's the most critical question: How do all the poor practices, repeats, range errors, etc impact the ultimate purpose of QC? It's not good. Nearly 1 in 10 labs worldwide admit to releasing patient results every week (or more frequently), even when they have an out-of-control result. If we include the monthly figure, this rises to 1 in 6 labs that regularly ignore their own QC flags. This is much higher than what is reported in the US (where the rate is about 1 in 28 labs). When QC is corrupted by poor practices, we're in danger of compromising patient results.
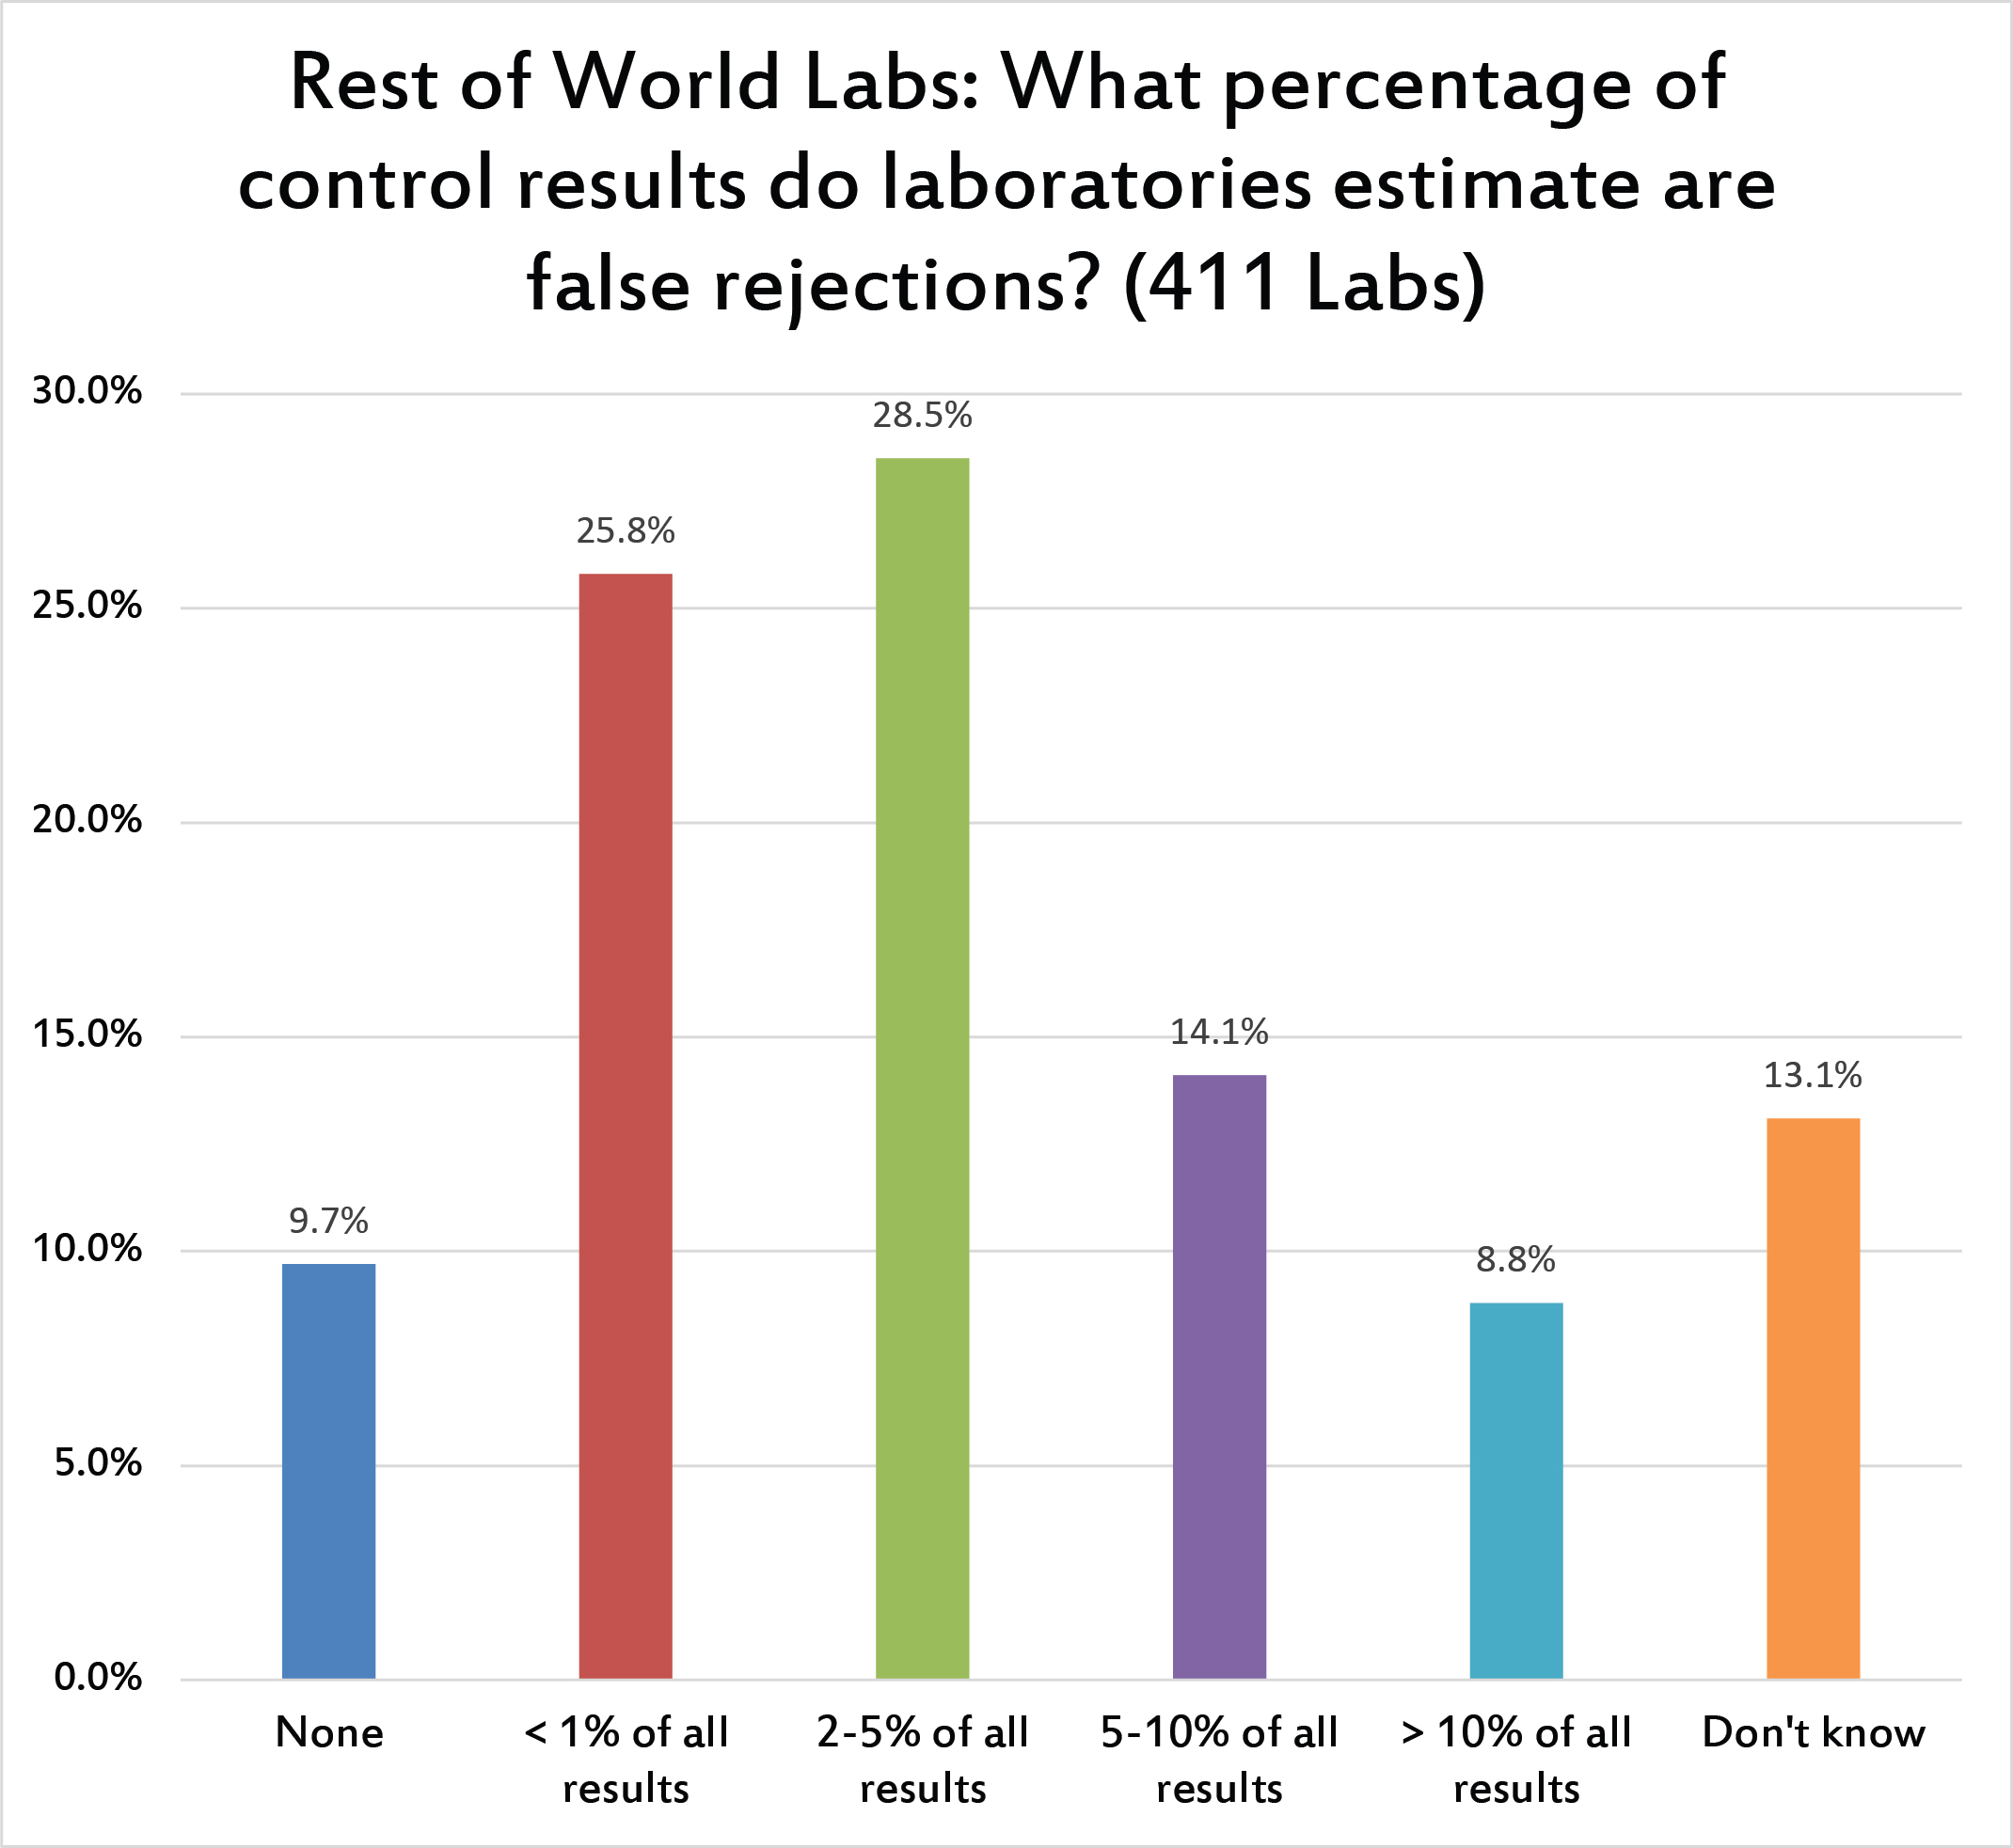
As found with US labs, almost 10% of labs believe there are no false rejections. Laudable, but false. A quarter of labs believe the false rejection is less than 1%, slightly more believe it's 2 to 5%. Labs outside the US do not believe they experience high rates of false rejection. Less than 10% of labs believe they have false rejection rates of higher than 10%, contrasting with over 20% of US labs. Twice as many US labs believe they have high false rejection rates as labs around the rest of the world.
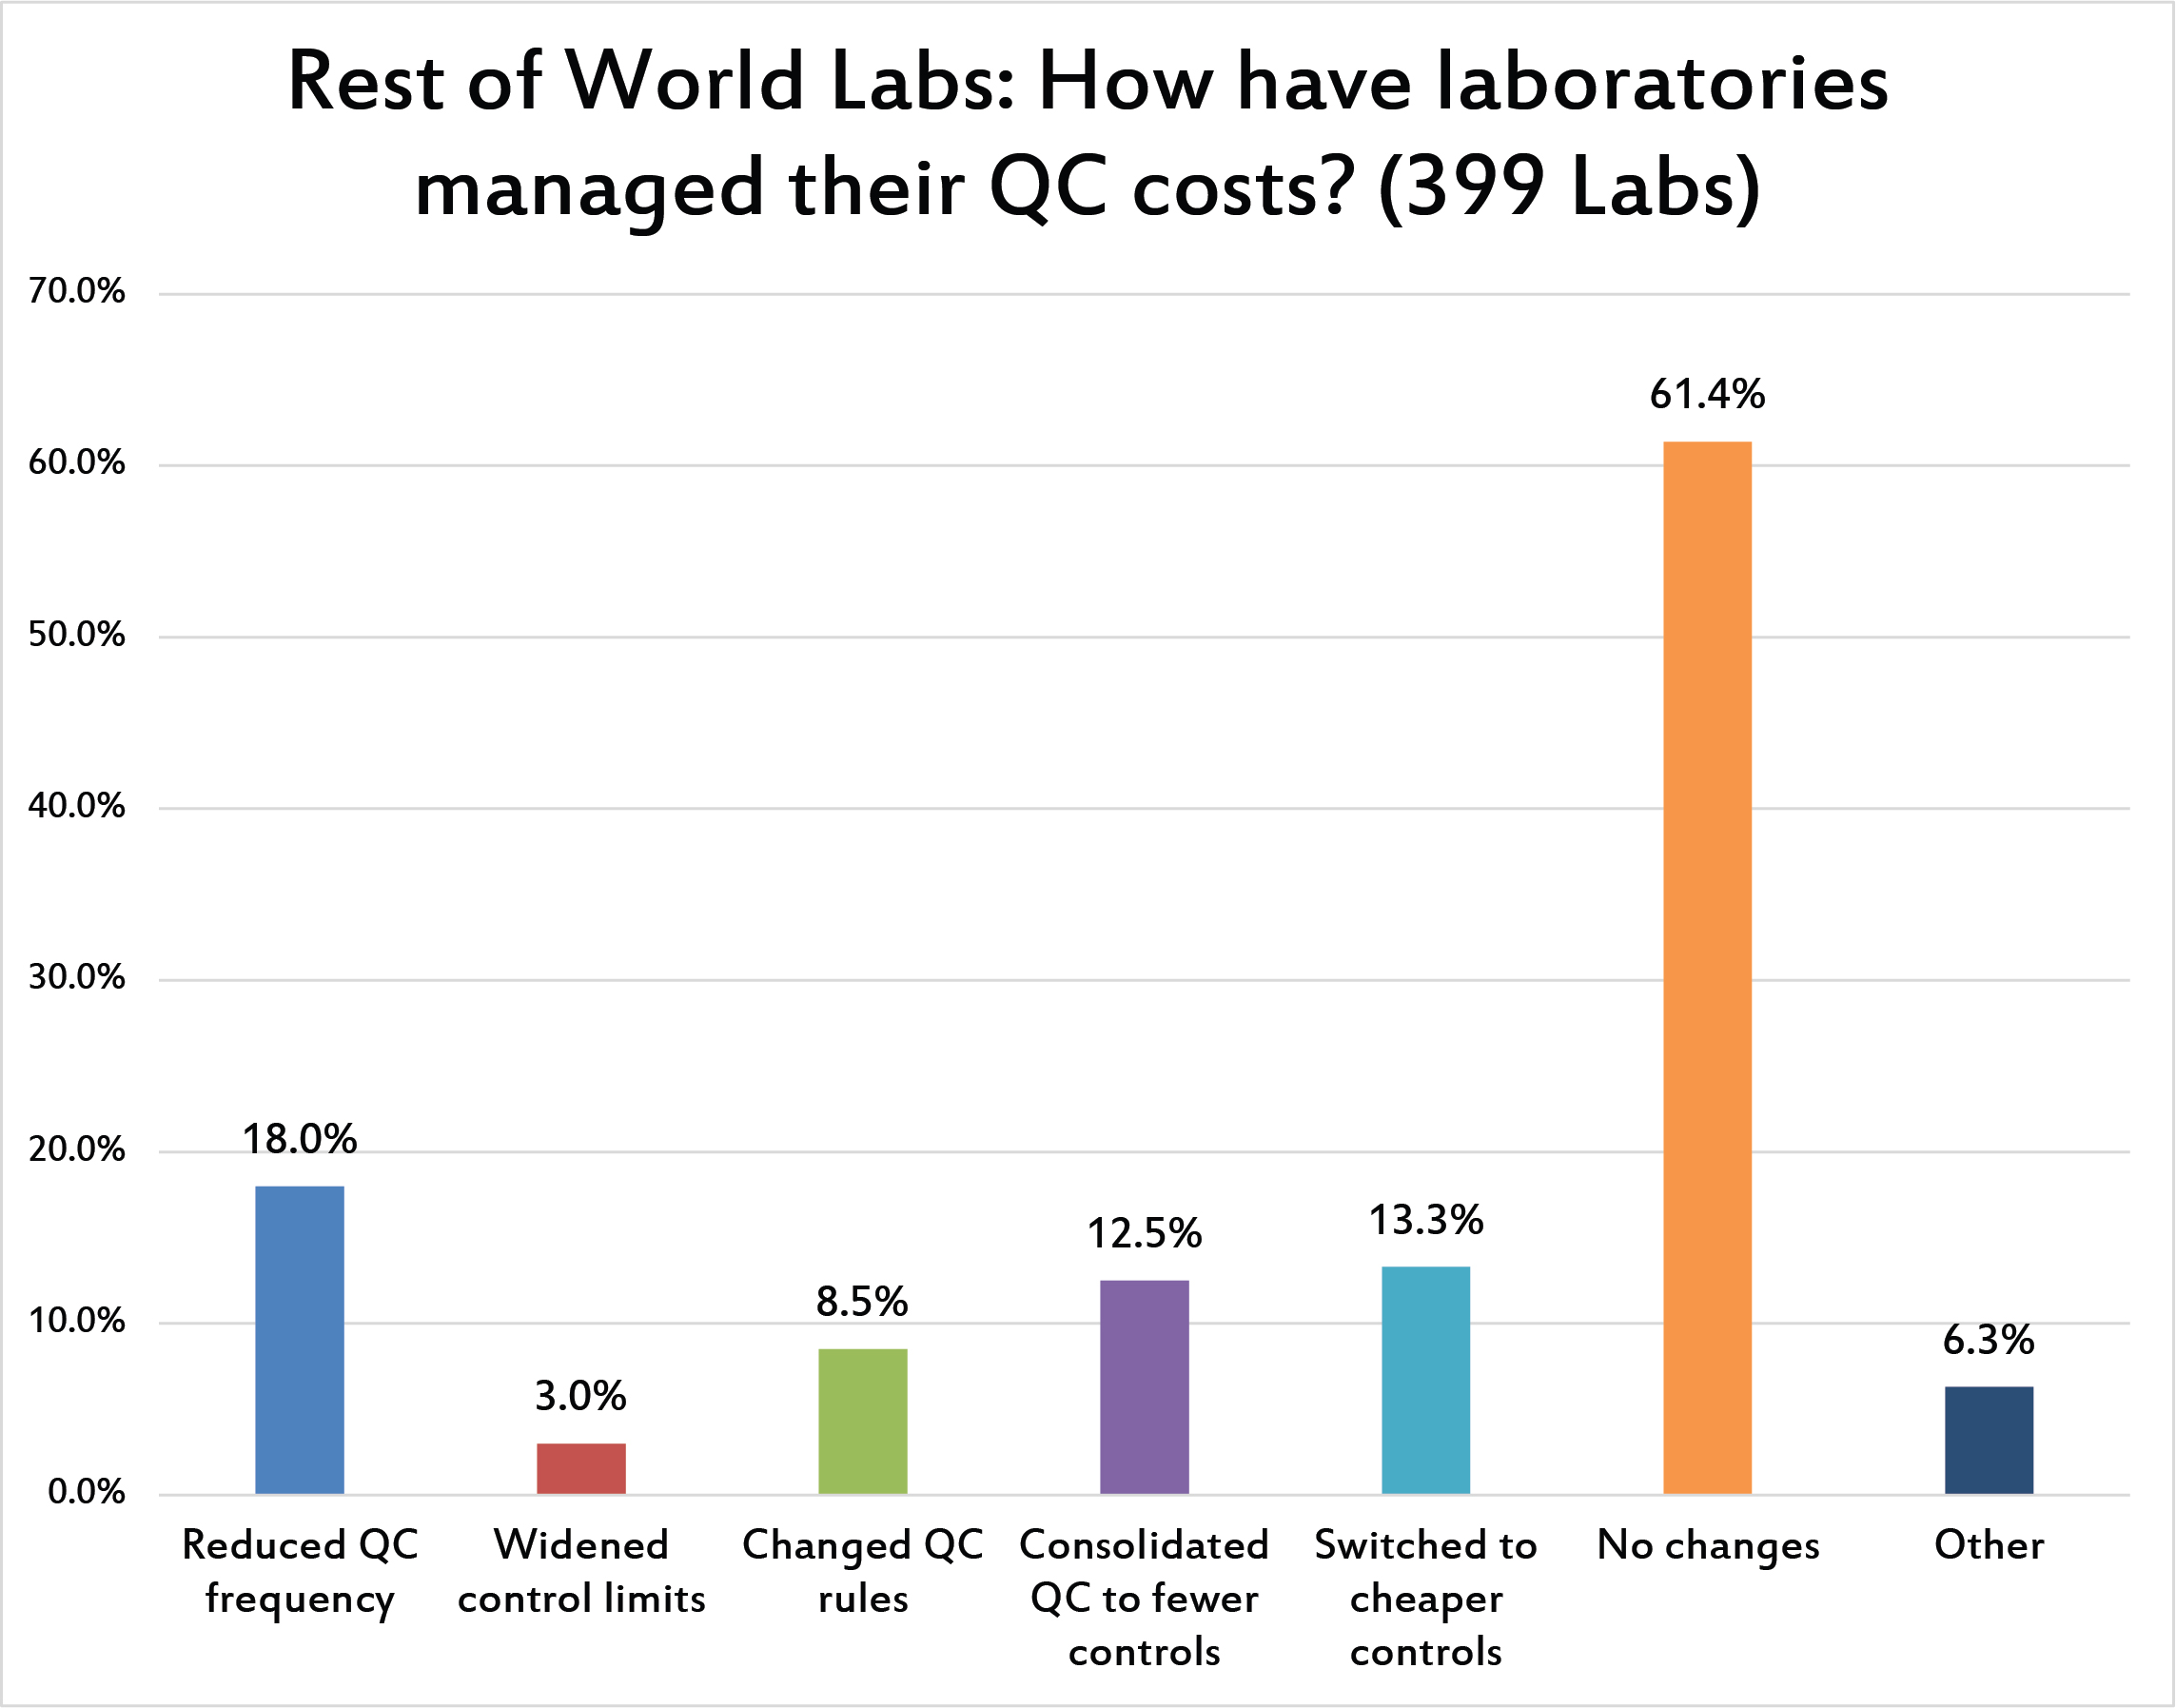
Finally, there is the question of resources and finances. Similar to the US, a majority of global laboratories have made no changes to their QC to manage costs. But even smaller percentages of global laboratories have consolidated to fewer controls (In the US, they are twice as likely to have consolidated their control usage) . But about the same percentages of laboratories have considered changing their limits, their rules, or their frequency. Given that many labs are not truly optimizing their QC, it's not surprising to see they haven't considered these changes as a way to manage cost. But this means there may be some low hanging fruit for labs seeking cost savings. Considering a change to consolidated or cheaper controls may be a way to reduce laboratory costs without compromising quality. And if the assays in the laboratory are of high quality, even more savings can be realized.
Conclusion
The most distinct finding of the global survey is of course that more labs outside the US are releasing patient results even when the run is out of control. Nearly twice as many labs outside the US than inside the US report this behavior. It's particularly interesting given the finding that global labs are probably running more QC and more frequently than US labs. Also pertinent is the fact that the survey indicates US labs repeat controls more often than labs in the rest of the world. This may mean that US labs aren't better in their quality practices, they're just more willing to repeat controls until they get "in", while labs outside the US don't bother with the charade, they just release the results without all the repeats.
Overall, it's a sobering survey. There's certainly room for improvement. Actually there's room to just become competent. And we hope that these results will spur laboratories to go beyond competence and strive for excellence, optimization, and real efficiency gains.
For a free copy of these graphs, go to our download section.