Basic QC Practices
Plateau-ing on progress at the pre-analytical phase
The latest news on pre-analytical errors. In 2019, are we pushing the limits of improvements we can make?
Are we reaching a Plateau on Progress possible at the Pre-analytical Phase of testing?
Sten Westgard, MS
July 2019
More than 20 years ago, a seminal publication launched a veritable industry:
Plebani M, Carraro P. Mistakes in a stat laboratory: types and frequency. Clin Chem 1997;43:1348-1351
This paper boldly stated that pre-analytical errors are the major issues facing our laboratories, with post-analytical and analytical errors a distant second and third, respectively. A host of papers followed upon this first one, which reinforced this finding, and soon more and more papers were being published, special theme issues were featured in prominent journals, regular conferences were scheduled that were devoted solely to the subject, and standing committees were established by the IFCC and AACC to address these issues. More than a decade ago, in 2008, the IFCC established the WG-LEPS, Working Group on Laboratory Errors and Patient Safety. Over the series of years, they built a system of Quality Indicators to address the total testing process.
The latest paper, now published 11 years after the WG-LEPS was formed, not only has a large measurement of the “state of the art” of pre analytical processes, but has established a set of performance specifications – how good they believe laboratories should be at pre-analytical quality.
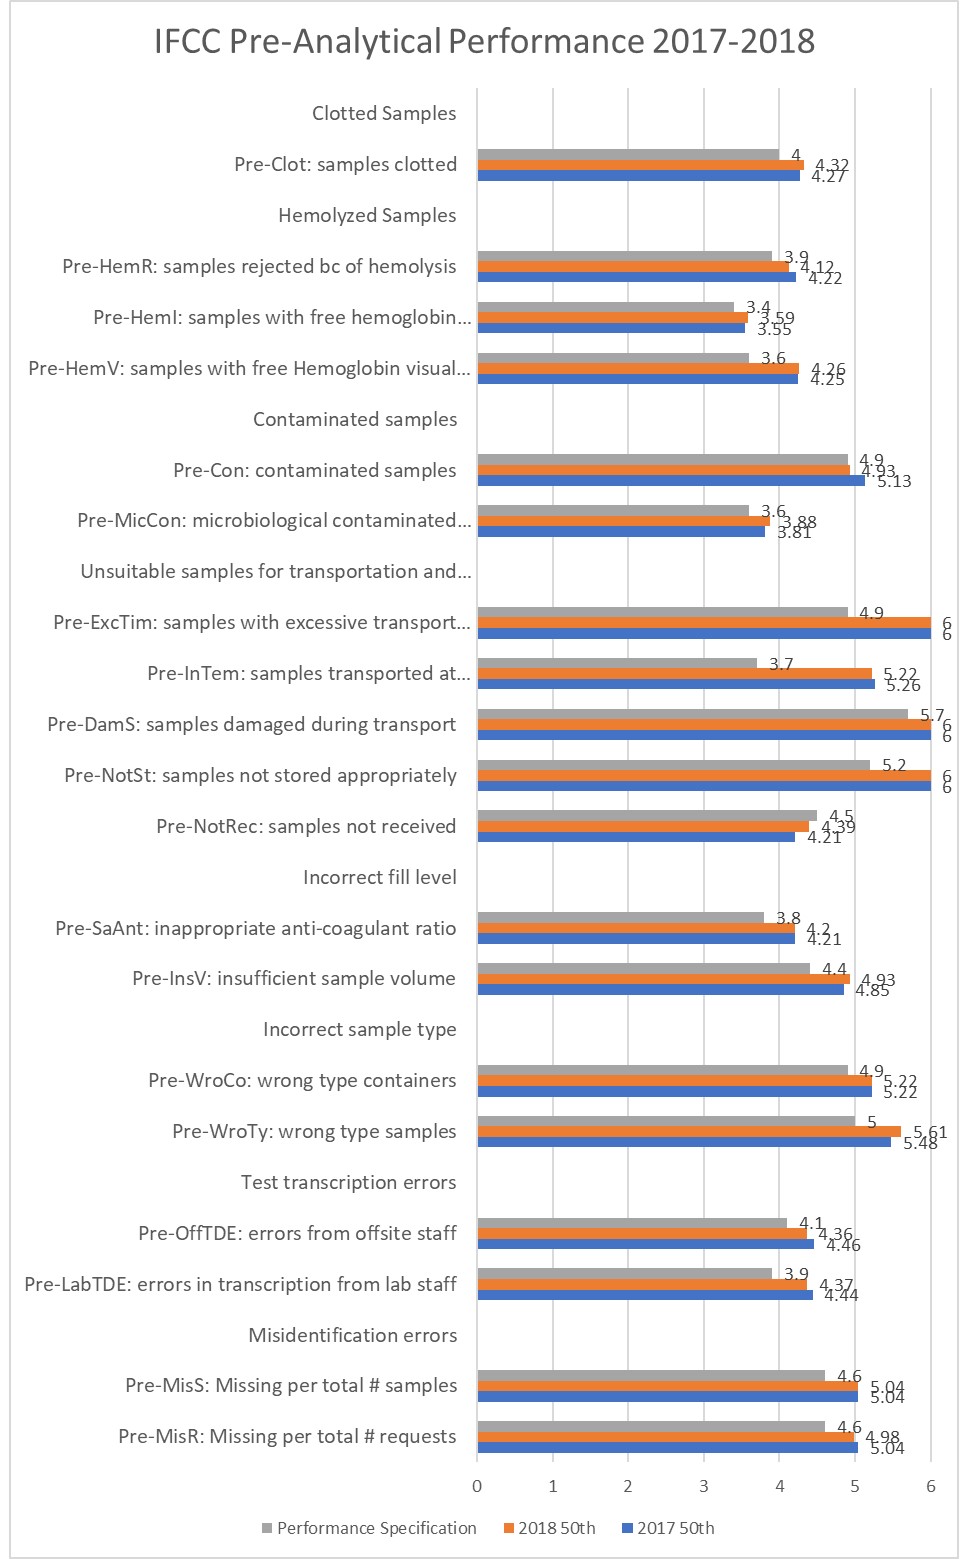
Notice all these metrics are on the Six Sigma scale, which the WG-LEPS recommend as benchmarking tool. Further notice, Six Sigma is not being achieved on most processes, nor is the WG-LEPS even suggesting that is the level of quality that is desirable or achievable. Practical difficulties of achieving such high quality in a process that involves a lot of human touch mean that we have to be realistic, accepting something a bit less than Taking a look at this latest data, and comparing it with a selection of the many other studies recently published about the quality metrics from different labs around the world, there are some intriguing discoveries to be made.
For instance, here is a Turkish study which looks at the improvements made during a Risk Management project:
Continual improvement of the pre-analytical process in a public health laboratory with quality indicators-based risk management
Canan Karadağ, Nafi Nevrez Demirel, CCLM Published Online: 2019-05-03 | DOI: https://doi.org/10.1515/cclm-2019-0019
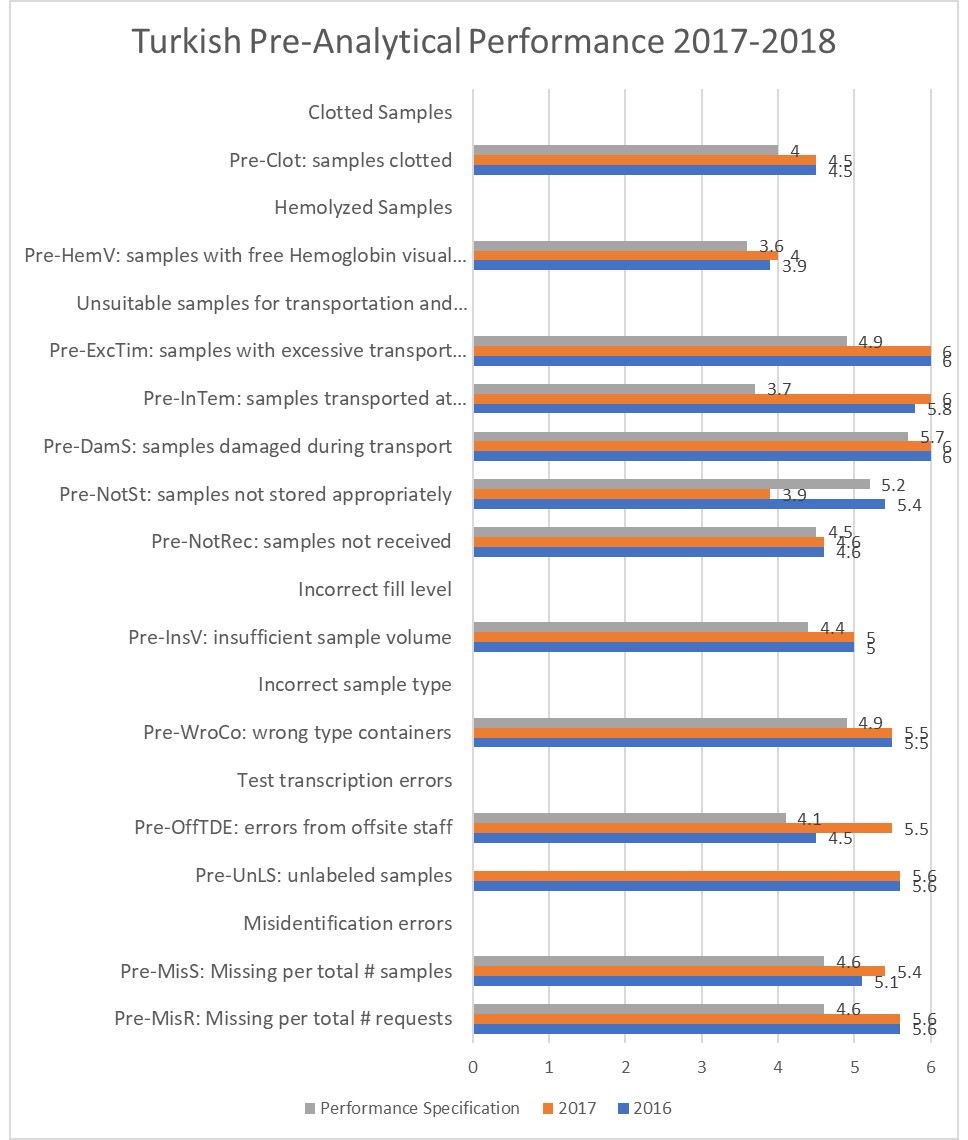
First, it's apparent that all pre-analytical metrics at this Turkish hospital is doing better than EFLM performance specifications for all measured indicators. Second, the difference between the before and after stage of the risk management project is not that big. While a major effort was put into the improvements, actually there was a bit of backsliding, specifically in the are of storage of samples, with quality at 5.2 dropping to 3.9, below the EFLM performance specification. If that is taken into account, there is a 0.04% decline in performance of the system. If, however, we would make allowance for one bad issue with one indicator, there was a small improvement, reducing 547 defects per million down to 441 defects per million across all indicators. That's only a 0.01% improvement. If we're trying to get the best "bang for the buck", we probably want to focus on areas where we can get larger payoffs for our efforts.
Next, we are see a similar paper, this time from Korea:
Reduction of pre-analytical errors in the clinical laboratory at the University Hospital of Korea through quality improvement activities.
Lee NY, Clin Biochem. 2019 Aug;70:24-29. doi: 10.1016/j.clinbiochem.2019.05.016. Epub 2019 May 31.
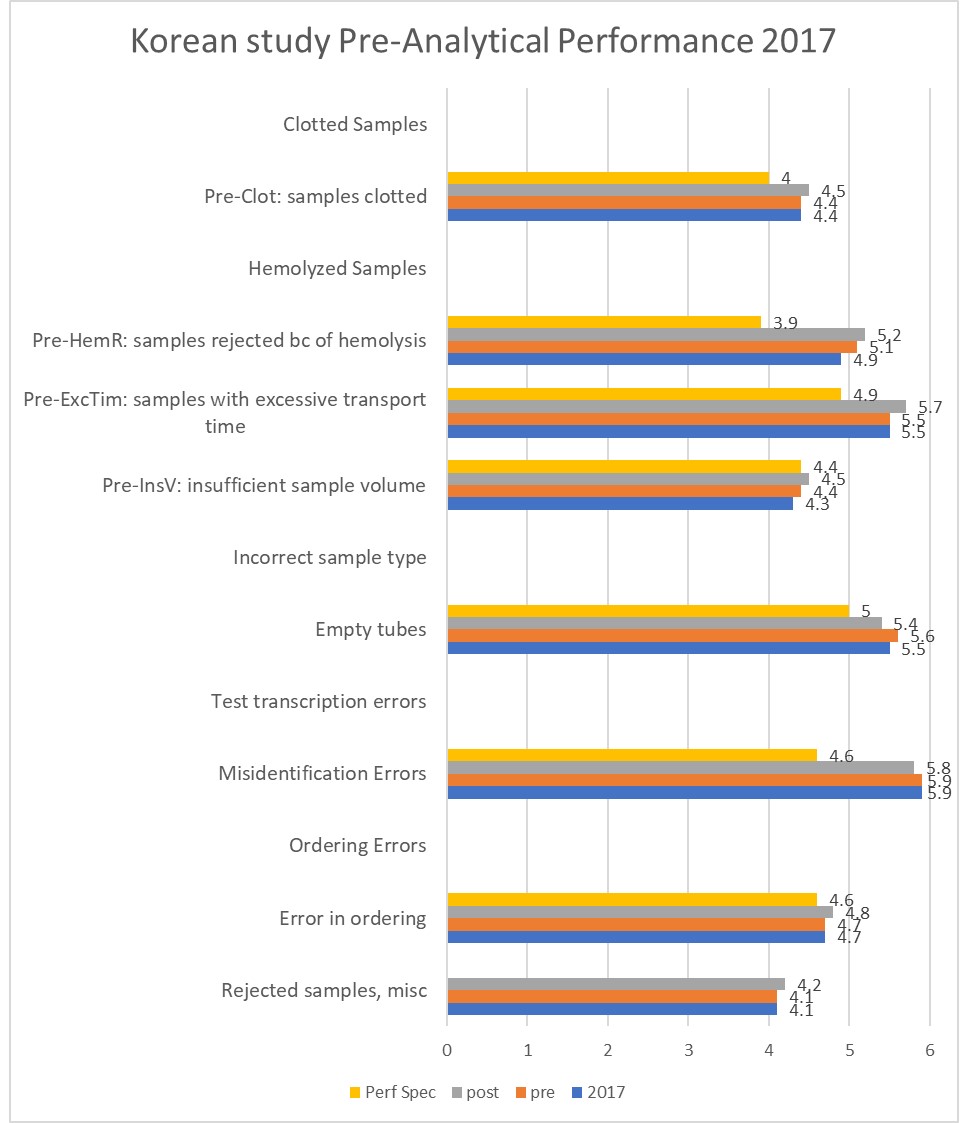
This study made an annual benchmarking, then did and pre- and post-improvement project. Again, this Korean lab is exceeding the WG-LEPS performance specifications in all the measured indicators. And also we see the total improvement from 4,243 defects per million in the pre-improvement phase down to 3,184 defects per million post-improvement across all indicators. This is only a 0.1% improvement in performance. Again, for the amount of effort expended by the laboratory, the return on investment is quite small.
This is not to say that no improvement efforts should be made at the pre-analytical phase, nor should we relax our vigilance in attempting to sustain the gains made over the last 20 years. Certainly there have been major improvements due to barcoding, electronic test requesting, and automation, but beyond those gains we are simply running out of room to get better. Given the significant errors we continue to see in the analytical phase, we may get a much better improvement by spending more effort there.
Of course, it's not appropriate to assume that the pre-analytical quality of laboratories worldwide is all the same. We can glance at some other studies from the less-developed world:
Pre-analytical Errors at the Chemical Pathology Laboratory of a Teaching Hospital Biochemistry Section, Marlene A Tapper, James C Pethick, Lowell L Dilworth, Donovan A McGrowder, Journal of Clinical and Diagnostic Research. 2017 Aug, Vol-11(8): BC16-BC18
This is performance observed at what we would consider a small hospital in the West Indies.
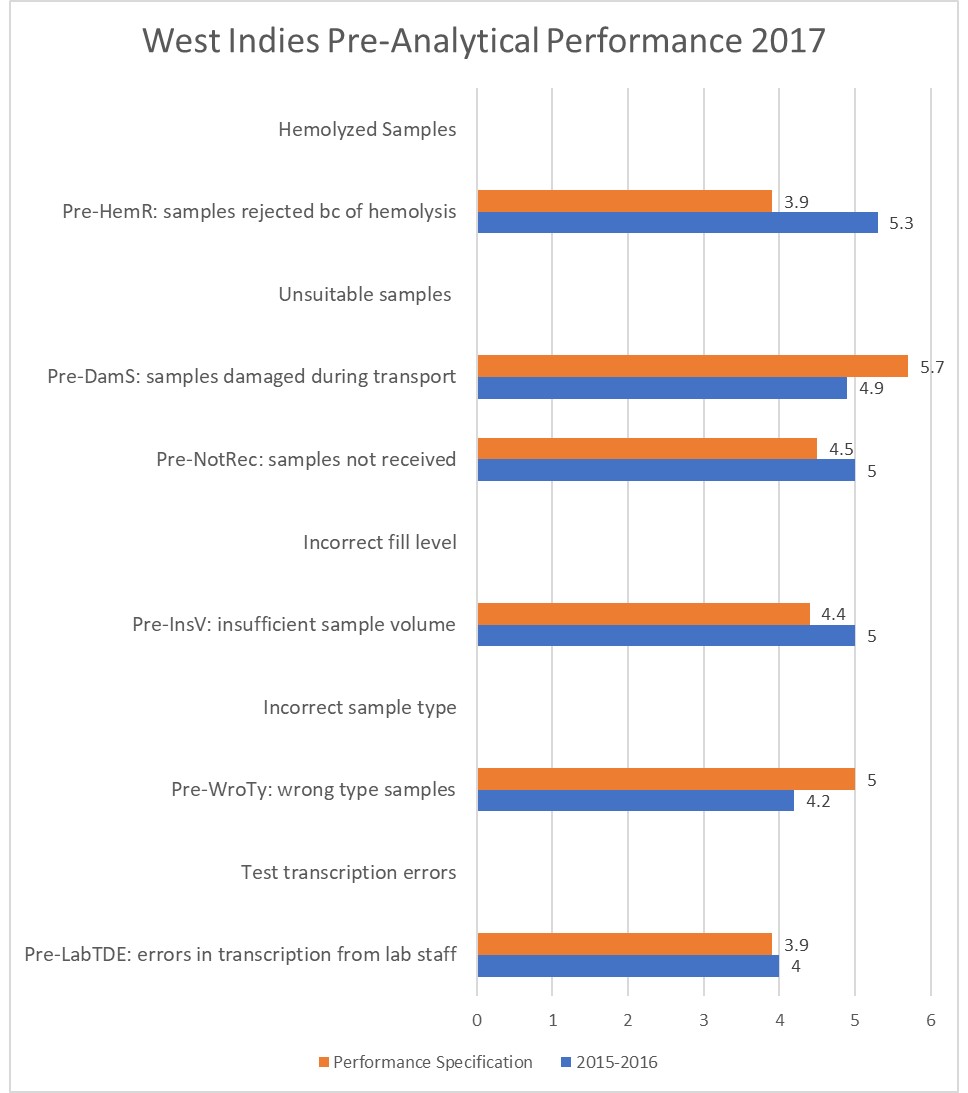
Out of 6 indicators highlighted here, just 2 of them are falling short of WG-LEPS performance specifications. But curiously, there are some performance metrics listed here that are much better than what the other studies have recorded.
Finally, here's a look at one of the better institutions in India, the All India Institute of Medical Sciences (AIIMS), in Raipur:
Congruity in Quality Indicators and Laboratory Performance, Suprava Patel,Rachita Nanda, Sibasish Sahoo, and Eli Mohapatra, Indian J Clin Biochem. 2018 Jul; 33(3): 341–347. Published online 2017 Aug 5. doi: 10.1007/s12291-017-0687-9.
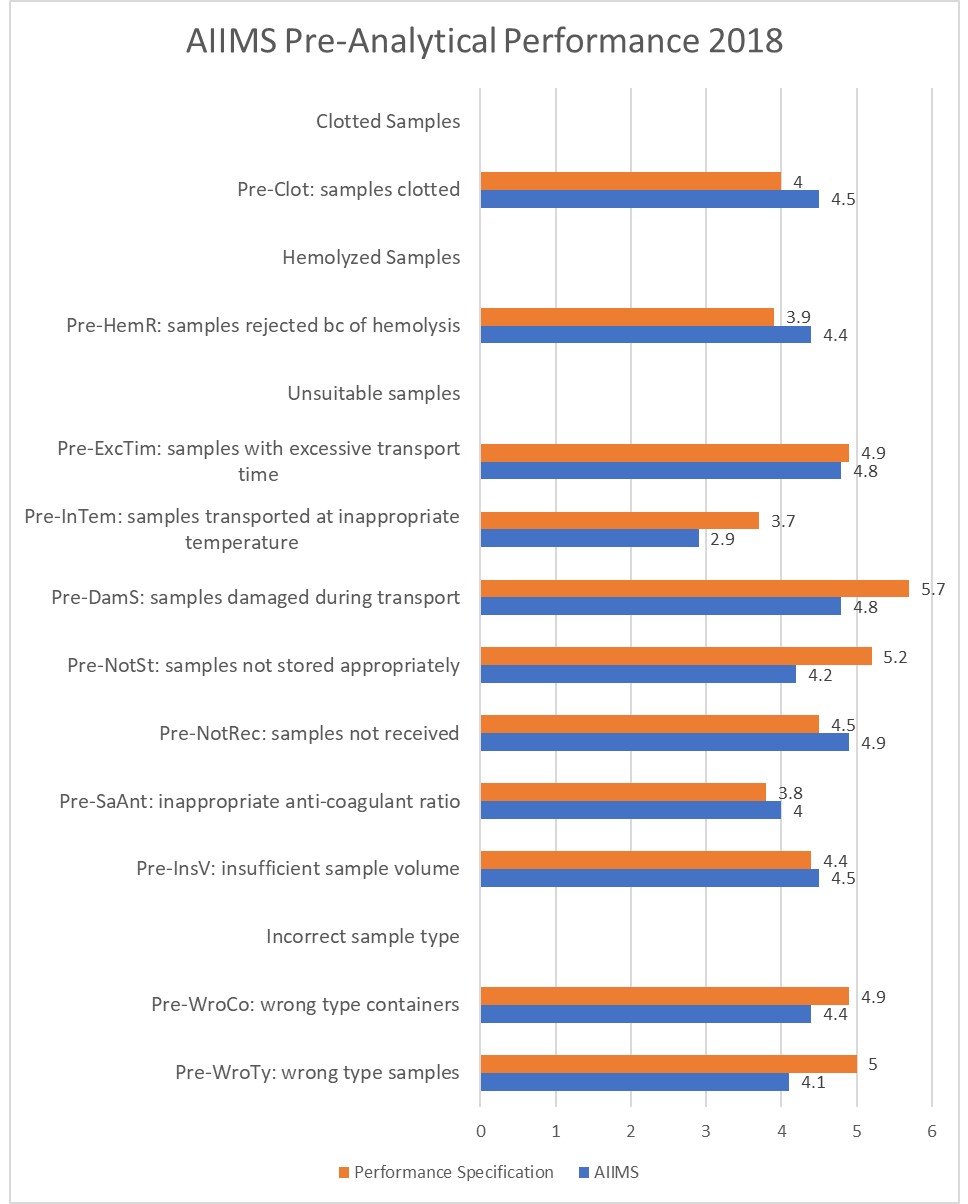
Out of 11 indicators, only 5 of them are able to meet the WG-LEPS performance specifications.
From this brief survey, we see quite a bit of consistently good performance, truly an improvement over the metrics first measured by Nevelainen et al in the first paper using Six Sigma metrics back in 2000. Laboratories have improved significantly, but there are some labs that need to make better efforts. Other labs are getting close to reaching their "peak performance", where increasing effort will only yield diminishing returns. For major progress, labs may want to change their focus back to the analytical phase.