Basic QC Practices
2025 Great Global QC Survey Results: The whole world
In 2025, the Westgard Great Global Survey assessed the state of QC practices.
The 2025 Global QC Survey Results: Quality is getting more out-of-control
Sten Westgard, MS
August 2025

[This survey was completed with the support and partnership of Thermo Fisher MAS controls.]
In 2025, have QC practices around the world improved or declined?
We surveyed laboratories in 2017 and 2021 about their quality control practices. We did it again in 2025.
We got over 1,280 responses, which break down as follows:
- Africa 118 responses
- Asia 289 responses (note that we include everywhere from India to Australia within this group)
- Europe 143 responses
- Latin and South America 114 responses
- Middle-east 146 responses
- United States and Puerto Rico 440 responses
Asia: 2025 Great Global QC Survey Results: Asia Breakout - Westgard QC
Europe: The 2025 Great Global QC Survey: Europe in isolation - Westgard QC
Middle-East: 2025 Great Global QC Survey Results: Middle East - Westgard QC
Latin and South America: 2025 Great Global QC Survey Results: South and Latin America - Westgard QC
Africa: 2025 Great Global QC Survey Results: Africa - Westgard QC
USA: https://westgard.com/qc-applications/basic-qc-practices/2025-qc-survey-usa.html
All of it together: https://westgard.com/qc-applications/basic-qc-practices/2025-global-qc-survey.html
The demographics of the participants
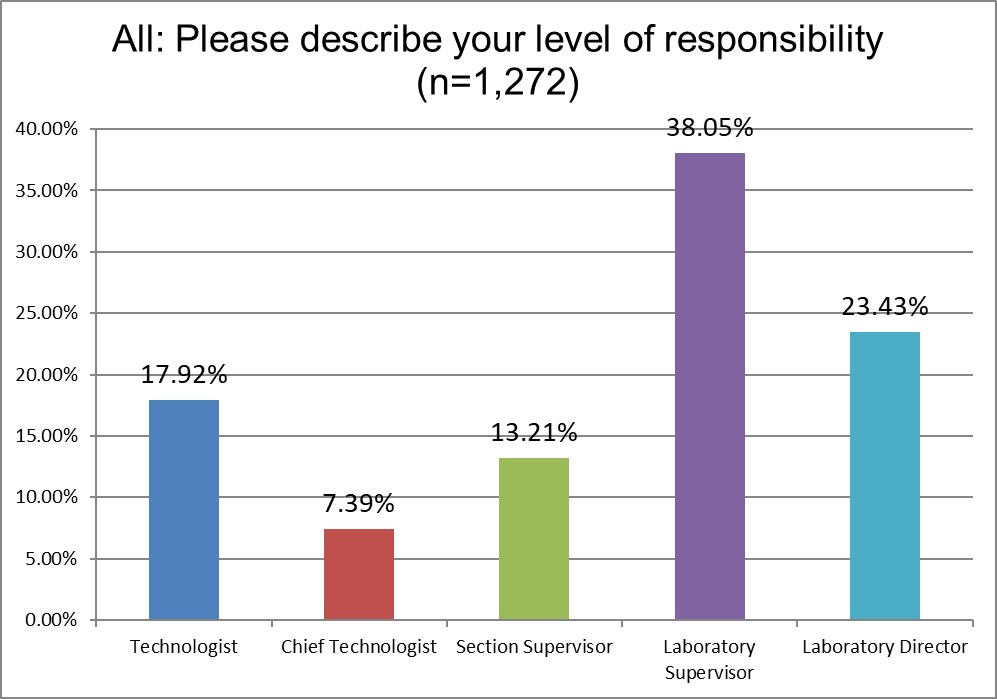
We saw in increase in the responses from supervisors and directors, a decrease in the number of responses from technologists.
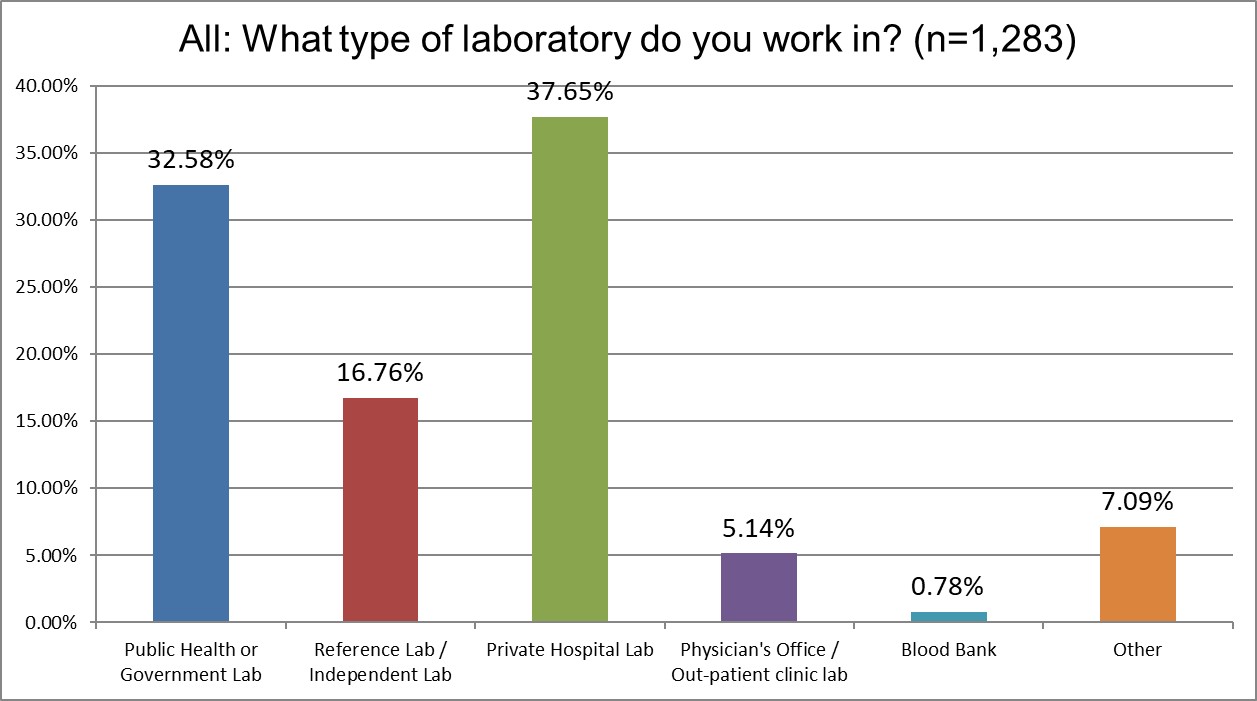
Partly because there were more US participants, the share of private hospitals went up. And the percentage of public labs went down.
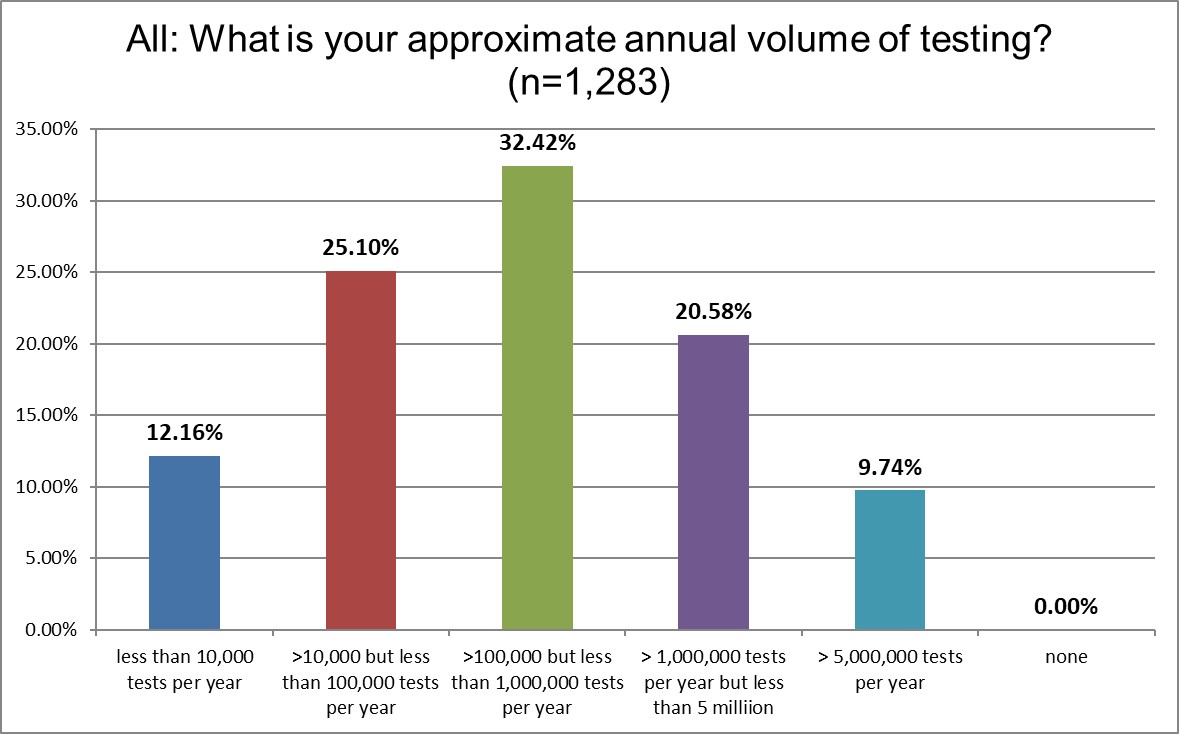
The share of those filling out the survey was fairly consistent from 2021 to 2025. For example, the share of mega-labs (>5mm tests a year) was 8.89% in 2021, and 9.74% in 2025.
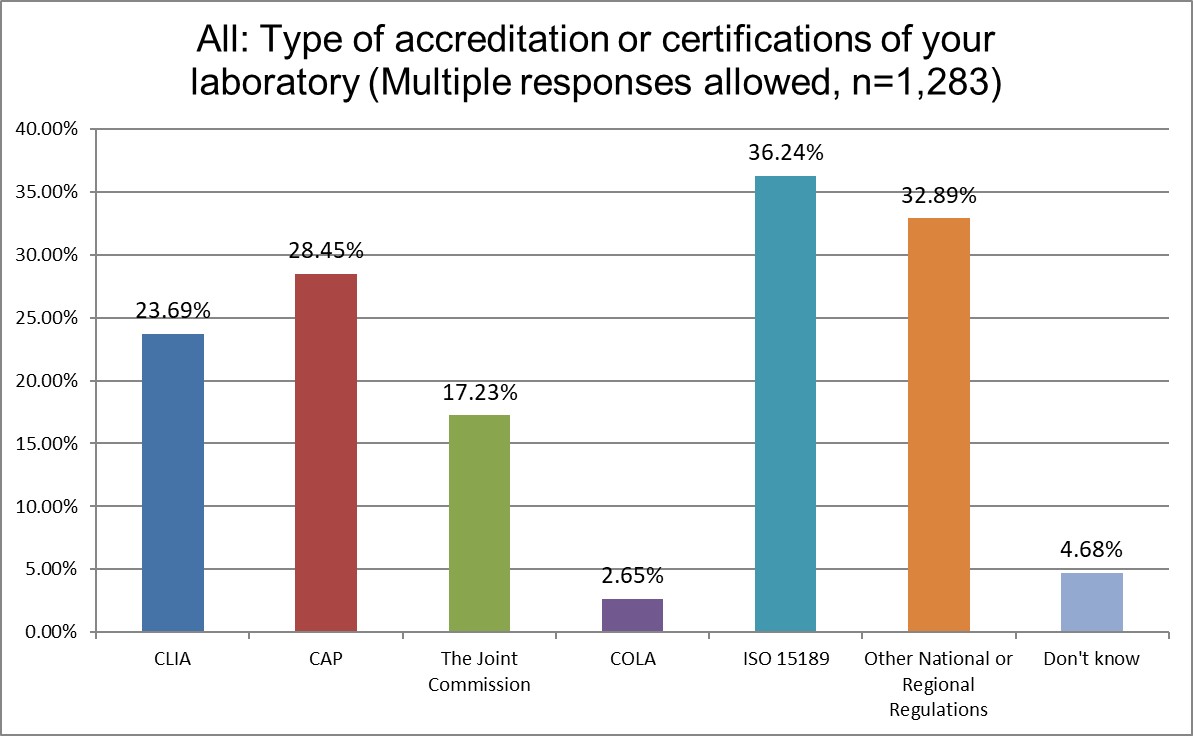
The share of labs with CLIA accreditation rose from 16 to 23%, CAP from 22% to 28%, TJC from 14% to 17%. This reflects the larger share of US labs participating in the survey. Interesting, 38% of labs were ISO 15189 in 2021, now they are down to 36% in 2025.
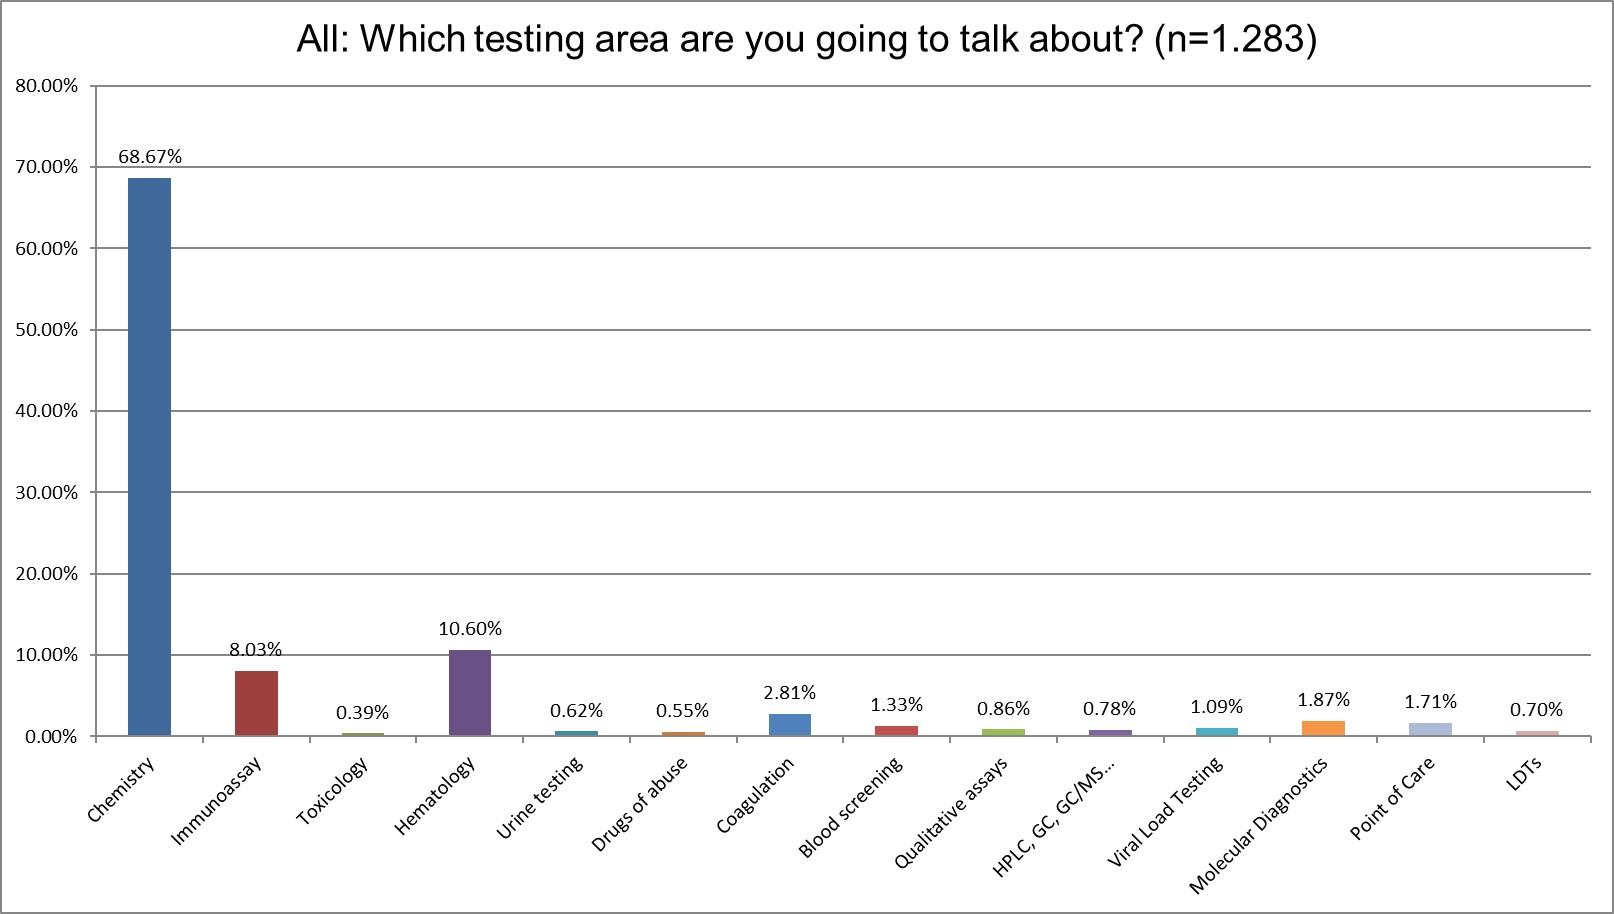
The vast majority of the survey reponses focus on chemistry testing, even more so than in 2021. In 2021, 56% of the responses were focused on chemistry. In 2025, it's 68%. So the results are very chemistry-centric. We will in fact break that out exclusively in a future analysis. We'll also be able to break out the immunoassay and hematology responses as well.
The QC Set Up
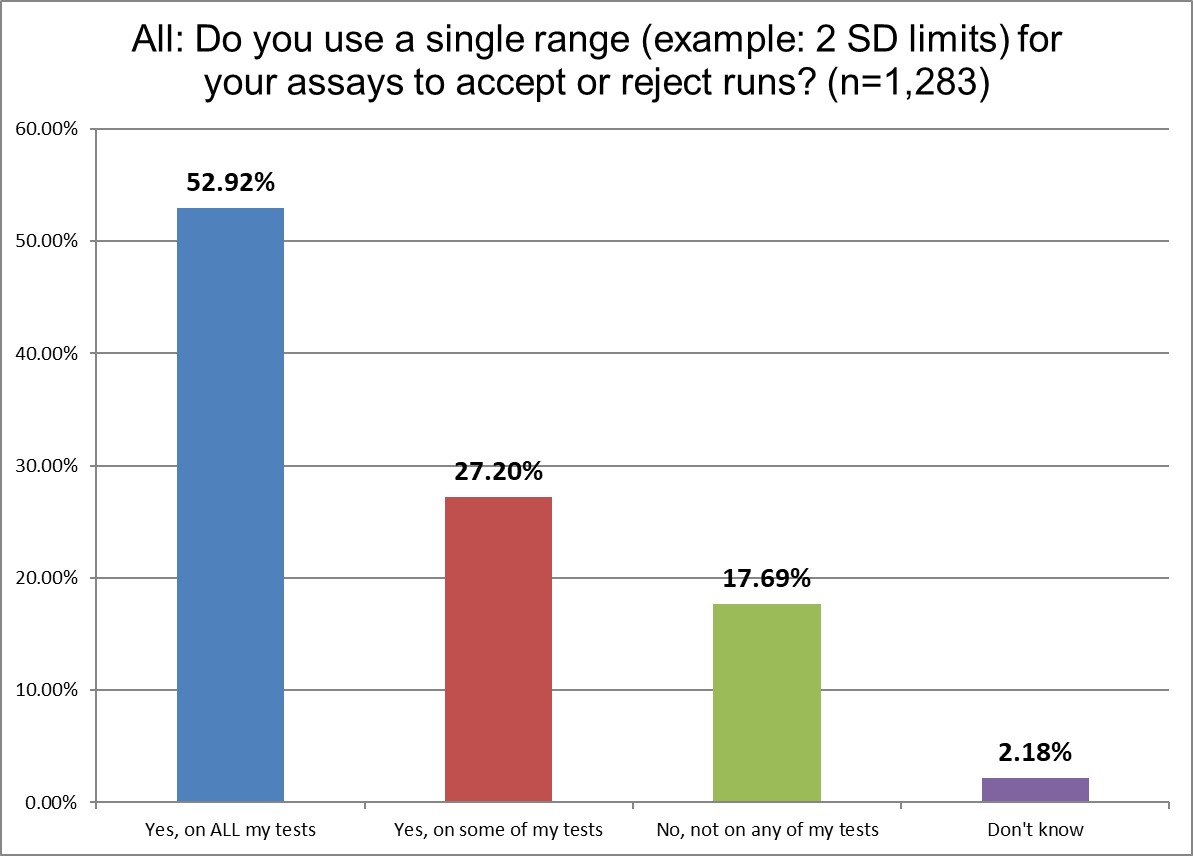
The use of 2 SD on all testing has declined from 59% to 52%. The overall use of 2 SD (all + some) also declined from 85% to 80%. That's probably significant, if small. This decline is not nearly as large as we hoped nor as fast as we've hoped. This global decline is in contrast to the US, where the use of 2 SD has actually increased.
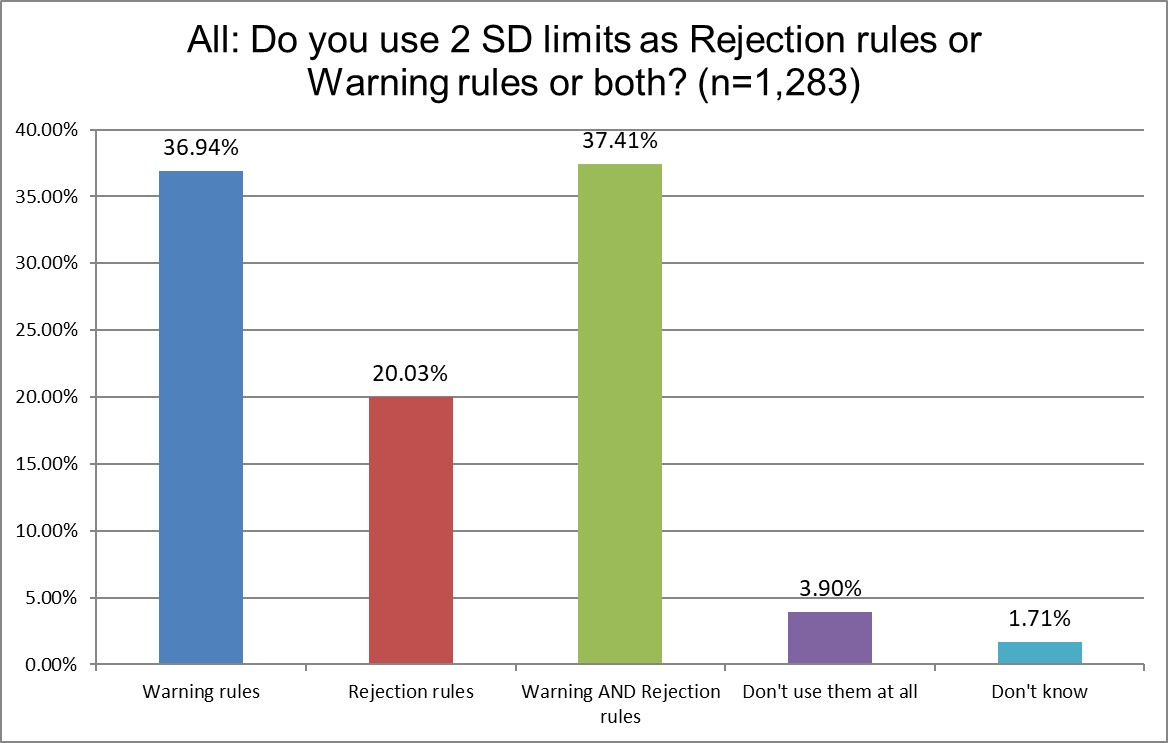
This is a new question we asked for the 2025 survey, so we don't have a prior result to compare it to. The use of 2 SD limits is often justified because it's only used as a warning. But the data tells us that a majority of labs are using 2 SD for rejection rules or both warning and rejection rules. That means the false rejection rate is not being balanced out by being ignored. As we will see later, these practices feed into high repeat rates for controls.
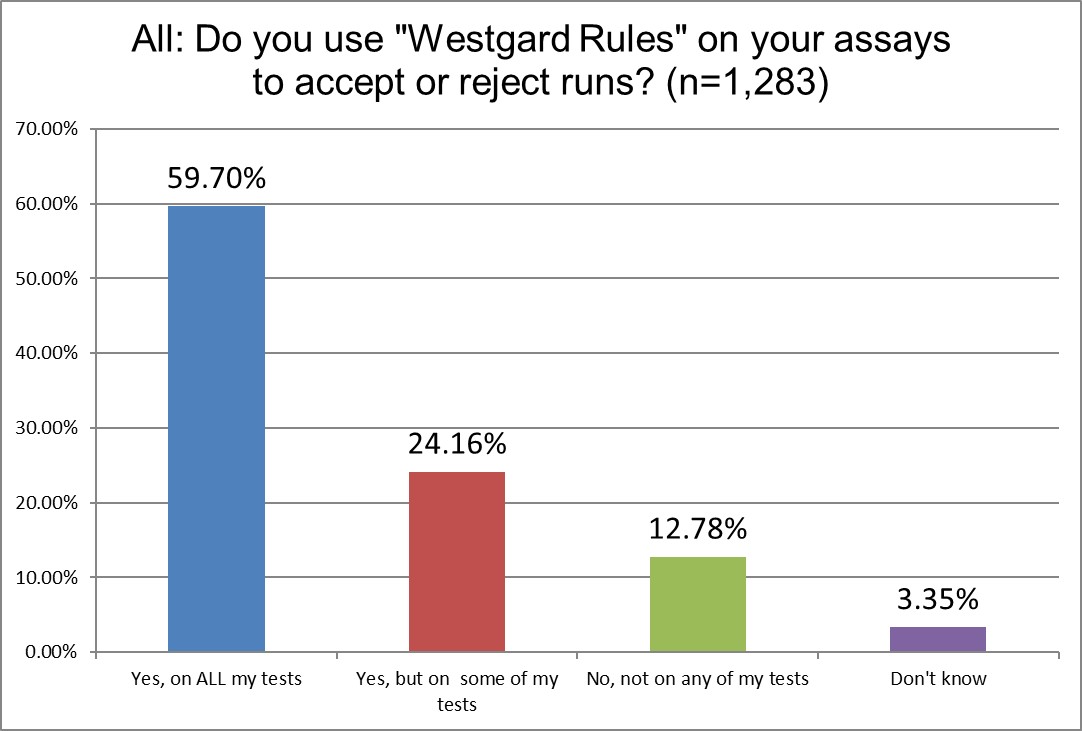
"Westgard Rules" are still in use in over 83% of laboratories, which has slightly declined from 86% in 2021. Since we've been actively recommending a more strategic (and selective) use of Westgard Rules since 1992, this is not an unexpected or unwelcome development.
.
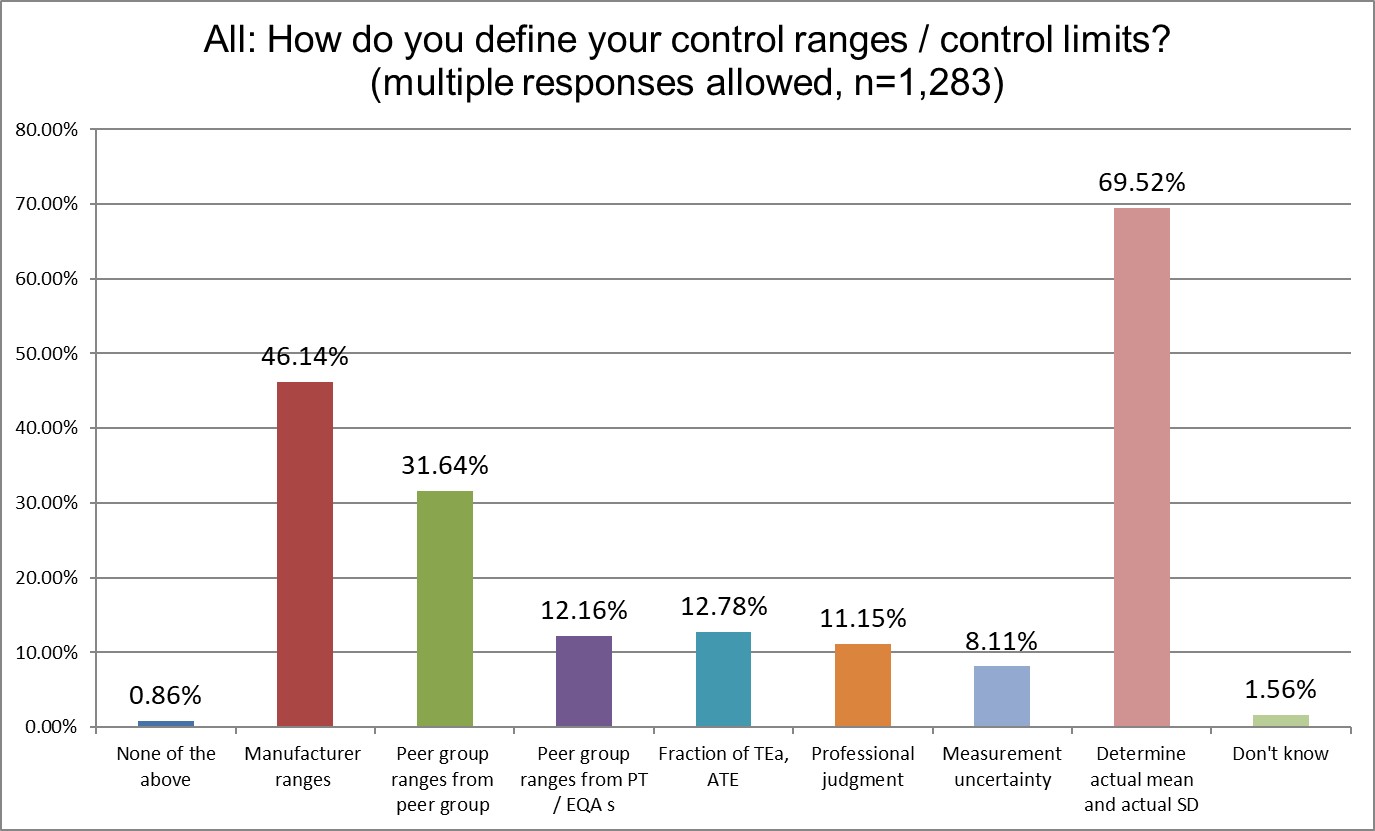
Happily, we see that the use of actual mean and SD has increased from 58% (2021) to almost 70%. Also a decrease in the use of manufacturer ranges from 56% (2021) to 46% is pretty significant. However, the use of peer group ranges also increased from 24% (2021) to 31%, which is not so positive.
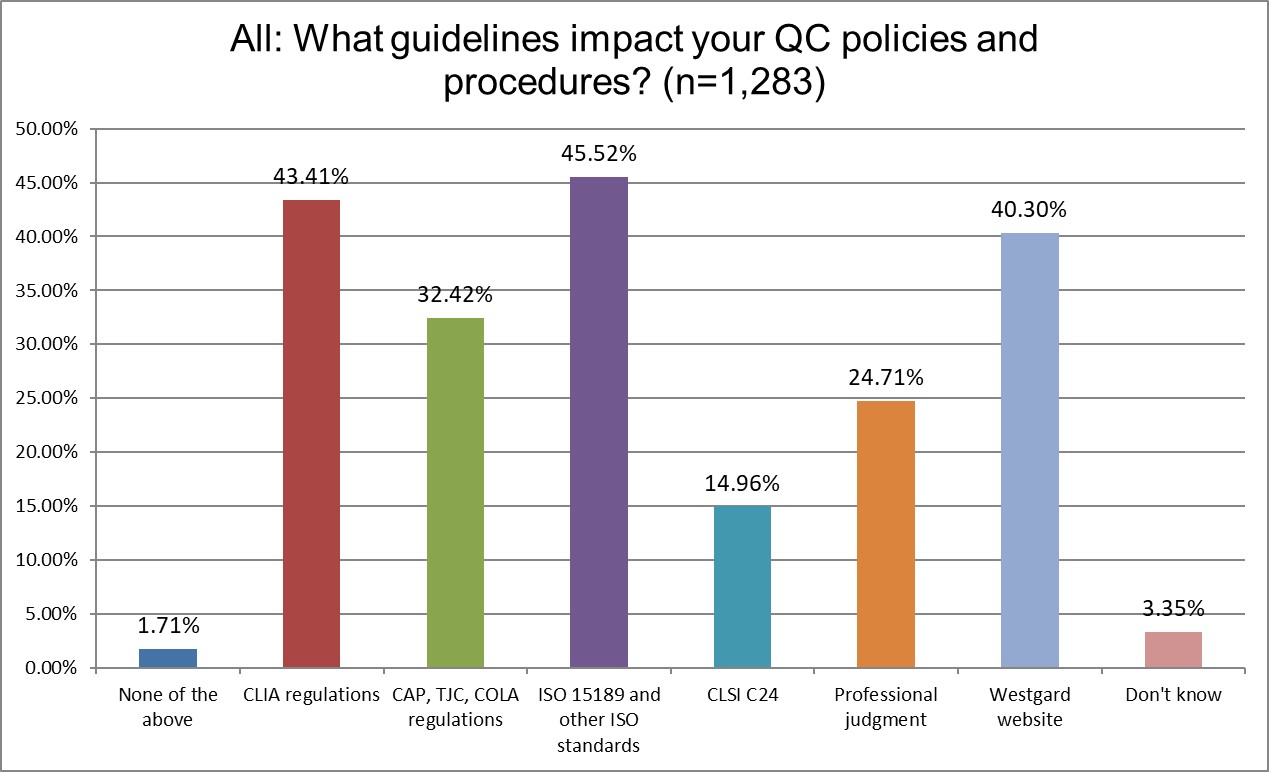
The greatest influence on QC comes from ISO 15189, with CLIA coming in second place. The most specific advice on QC, CLSI C24, has influenced only about 15% of the labs responding to the survey.
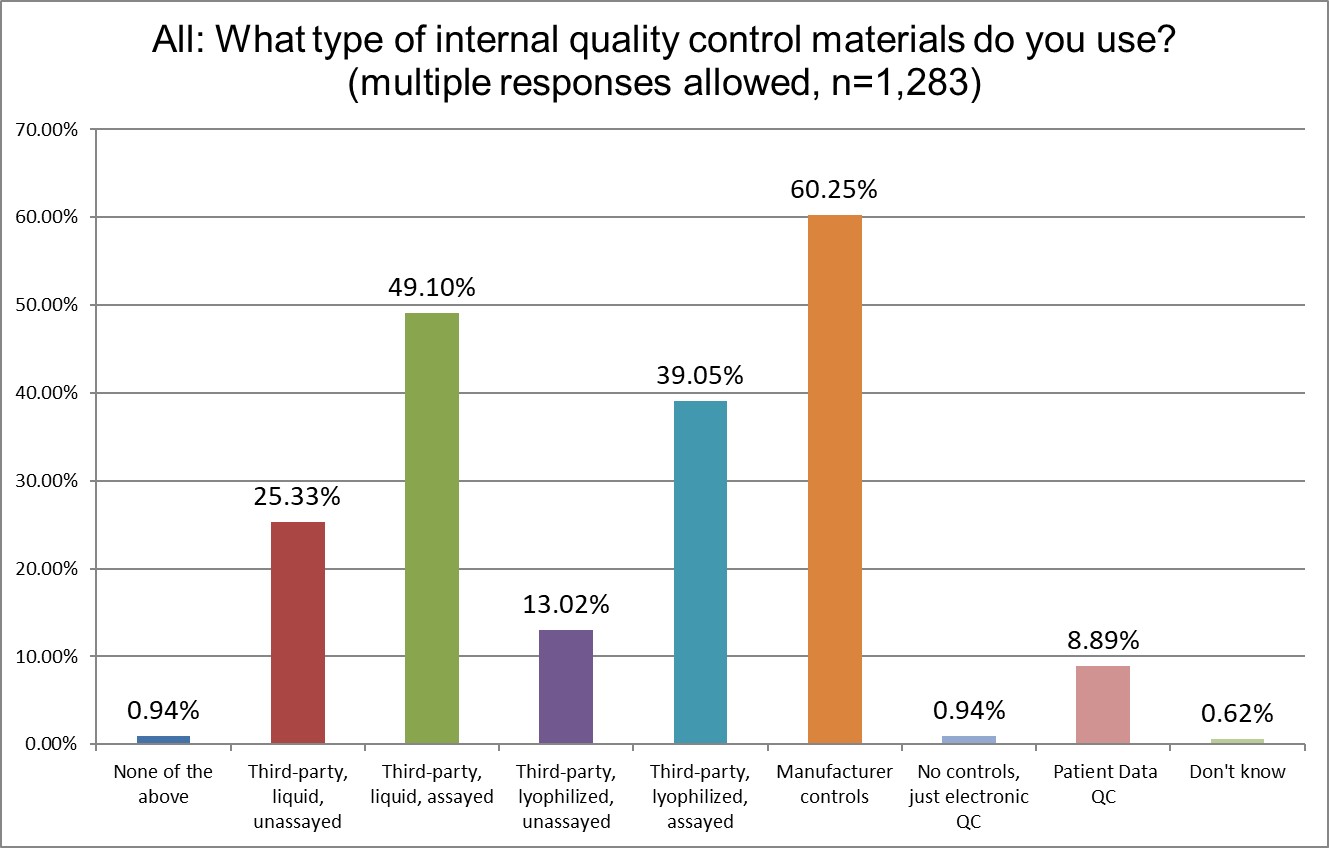
The use of 3rd party liquid, unassayed has increased from about 20% in 2021 to 25% in 2025. 3rd party liquid, assayed controls had a slightly larger increase, from 43% to 49%. The use of manufacturer controls has declined from 66% to 60%, another modest move toward best practices. Patient data QC, however, has declined from 13.67% in 2021 down to 8.89% in 2025.
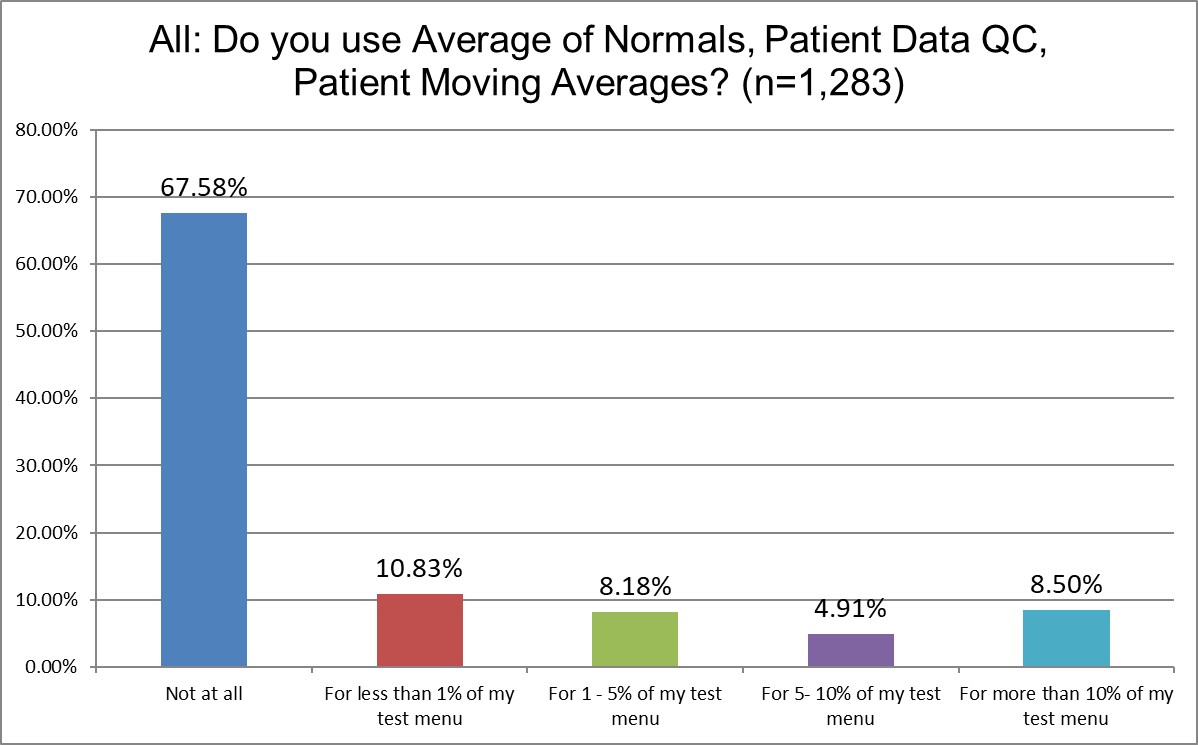
The percentage of labs not using patient data QC has increased from 62% in 2021 to 67.6% in 2025. In 2021, about 14.5% of labs said they used patient data QC for a significant part of their menu. In 2025, that's declined to 8.5%. The hype of patient data QC might be dissipating.
The Real Practice of Running Controls
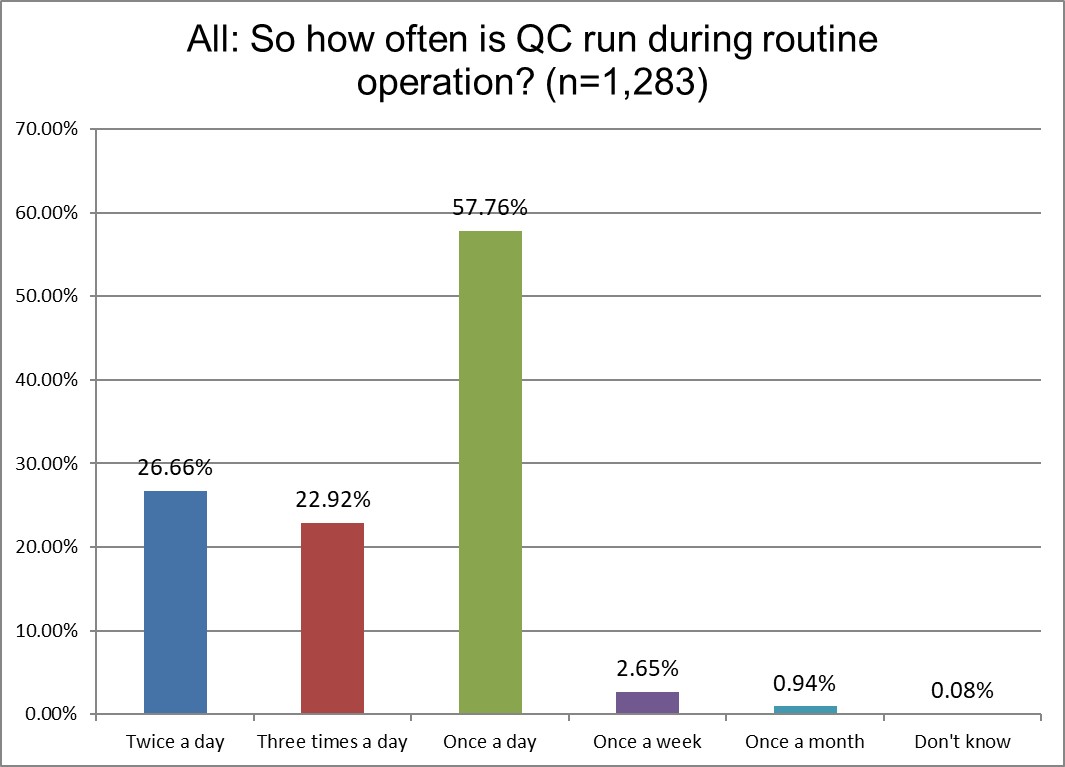
Running once a day QC increased from 53.6% in 2021 to 57.8% in 2025. Yet running QC 3x a day also increased from 19.6% to 22.9%. Running QC 2x a day is nearly the same.
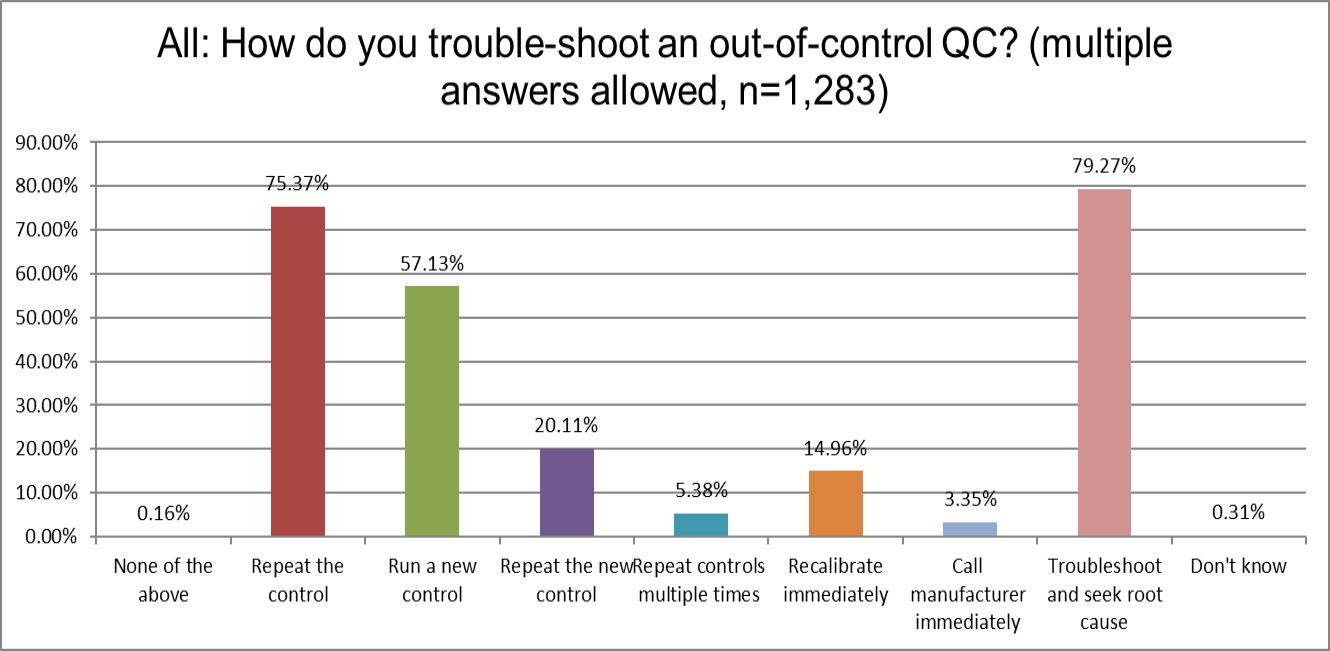
Interestingly, the percentage of labs repeating the control has increased (68% in 2021, now 75% in 2025).
Slightly more labs will run a new control after that (57% in 2025 vs. 55% in 2021). More labs will repeat the new control 20% 2025 vs 16% in 2021. Over 5% of labs now say they keep repeating as much as necessary to get "in" - vs. 3.7% in 2021.
There was also an increase in the number of labs stating they will troubleshoot and seek root cause (as they rightly should) before repeating. It was about 765 in 2021, now its 79% in 2025. Since we allowed multiple responses, that increase doesn't preclude the other increases.
More and more repeats, definitely putting more and more money into the control vendors pockets. Not sure if this is appropriately serving the cause of better quality.
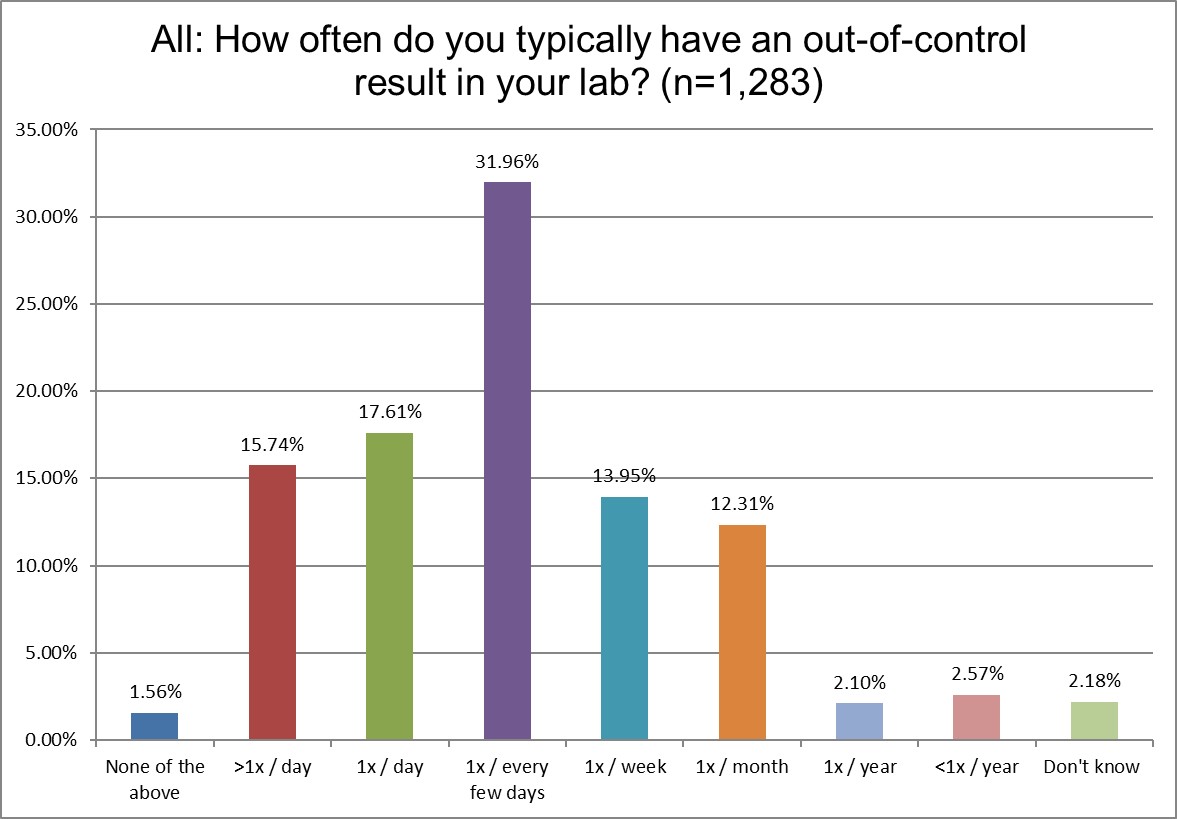
An even more disturbing finding in our survey is that labs are experiencing significantly more oocs (out-of-control events) than ever before.
In 2021, 10.9% of labs said they were ooc more than once a day. Now that's 15.7% in 2025. In 2021, 11.9% of labs said they were ooc once day. Now that's 17.6%.
This adds up to a major increase in out of control episodes. In 2021, 22.7% of labs were ooc every day and multiple times per day. In 2025, it's 33.3%.
Let's restate that: one third of global labs are out of control every day.
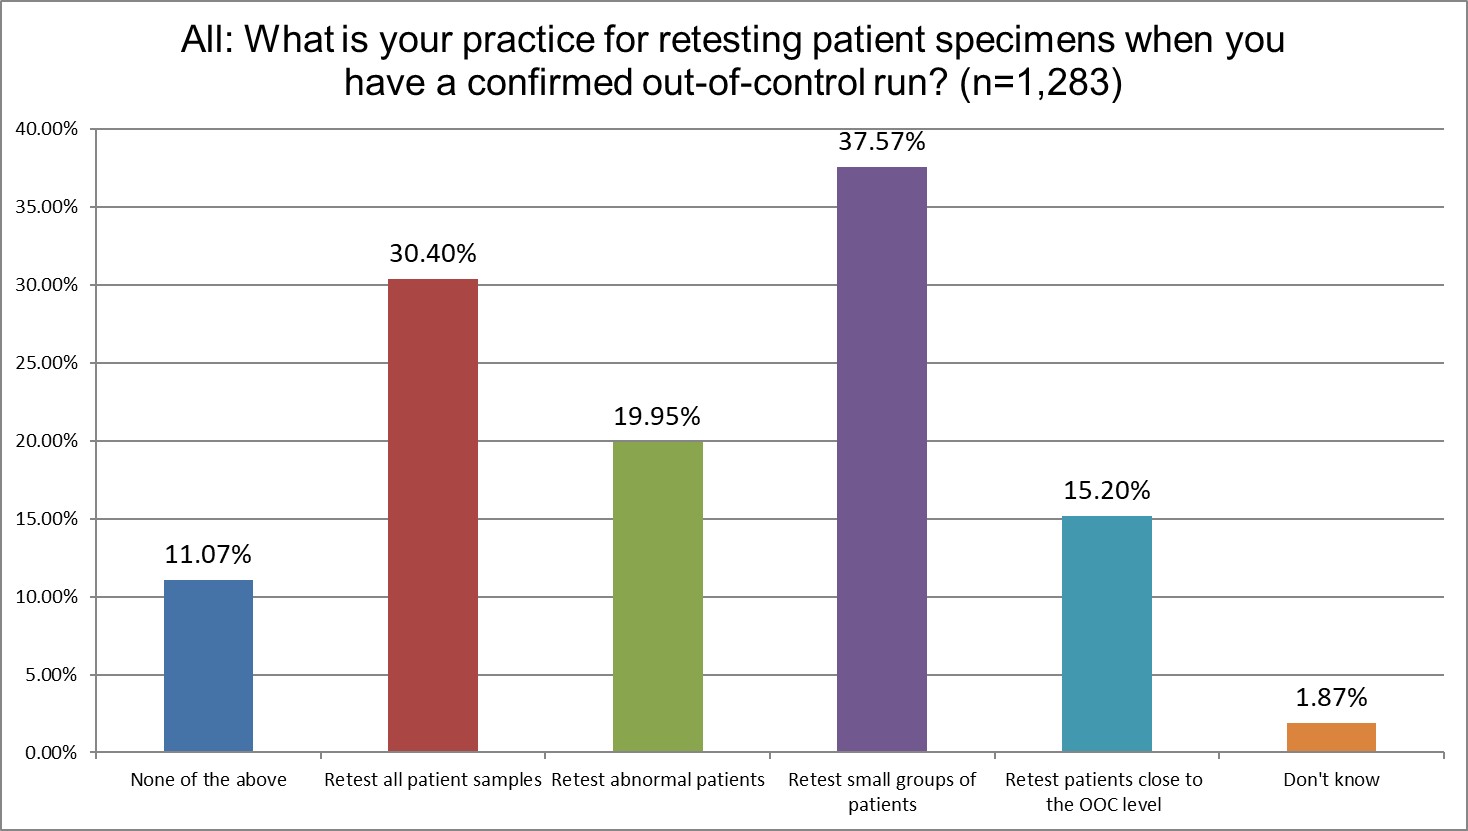
A little bit less than a third of labs will retest all patient samples when there is an out of control run. The retesting of small groups of patients has increased from 30% in 2021 to 37% in 2025. That's the most significant change in practices.
The good news is that the number of labs that send out test results even when there's an out of control run has declined. In 2021, over 10% of labs said they did this on a regular basis (daily and weekly). In 2025, that's now down to 6.9%.
The Final Overview
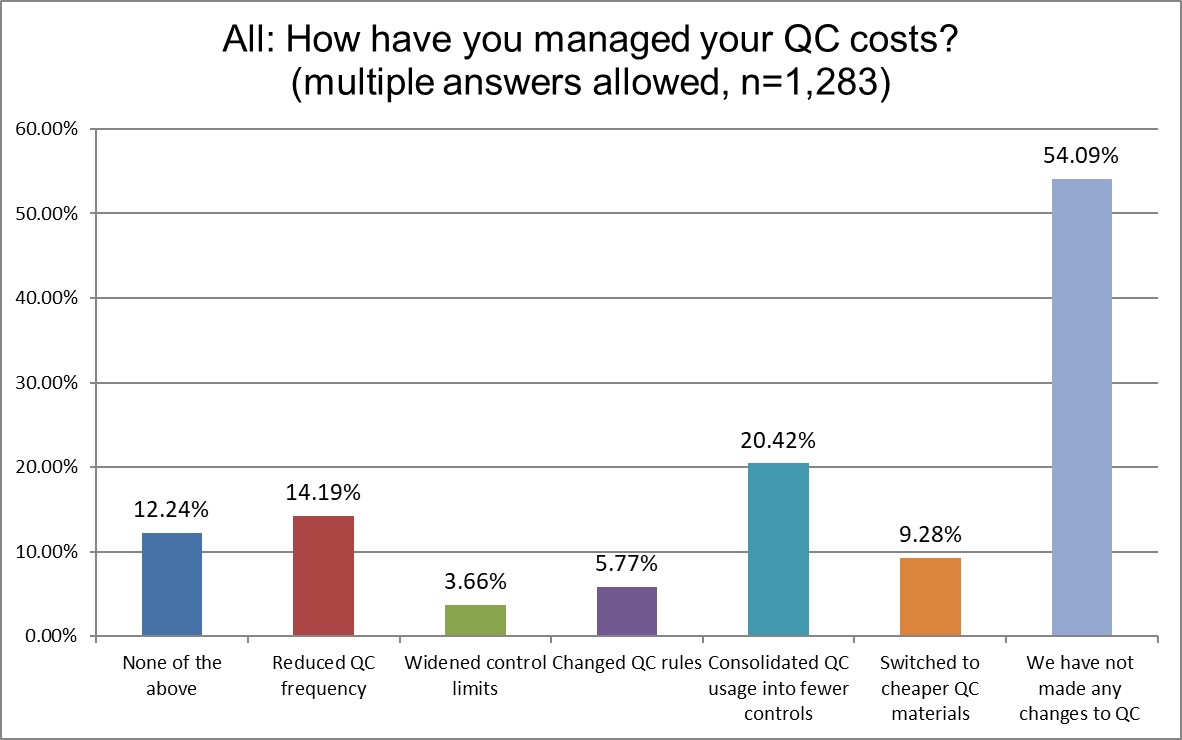
More labs have addressed their QC costs since 2021. In our previous survey, 64% of labs said they hadn't done anything. In 2025, it's now 54%. More labs have consolidated QC into fewer controls, (from 13% in 2021 to 20% in 2025). In 2021, 6% of labs switched to cheaper controls, now that's 9%. Curiously, the number of labs that have changed QC rules declined from 7.7% in 2021 to 5.7% in 2025.
Still, for all this progress, a majority of labs around the world have still done nothing to change how they do QC and how much they spend on it.