Sigma Metric Analysis
A Dimension EXL in Ethiopia
A study looked at the Sigma metrics across all three phases of the total testing process in a specialized hospital in Ethiopia. An interesting look at performance outside the usual setting.
Sigma metrics across the Total Testing Process at Dessie Comprehensive Specialized Hospital
December 2025
Sten Westgard, MS
A recent study from the Dessie Comprehensive Specialist Hospital in Ethiopia looked at Sigma performance across the total testing process, as well as analytical Sigma metrics of a Dimension EXL:
Performance Analysis of Clinical Chemistry Laboratory Using Sigma Metrics in the Total Testing Process at Dessie Comprehensive Specialized Hospital, Ethiopia. Multaie Z, Ebrahim E, Alebachew M, Gedefie A, Eshetu B, Tilahun M, Debash H, Kassa Y, Alemayehu E, Gessese T. Journal of Clinical Laboratory Analysis 2025;0;e70134
https://doi.org/10.1002/jcla.70134
Pre-analytical phase Sigma performance, Ethiopia
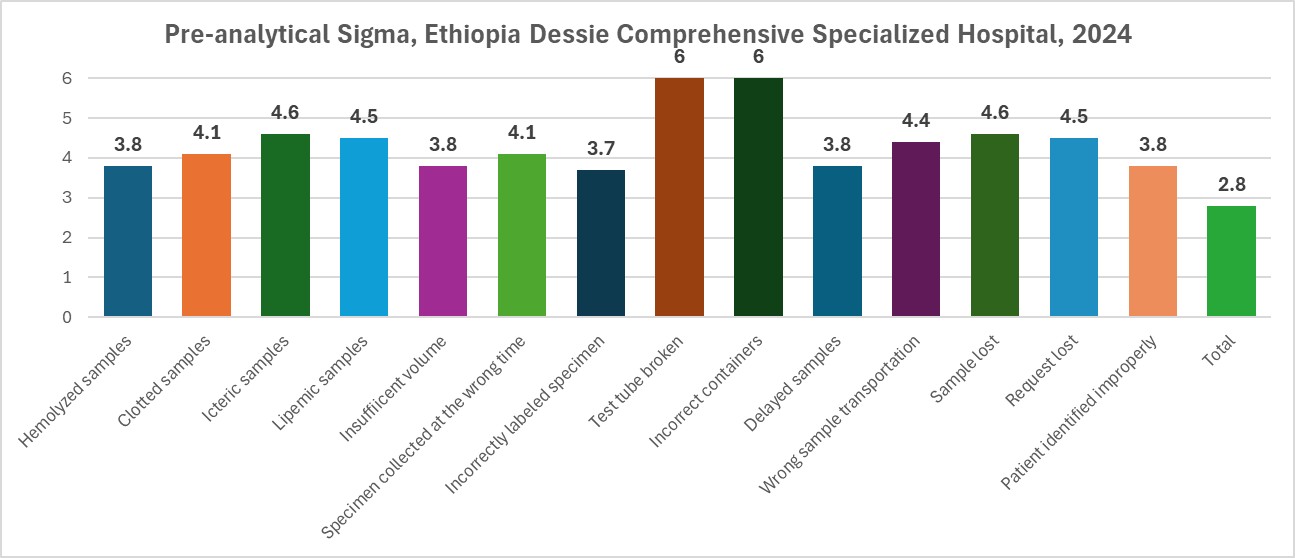
Some of the individual metrics are good, but the Sigma for the whole pre-analytical phase (total) is below 3.
Analytical phase Sigma-metrics, Ethiopia

The worst performance in the analytical phase comes from missing scheduled maintenance and releasing non-linear results, but overall the analytical phase scores 3.5 Sigma.
Post-analytical phasse Sigma-metrics, Ethiopia
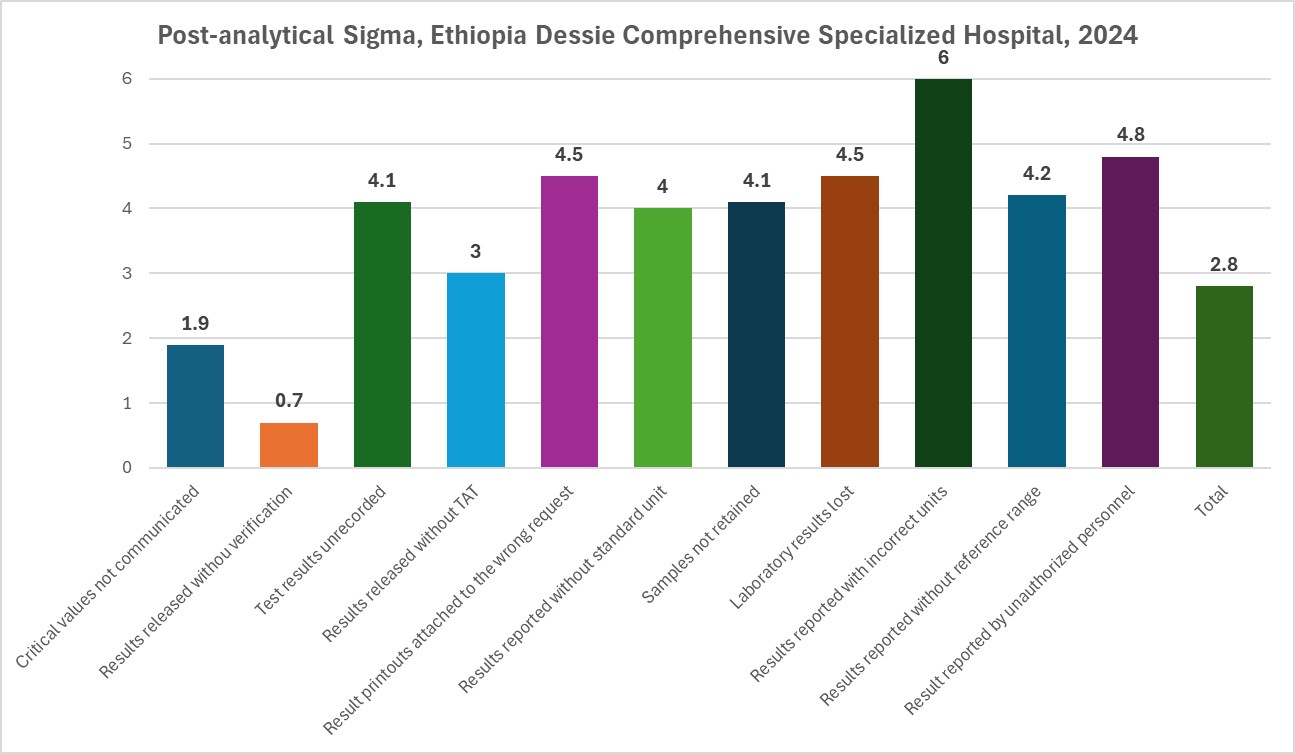
This lab appears to release results without verification quite often, resulting in a below 1 Sigma performance. Overall, the post-analytical phase is below 3 Sigma.
Overall, the only phase that is above 3 Sigma is the analytical phase. However, we're going to challenge that bit of good news by looking more closely into the test by test performance of the chemistry instrument, a Dimension EXL.
Calculating Sigma metrics from routine laboratory performance data
Unfortunately, the authors made a mistake in calculation of the analytical Sigma metric, where they didn't use the absolute bias, but instead retained it's sign. When this kind of error is made, a negative bias will have it's sign reversed, and suddenly the TEa is larger, not smaller in the Sigma metric equation. That means in a few cases, the Sigma metrics are higher than they should be. Our analysis here makes the correct use of bias (always absolute, never increasing TEa), but in addition we will be applying CLIA 2025 goals, not the CLIA 1992 goals.
| Test | TEa Source | TEa | % Bias | % CV | Sigma |
| Albumin | CLIA 2025 | 8 | 10.4 | 3.59 | negative |
| Albumin | 8% | 8 | 10.4 | 4.57 | negative |
| Alk Phos | CLIA 2025 | 20 | 1.5 | 4.79 | 3.87 |
| Alk Phos | 20% | 20 | 1.5 | 4.26 | 4.35 |
| ALT | CLIA 2025 | 15 | 1.4 | 4.45 | 3.06 |
| ALT | 6 U/L or 15% | 15 | 1.4 | 4.04 | 3.37 |
| AST | CLIA 2025 | 15 | 6.5 | 3.46 | 2.44 |
| AST | 6 U/L or 15% | 15 | 6.5 | 3.25 | 2.60 |
| Bilirubin, Direct | Ricos 2014 Desirable | 44.5 | 20.3 | 21.12 | 1.14 |
| Bilirubin, Direct | 44.50% | 44.5 | 20.3 | 7.68 | 3.15 |
| Bilirubin, Total | CLIA 2025 | 20 | 6.0 | 6.73 | 2.08 |
| Bilirubin, Total | 20 | 6.0 | 2.14 | 6.54 | |
| Chloride | CLIA 2025 | 5 | 4.8 | 2.59 | 0.07 |
| Chloride | 5% | 5 | 4.8 | 1.91 | 0.09 |
| Cholesterol | CLIA 2025 | 10 | 6.6 | 3.4 | 0.99 |
| Cholesterol | 10% | 10 | 6.6 | 3.84 | 0.88 |
| Creatinine | CLIA 2025 10% or | 10 | 1.4 | 3.63 | 2.37 |
| Creatinine | 0.2 mg/dL | 10 | 1.4 | 2.08 | 4.13 |
| Glucose | CLIA 2025 8% or | 8 | 0.6 | 3.19 | 2.32 |
| Glucose | 6 mg/dL | 8 | 0.6 | 3.64 | 2.03 |
| HDL | CLIA 2025 | 20 | 17.0 | 6.4 | 0.47 |
| HDL | 6 mg/dl or 20% | 20 | 17.0 | 3.2 | 0.95 |
| LDL | CLIA 2025 | 20 | 5.2 | 5.85 | 2.53 |
| LDL | 20% | 20 | 5.2 | 4.57 | 3.24 |
| LDH | CLIA 2025 | 15 | 2.7 | 3.64 | 3.38 |
| LDH | 15% | 15 | 2.7 | 2.4 | 5.13 |
| Potassium | CLIA 2025 | 8.05 | 2.4 | 2.47 | 2.30 |
| Potassium | 0.3 mmol/L | 8.05 | 2.4 | 1.66 | 3.43 |
| Protein, Total | CLIA 2025 | 8 | 2.9 | 1.42 | 3.61 |
| Protein, Total | 8% | 8 | 2.9 | 2.43 | 2.11 |
| Sodium | CLIA 2025 | 2.85 | 1.2 | 1.69 | 0.99 |
| Sodium | 4 mmol/L | 2.85 | 1.2 | 1.05 | 1.59 |
| Triglycerides | CLIA 2025 | 15 | 0.2 | 2.94 | 5.04 |
| Triglycerides | 15% | 15 | 0.2 | 3.45 | 4.29 |
| Urea Nitrogen | CLIA 2025 | 9 | 0.8 | 7.86 | 1.04 |
| Urea Nitrogen | 2.0 mg/dL or 9% | 9 | 0.8 | 6.73 | 1.22 |
| Uric Acid | CLIA 2025 | 10 | 2.3 | 2.06 | 3.72 |
| Uric Acid | 10% | 10 | 2.3 | 1.53 | 5.01 |
As the table shows, there are a lot of metrics below Three Sigma. To be precise, 57% of the performance is below 3 Sigma. The majority of this platform would be considered unacceptable by CLIA 2025 standards.
Graphic Display of performance by Normalized Method Decision Chart (NMEDx)

Only one level of this instrument achieves 6 Sigma. In order to properly QC this instrument, pretty much all the Westgard Rules need to be used on pretty much all the tests. Even then, the lab would be well advised to use calculations like the Critical Difference, or Reference Change Value, to help clinicians sift out the patient's signal from the laboratory's noise.
Conclusion
It's very hard to look at this performance, at any phase of the total testing performance, and not feel a sense of tragedy. Challenges in the developing world are hard enough, but even in the best hospitals, there are serious errors occurring. The performance here is a world apart from what we see in the Europe, USA, and other advanced economies. Modern instruments, in different countries, can behave very differently.