
Sigma Metric Analysis
Sad about your Sigma metrics? Simple steps to improve
Once you've calculated your Sigma metrics, your fate is not set in stone. Simple steps can help you dramatically improve the quality. An example of the HumaStar 600 in India shows us how.
Sad about your Sigma metrics? Simple steps can improve your quality
November 2026
Sten Westgard, MS
[Sigma score: long-term imprecision: +0.5; Manufacturer controls: 0; long-term bias: +0.5; bias from EQA: +1. Final Score: 2. Optimistic quality data. ]
A recent study assessed a new biochemistry analyzer - the HumaStar 600 - using Sigma metrics, then did something shocking. They made changes to improve their performance. A year later, their Sigma metrics were higher, not because they changed their instrument, but because they changed how they operated the instrument:
Mrityunjoy Halder, Priyanka Datta, Abhra Ghosh, Manthan Dhingra, A prospective study of DMAIC-based six sigma implementation for analytical quality improvement in a clinical biochemistry laboratory. Bioinformation Volume 22(10). Published October 31, 2026. DOI:10.6026/973206300227069
This study used the CLIA 2025 quality goals to the same 20 biochemistry tests, then used QGI to diagnose what issue to try and improve.
Calculating Sigma metrics from routine laboratory performance data.
The imprecision and bias of the analyzers
"IQC data were collected over a 3-month period - for each dataset - July to September for Set 1 [before] and June to August 2025 for Set 2 [after]. Routine QC was scheduled twice daily.... Bias (%), representing systematic error (inaccuracy), was derived from EQA peer group comparison...."
TEa goals were taken from CLIA 2025. The % goals were used at all levels, no unit-based CLIA goals were used.
Here are the Sigma metrics for "Before" state of the HumaStar 600:
| TEST | % Bias | CV | Sigma |
| Albumin | 2.9 | 2.95 | 1.7 |
| Albumin | 2.68 | 2.5 | 2.1 |
| Alk Phos | 3.88 | 6.06 | 2.7 |
| Alk Phos | 5.44 | 5.22 | 2.8 |
| ALT | 1.8 | 3.26 | 4.0 |
| ALT | 4.94 | 2.24 | 4.5 |
| Amylase | 8.05 | 2.82 | 4.2 |
| Amylase | 7.99 | 2.38 | 5.0 |
| AST | 1.54 | 5.28 | 2.5 |
| AST | 1.3 | 3.4 | 4.0 |
| Bilirubin, Total | 3.78 | 5.1 | 3.2 |
| Bilirubin, Total | 3.72 | 4.76 | 3.4 |
| Calcium | 0.63 | 2.17 | 4.3 |
| Calcium | 1.14 | 2.07 | 4.3 |
| Cholesterol | 1.3 | 3.14 | 2.8 |
| Cholesterol | 0.88 | 3.09 | 3.0 |
| Creatinine Kinase (CK) | 5.24 | 5.95 | 2.5 |
| Creatinine Kinase (CK) | 5.07 | 5.72 | 2.6 |
| Creatinine | 1.53 | 4.98 | 1.7 |
| Creatinine | 1.1 | 4.16 | 2.1 |
| Glucose | 0.91 | 2.02 | 3.5 |
| Glucose | 1.31 | 2.15 | 3.1 |
| HDL | 4.21 | 4.92 | 3.2 |
| HDL | 4.86 | 4.35 | 3.5 |
| Iron | 1.27 | 4.8 | 2.9 |
| Iron | 1.39 | 4.32 | 3.2 |
| Lactate | 2.88 | 3.04 | 9.1 |
| Lactate | 1.98 | 3.81 | 7.5 |
| LDL | 2.88 | 3.04 | 5.6 |
| LDL | 1.98 | 3.81 | 4.7 |
| Magnesium | 3.05 | 4.05 | 3.0 |
| Magnesium | 2.93 | 3.82 | 3.2 |
| Phosphorous | 0.79 | 4.28 | 2.2 |
| Phosphorous | 1.1 | 4.05 | 2.2 |
| Protein, Total | 1.6 | 2.5 | 2.6 |
| Protein, Total | 1.39 | 2.43 | 2.7 |
| Triglycerides | 1.35 | 4.24 | 3.2 |
| Triglycerides | 1.48 | 4.2 | 3.2 |
| Urea Nitrogen | 1.03 | 2.71 | 2.9 |
| Urea Nitrogen | 1.14 | 2.36 | 3.3 |
| Uric Acid | 4.37 | 1.72 | 3.3 |
| Uric Acid | 4.11 | 1.62 | 3.6 |
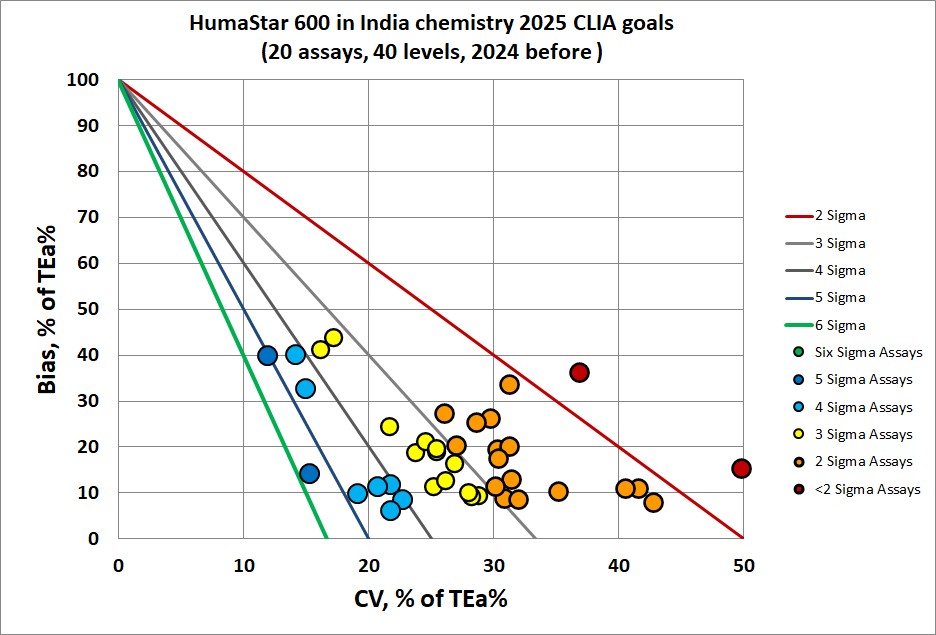
Not looking good, right? Less than 25% of the performance here is 4, 5, or 6 Sigma.
This is where the study does something most don't. They took action to improve their quality. They didn't switch instruments. They invested in better operation of the instrument.
First, they standardized the employee performance:
"As operator-dependent imprecisions were identified as the dominant QGI finding across the panel, different interventions were introduced. These included weekly micro-training sessions covering QC vial reconstitution, Westgard rule interpretation and corrective action documentation; laminated QC startup checklists at each workstation; shift-wise sign-off logs with mandatory corrective action notes; and SOP revision incorporating analyte-specific CAPA flow charts. For analytes persistently below 3 [Sigma], stricter Westgard multirules were applied, using the 1:2s as a warning rule, and the 10x rule for shift detection."
Next, they worked on the instrument:
"Preventive maintenance was decoupled from calendar scheduling and linked instead to sigma review findings, with mandatory claibration verification introduced after every service event. A lot-to-lot verification protocol was implemented for critical analytes, requiring a minmum of 20 parallel runs and sigma recalculation before any new reagenet lot was approved for deployment. QC material handling was standardised through single-use 500 uL aliquots, a 48-hour open-vial discard policy and FEFO reagent rotation. Following a multi-analyte cluster imprecision event, reagent-grade water conductivity monitoring was added to the daily quality indicator checklist."
After these improvements, they found Sigma significantly improved.
| TEST | % Bias | CV | Sigma |
| Albumin | 3.48 | 2.56 | 1.77 |
| Albumin | 2.68 | 2.18 | 2.44 |
| Alk Phos | 3.91 | 4.57 | 3.52 |
| Alk Phos | 5.45 | 5.37 | 2.71 |
| ALT | 1.78 | 2.97 | 4.45 |
| ALT | 2.15 | 2.53 | 5.08 |
| Amylase | 8.04 | 2.39 | 5.00 |
| Amylase | 8.01 | 2.81 | 4.27 |
| AST | 1.54 | 3.57 | 3.77 |
| AST | 1.29 | 3.04 | 4.51 |
| Bilirubin, Total | 2.78 | 3.25 | 5.30 |
| Bilirubin, Total | 2.77 | 3.82 | 4.51 |
| Calcium | 0.62 | 1.95 | 4.81 |
| Calcium | 0.24 | 2.29 | 4.26 |
| Cholesterol | 1.29 | 2.15 | 4.05 |
| Cholesterol | 0.87 | 1.84 | 4.96 |
| Creatinine Kinase (CK) | 5.48 | 2.29 | 6.34 |
| Creatinine Kinase (CK) | 3.24 | 2.69 | 6.23 |
| Creatinine | 1.54 | 2.21 | 3.83 |
| Creatinine | 1.1 | 1.89 | 4.71 |
| Glucose | 0.9 | 1.5 | 4.73 |
| Glucose | 1.31 | 1.76 | 3.80 |
| HDL | 4.2 | 3.01 | 5.25 |
| HDL | 4.63 | 2.57 | 5.98 |
| Iron | 1.62 | 2.46 | 5.44 |
| Iron | 2.31 | 2.89 | 4.39 |
| Lactate | 2.88 | 3.04 | 9.05 |
| Lactate | 1.98 | 3.81 | 7.46 |
| LDL | 2.89 | 2.6 | 6.58 |
| LDL | 2 | 2.22 | 8.11 |
| Magnesium | 1.02 | 2.3 | 6.08 |
| Magnesium | 1.5 | 2.7 | 5.00 |
| Phosphorous | 2.82 | 2.01 | 3.57 |
| Phosphorous | 2.86 | 1.72 | 4.15 |
| Protein, Total | 1.61 | 1.07 | 5.97 |
| Protein, Total | 1.4 | 0.92 | 7.17 |
| Triglycerides | 1.34 | 1.79 | 7.63 |
| Triglycerides | 1.48 | 2.1 | 6.44 |
| Urea Nitrogen | 1.04 | 1.11 | 7.17 |
| Urea Nitrogen | 1.14 | 1.31 | 6.00 |
| Uric Acid | 3.68 | 1.56 | 4.05 |
| Uric Acid | 3.29 | 1.43 | 4.69 |
This is the new performance:
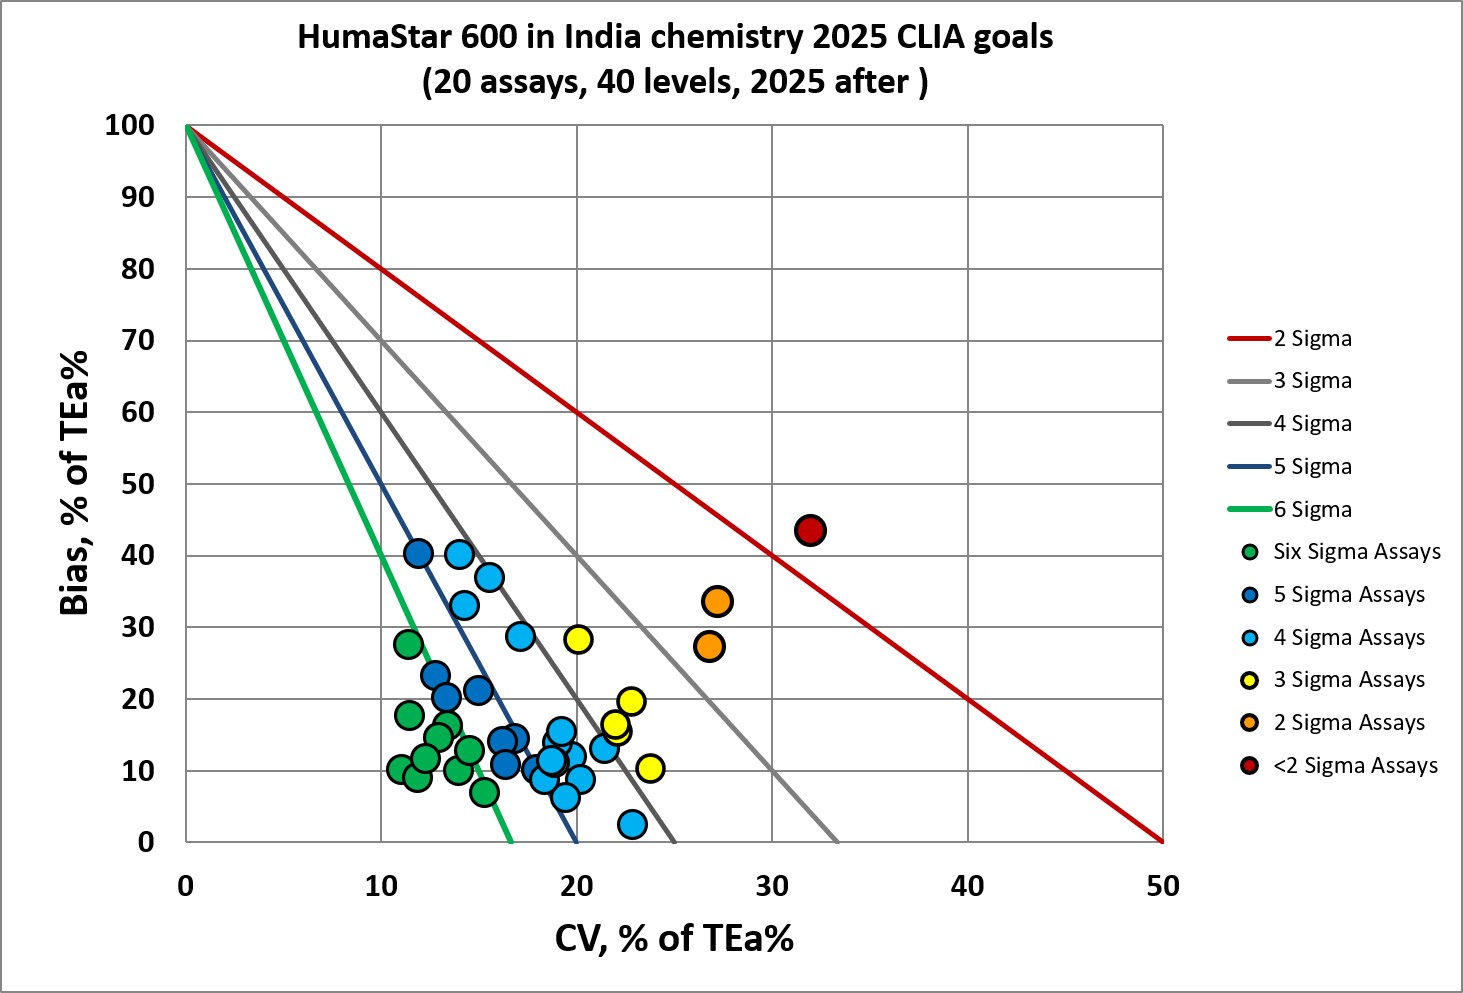
Now 80% of the menu is 4,5, and 6 Sigma. That's a massive improvement.
Here's another look at this change:
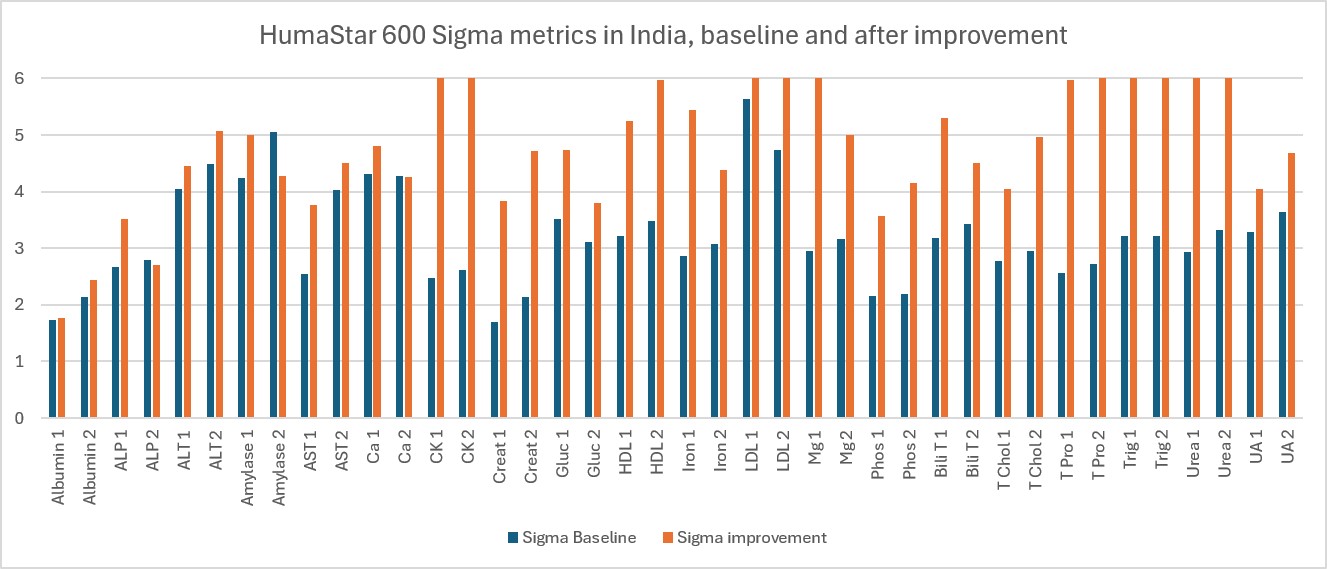
The average improvement is 55%. Sigma metrics were dramatically better once the lab staff standardized their operating procedures.
Here's another look, just at the percentage improved for each assay:
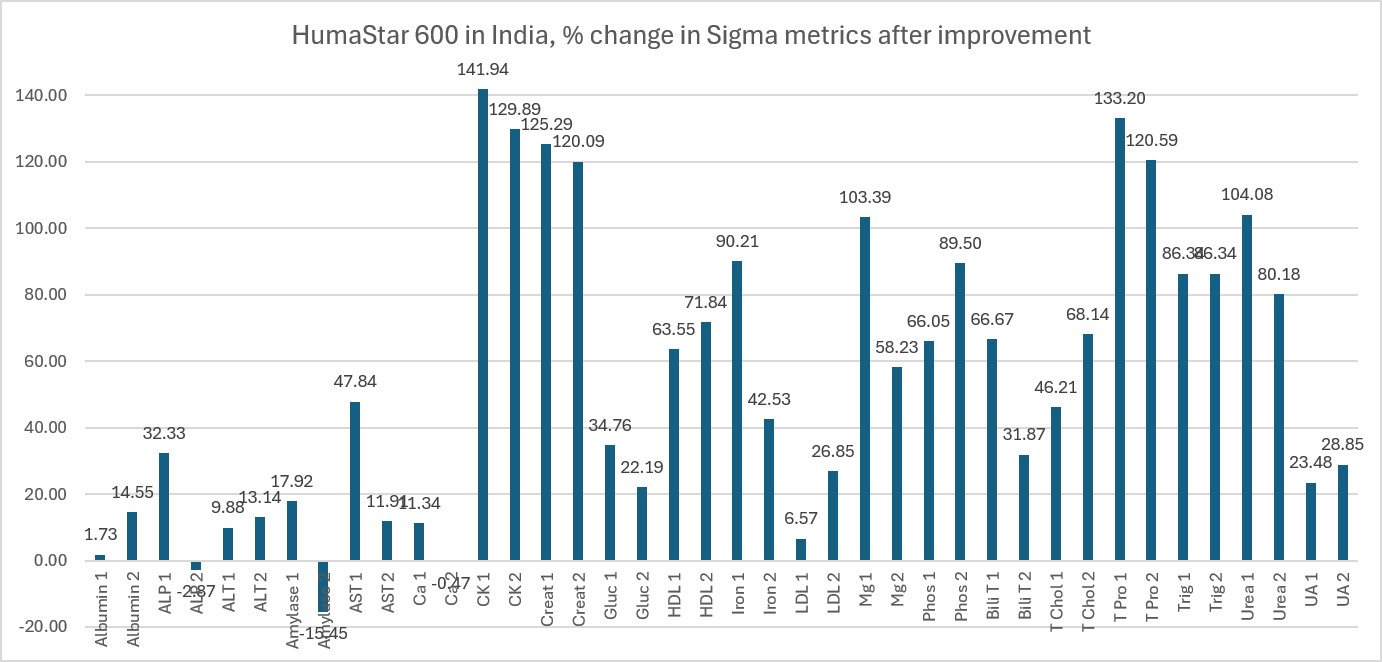
Some of the analytes doubled their Sigma metric, just because the operators learned to work better. The instrument didn't change. The lab did.
Conclusion
The authors concluded, "The DMAIC-based quality improvement programme strengthened analytical performance and reduce the number of unacceptabl analytes from 11 to 2...Integrating sigma metrics, QGI analysis, CAPA and Westgard Sigma Rule-based QC planning offers a systematic approach to sustaining analytical reliability and enhancing patient safety."
The use of manufacturer controls means that the Sigma metrics here are probably overstated. 3rd party controls might provide a more objective view. Nevertheless, it's impressive to see that labs have the power to significantly improve their sigma metrics, even when they don't change their instrument.
For some labs, a lot of these "improvements" are already the baseline, so there might not be as much room for improvement as this laboratory had. Each lab needs to figure out their starting point and determine what improvements are still available to make.