Sigma Metric Analysis
Alinity HQ analyzer in Turkey, multimode analysis
Alinity HQ is one of the newest hematology analyzers out there. How does it stack up when you benchmark it against the latest CLIA goals, EFLM desirable and minimum goals? Alinity HQ Multimode analysis.
Alinity HQ in Turkey, multimode analysis
Sten Westgard, MS
March 2024
Other articles in the multimode series:
- Beckman Coulter DxC 700
- Abbott Alinity
- Abbott Alinity in Turkey
- Siemens Atellica
- Siemens Atellica in Romania
- Siemens Atellica in Spain
- Siemens ADVIA 2120i
- Roche c501 in Turkey
- Roche c501 in Saudi Arabia
- MicroLab RX-50 in India
- Roche cobas 6000 immunoassays in Turkey
- Sysmex XN 350 in India
- Dymind DH 76 in Bulgaria
- Mindray 7500 in China
- Mindray BS 2000M in China
Sigma Score 3.0 out of 6. Moderate [Imprecision measured over long-term, using 3rd party controls, at medical decision levels; bias measured with patient samples; performance benchmarked with European biological goals.]
This month's paper is from Baskent University Hospital in Turkey:
User Verification of Abbott Alinity HQ hematology analyzer, Bayraktar N, Topcu DI. Turk J Biochem 2023: aop. https://doi.org/10.1515/tjb-2023-0185
The Imprecision and bias data
For once, we have the data collected from an analyzer that includes multiple components of the same instrument. On some hematology instruments, there's a left side and a right side, and perhaps no way to know where the samples was tested. The performance is supposed to be identical - good or great on both sides. This study looks at both the left and right side, allowing us to compare performance. A long-term precision study was conducted with 3 levels of Randox controls, 3 times a day, for 30 days. Method comparison was made against a Cell Dyn Ruby analyzer using 120 patient samples, following the CLSI EP 09 guideline.
| Right Side Alinity HQ | Left Side Alinity HQ | ||||||||||
| TEST | Level | Slope | Y-intercept | % Bias | CV | TEST | Level | Slope | Y-intercept | % Bias | CV |
| Hemoglobin | 8 | 0.96 | 0.49 | 2.125 | 1.58 | Hemoglobin | 7.99 | 0.96 | 0.49 | 2.132666 | 1.55 |
| 11.84 | 0.96 | 0.49 | 0.138514 | 1.22 | 11.8 | 0.96 | 0.49 | 0.152542 | 0.94 | ||
| 17.32 | 0.96 | 0.49 | 1.170901 | 1.94 | 17.28 | 0.96 | 0.49 | 1.164352 | 1.84 | ||
| Hematocrit | 25.14 | 0.96 | 0.86 | 0.579157 | 1.23 | Hematocrit | 25.12 | 0.96 | 0.86 | 0.576433 | 1.28 |
| 36.81 | 0.96 | 0.86 | 1.663678 | 1.58 | 36.78 | 0.96 | 0.86 | 1.661773 | 1.74 | ||
| 50.28 | 0.96 | 0.86 | 2.289578 | 2.66 | 50.33 | 0.96 | 0.86 | 2.291278 | 3.1 | ||
| MCV | 88.08 | 1.25 | -20.14 | 2.134423 | 0.7 | MCV | 87.98 | 1.25 | -20.14 | 2.108434 | 0.64 |
| 89.34 | 1.25 | -20.14 | 2.456906 | 0.65 | 89.21 | 1.25 | -20.14 | 2.424056 | 0.54 | ||
| 101.29 | 1.25 | -20.14 | 5.116497 | 0.58 | 101.21 | 1.25 | -20.14 | 5.100781 | 0.52 | ||
| MCH | 28.05 | 1 | 1.54 | 5.490196 | 1.64 | MCH | 27.97 | 1 | 1.54 | 5.505899 | 1.81 |
| 28.74 | 1 | 1.54 | 5.358386 | 0.94 | 28.62 | 1 | 1.54 | 5.380853 | 1.46 | ||
| 34.91 | 1 | 1.54 | 4.411343 | 2.15 | 34.76 | 1 | 1.54 | 4.43038 | 2.45 | ||
| MCHC | 31.84 | 0.5 | 17.28 | 4.271357 | 1.43 | MCHC | 31.79 | 0.5 | 17.28 | 4.356716 | 1.46 |
| 32.17 | 0.5 | 17.28 | 3.714641 | 1.02 | 32.07 | 0.5 | 17.28 | 3.882133 | 1.28 | ||
| 34.47 | 0.5 | 17.28 | 0.130548 | 2 | 34.35 | 0.5 | 17.28 | 0.305677 | 2.28 | ||
| Platelets | 72.46 | 0.98 | -4.87 | 8.720949 | 3.44 | Platelets | 72.46 | 0.98 | -4.87 | 8.720949 | 3.44 |
| 227.17 | 0.98 | -4.87 | 4.143769 | 1.99 | 227.17 | 0.98 | -4.87 | 4.143769 | 1.99 | ||
| 462.77 | 0.98 | -4.87 | 3.052359 | 2.35 | 462.77 | 0.98 | -4.87 | 3.052359 | 2.35 | ||
| RBC | 2.85 | 0.91 | 0.18 | 2.684211 | 1.26 | RBC | 2.86 | 0.91 | 0.18 | 2.706294 | 1.38 |
| 4.12 | 0.91 | 0.18 | 4.631068 | 1.63 | 4.12 | 0.91 | 0.18 | 4.631068 | 1.86 | ||
| 4.96 | 0.91 | 0.18 | 5.370968 | 2.8 | 4.97 | 0.91 | 0.18 | 5.37827 | 3.19 | ||
| WBC | 2.98 | 0.96 | 0.07 | 1.651007 | 2.58 | WBC | 2.99 | 0.96 | 0.07 | 1.658863 | 2.49 |
| 6.76 | 0.96 | 0.07 | 2.964497 | 1.74 | 6.79 | 0.96 | 0.07 | 2.969072 | 2.3 | ||
| 15.87 | 0.96 | 0.07 | 3.558916 | 1.38 | 15.8 | 0.96 | 0.07 | 3.556962 | 1.35 | ||
| Lymphocytes | 0.88 | 0.99 | 0 | 1 | 5.16 | Lymphocytes | 0.89 | 0.99 | 0 | 1 | 4.86 |
| 1.65 | 0.99 | 0 | 1 | 3.82 | 1.67 | 0.99 | 0 | 1 | 4.93 | ||
| 3.3 | 0.99 | 0 | 1 | 3.06 | 3.29 | 0.99 | 0 | 1 | 3.53 | ||
| Monocytes | 0.31 | 0.92 | -0.01 | 11.22581 | 12.2 | Monocytes | 0.32 | 0.92 | -0.01 | 11.125 | 12.05 |
| 0.71 | 0.92 | -0.01 | 9.408451 | 8.69 | 0.71 | 0.92 | -0.01 | 9.408451 | 9.2 | ||
| 1.69 | 0.92 | -0.01 | 8.591716 | 9.05 | 1.7 | 0.92 | -0.01 | 8.588235 | 9.98 | ||
| Eosinophils | 0.07 | 0.96 | 0 | 4 | 16.98 | Eosinophils | 0.07 | 0.96 | 0 | 4 | 16.48 |
| 0.2 | 0.96 | 0 | 4 | 9.21 | 0.2 | 0.96 | 0 | 4 | 8.96 | ||
| 0.5 | 0.96 | 0 | 4 | 5.46 | 0.5 | 0.96 | 0 | 4 | 5.08 | ||
| Basophils | 0.03 | 0.66 | -0.02 | 100.6667 | 44.71 | Basophils | 0.03 | 0.66 | -0.02 | 100.6667 | 35.36 |
| 0.08 | 0.66 | -0.02 | 59 | 31.32 | 0.08 | 0.66 | -0.02 | 59 | 27.96 | ||
| 0.15 | 0.66 | -0.02 | 47.33333 | 21.47 | 0.16 | 0.66 | -0.02 | 46.5 | 24.3 | ||
| Neutrophils | 1.37 | 0.96 | 0.03 | 1.810219 | 4.26 | Neutrophils | 1.37 | 0.96 | 0.03 | 1.810219 | 4.01 |
| 3.39 | 0.96 | 0.03 | 3.115044 | 2.81 | 3.41 | 0.96 | 0.03 | 3.120235 | 2.81 | ||
| 8.39 | 0.96 | 0.03 | 3.642431 | 2.47 | 8.35 | 0.96 | 0.03 | 3.640719 | 2.17 | ||
Sigma-metrics according to EFLM-derived DESIRABLE performance specifications
As set forth by the Milan Heirarchy, performance goals based on biological variation are considered superior to those set by regulators and proficiency testing or external quality assurance programs. However, the hematology goals are known to be very demanding.
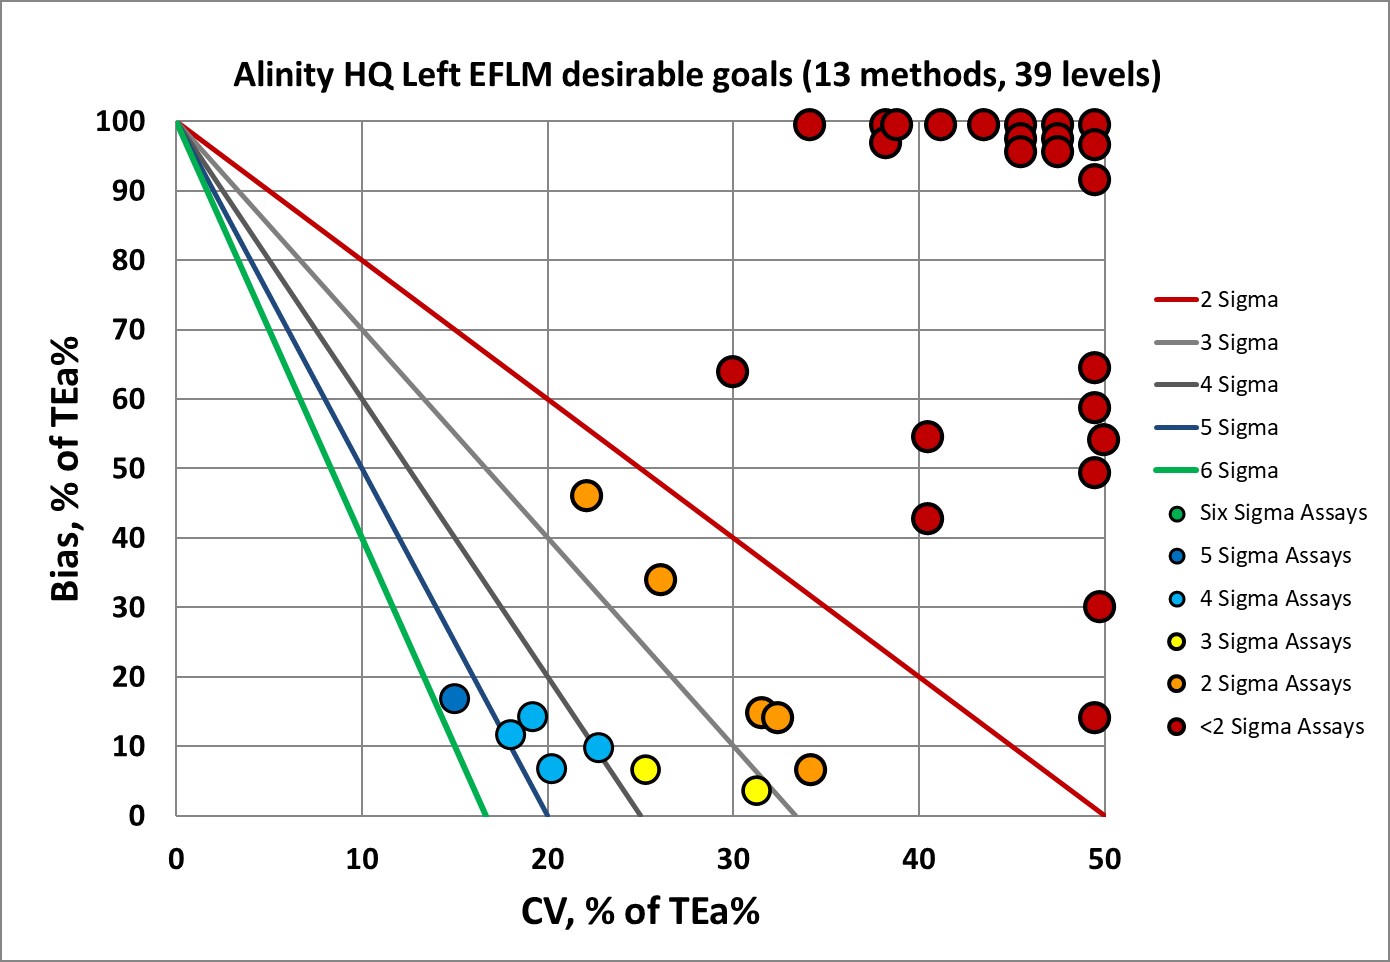
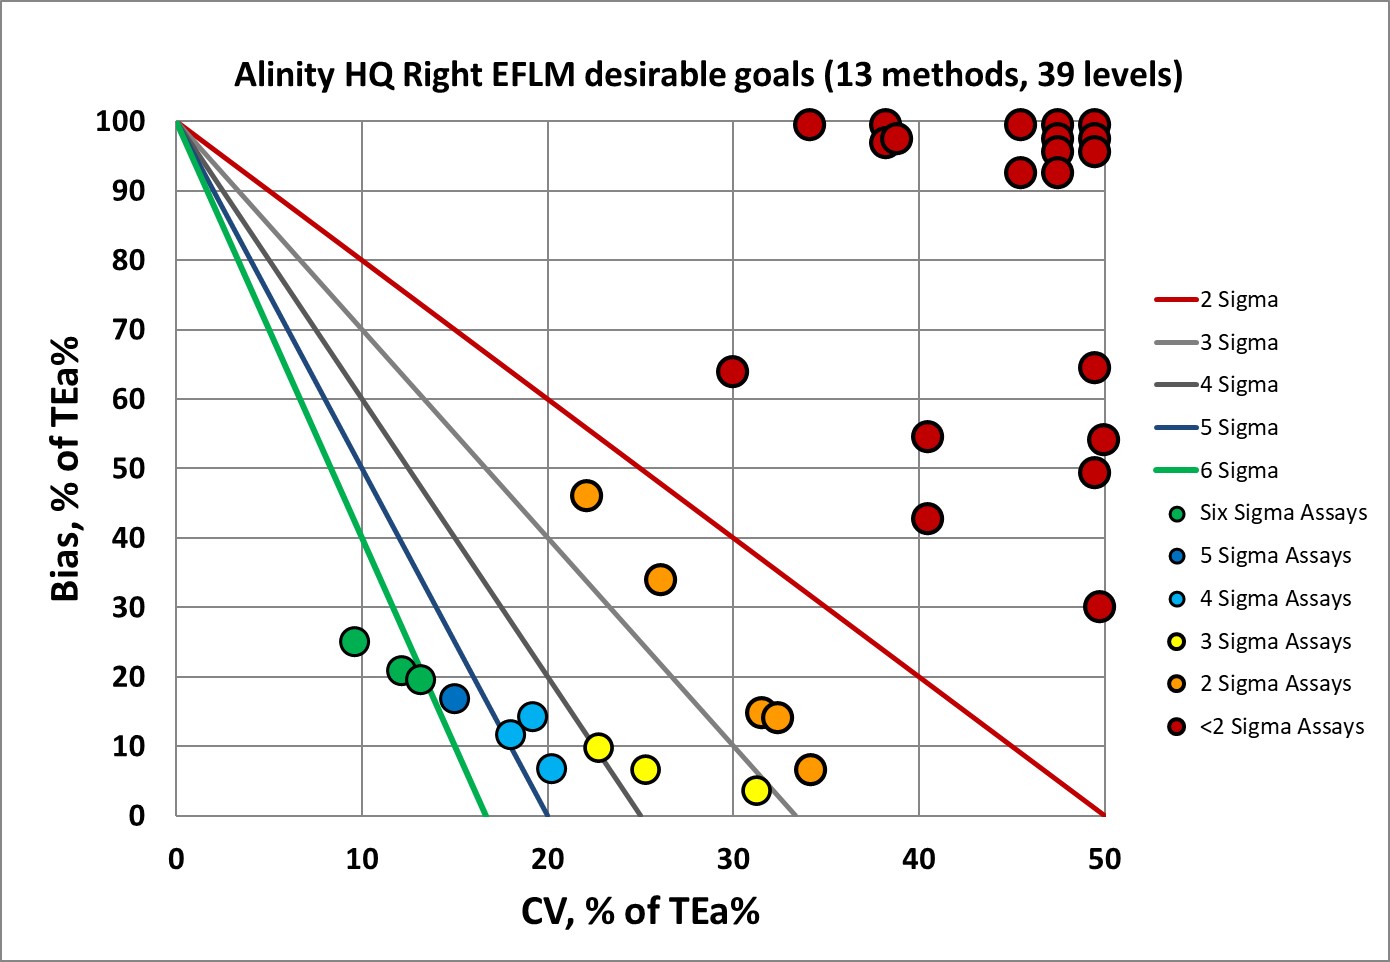
So, it's clear now why EFLM no longer recommends using desirable performance specifications. Instead, they recommend the minimum performance specifications. So let's see that.
Sigma-metrics according to EFLM-derived MINIMUM performance specifications
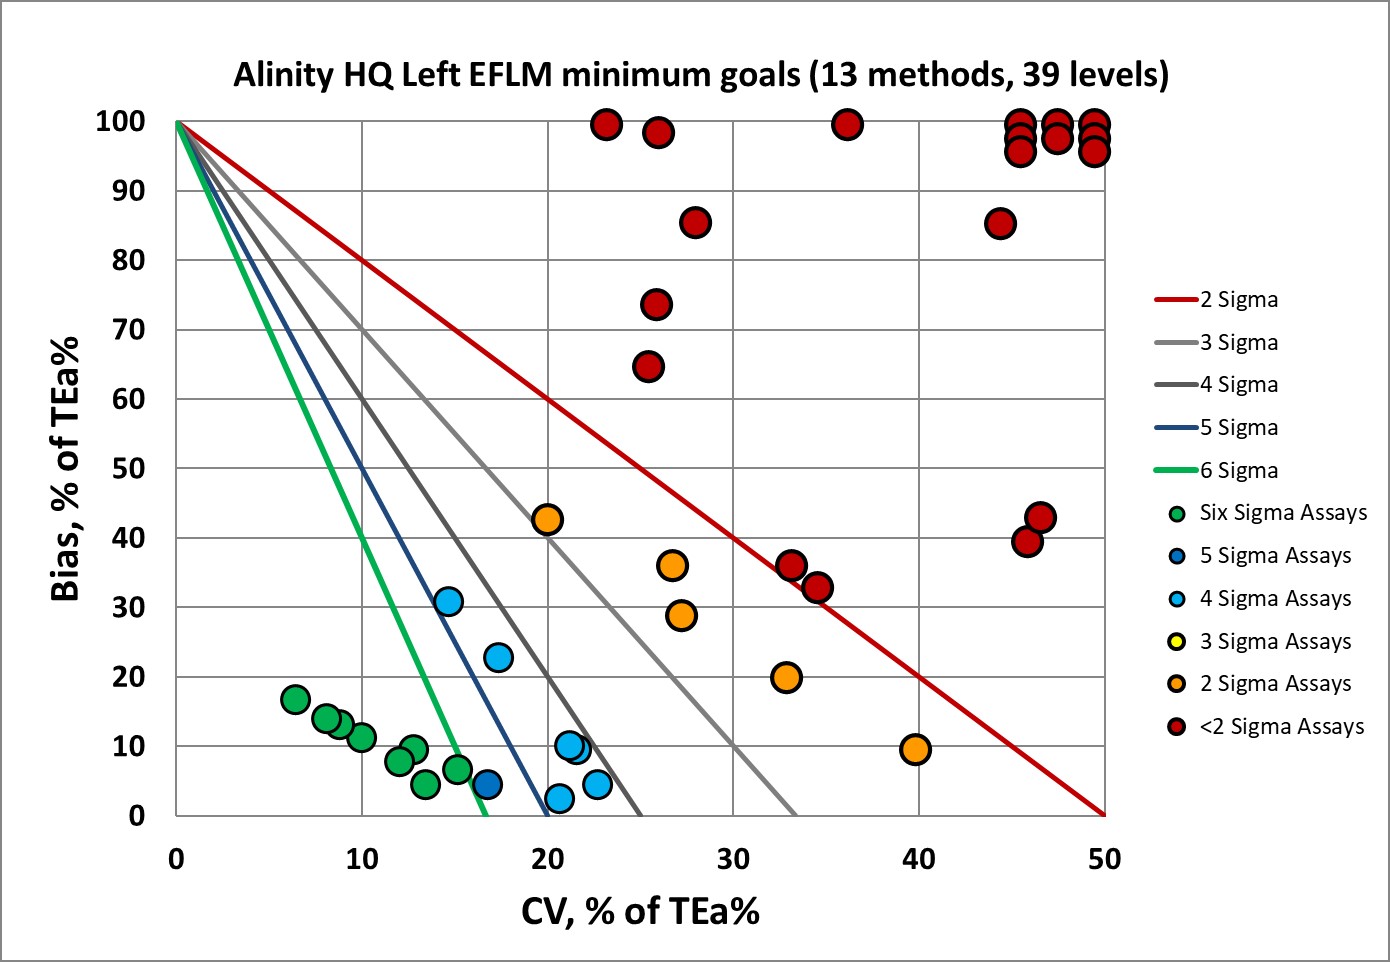
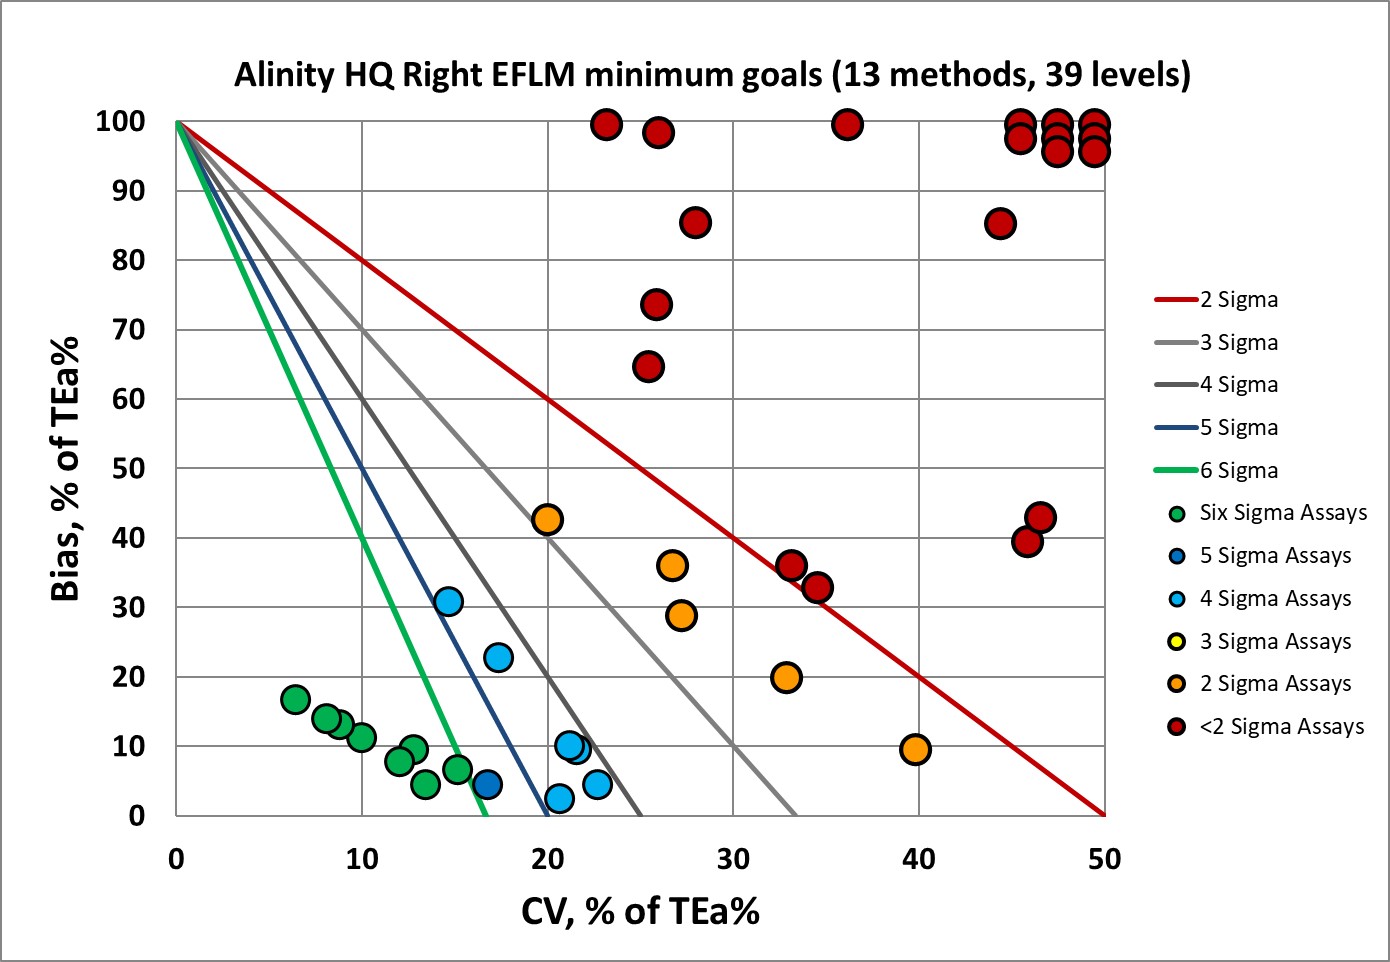
There's a definite improvement, but still there's a vast proportion of the assay performance is below 2 Sigma.
Sigma-metrics according to CLIA 2024 performance specifications
For US labs and labs that are governed by CAP accreditation, there's a respite: the EFLM biological rules aren't mandatory. CLIA 2024 goals are instead. One shortcoming is that the CLIA goals don't cover all the differential parameters, they only cover a few analytes. The 1992 CLIA goals were fairly forgiving, but there's a rude wake up for labs once the new goals kick in.
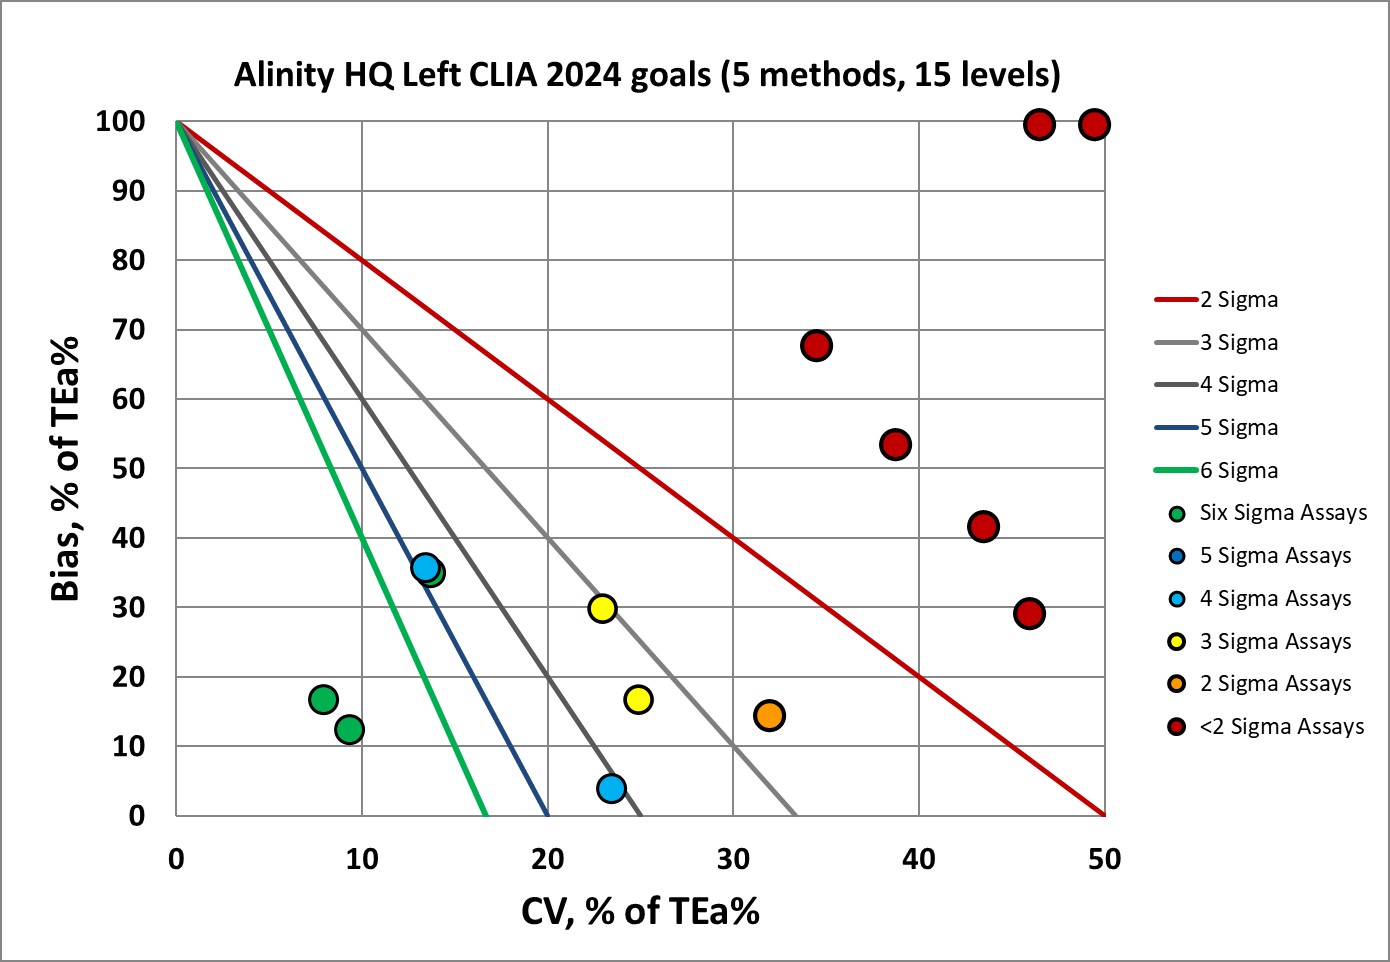
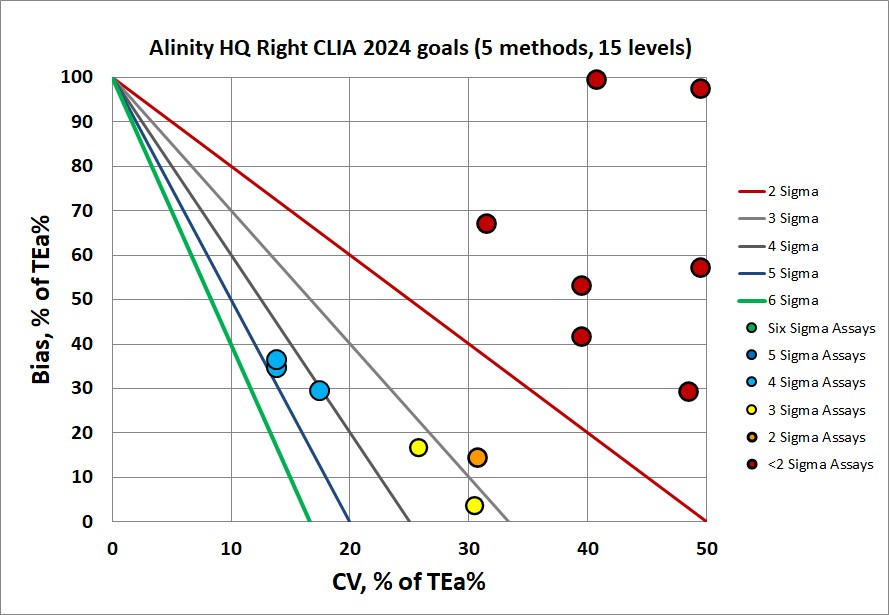
Even the CLIA 2024 goals are hard to hit for the Alinity HQ. The new CLIA 2024 goals are in fact some of the strictest performance specifications now, sometimes even more demanding than the EFLM desirable goals!
The final verdict on this Alinity HQ is that its performance cannot achieve either the CLIA 204, EFLM minimum or EFLM desirable benchmarks. The implications of this performance are that more robust QC implementation is needed - more rules, more levels, more frequency, and overall more vigilance.
The one bit of good news is that the left and right side have essentially identical performance. There isn't a worry about getting different result from left or right. The problem is that neither side is able to meet the goals demanded by CLIA and EFLM.