Sigma Metric Analysis
A1C EZ 2.0 Analyzer: Sigma-metric assessment
There's another new POC HbA1c analyzer to be analyzed. Is the A1C EZ 2.0 fit for purpose? Using the IFCC and Lenters-Westra standards, we evaluate its performance.
Sigma-metric Analysis of the A1C EZ 2.0 HbA1c Analyzer
Sten Westgard, MS
May 2018
- The Precision, Comparison and Sigma-metric data
- Summary of Performance according to CAP and IFCC Goals by Sigma-metrics Normalized Method Decision charts
- QC Implications of EZ 2.0 Performance by Normalized OPSpecs chart
- Conclusion
[Note: This QC application is an extension of the lesson From Method Validation to Six Sigma: Translating Method Performance Claims into Sigma Metrics. This article assumes that you have read that lesson first, and that you are also familiar with the concepts of QC Design, Method Validation, and Six Sigma metrics. If you aren't, follow the link provided.]
There is a new entry to the HbA1c POC market: the A1C EZ 2.0 HbA1c Analyzer:
Verification of a novel point-of-care HbA1c device in real world clinical practice by comparison to three high performance liquid chromatography instruments, Yufei Wag, Wei Peng, Junling Tang, Lu Dong, Chengchen Gu, Jian Zhou, Weiping Jia, Biochem Med (Zagreb) 2018;28(2):020705
The Imprecision, Bias and Sigma-metric Data
"We... evaluated the precision of A1C EZ 2.0 following CLSI EP5-A2 (Evaluation Of Precision Performance Of Quantitative Measurement Methods. Approved Guideline - Second Edition). Two potassium-ethylenediaminetetraacetic acid (K2-EDTA) anticoagulant whole blood samples (one within normal range and the other in the higher range of HbA1c values) were tested in two runs per day in duplicate on twenty consecutive days. Controls provided by manufacturers were used before and after every day’s experiments to ensure that performance of all instruments meets the required standards by manufacturers. Otherwise calibration was carried out following manufacturers’ manual."
The protocol being followed is ideal, however it would be better to use independent controls (3rd party) to give a more objective assessment.
"The HbA1c values from each blood sample were measured by A1C EZ 2.0 and all three HPLC devices: Bio-Rad Variant II Turbo (Bio-Rad Laboratories, Hercules, USA; measurement range 3.5 - 19% HbA1c), Tosoh HLC-723 G8 (Tosoh, Tokyo, Japan; measurement range 4 - 16.9% HbA1c) and Premier Hb9210 (Trinity Biotech, Bray, Ireland; measurement range 3.7 - 18.5% HbA1c). Both A1C EZ 2.0 and Premier Hb9210 utilize boronate affinity method; however, A1C EZ 2.0 uses lateral chromatography on a porous membrane matrix, while Premier Hb9210 HPLC device uses column chromatography. Tosoh HLC-723 G8 and Bio-Rad Variant II Turbo devices utilize cation-exchange method. All tests were performed according to the manufacturers’ instructions manual. Operators performing tests on the A1C EZ 2.0 and HPLC devices were blinded to the clinical characteristics of the subjects....
"Passing-Bablok linear regression analysis of HbA1c values obtained by A1C EZ 2.0 versus three HPLCs was further conducted to assess the accuracy of A1C EZ 2.0 while considering the above mentioned HPLC devices as references (11). The linear regression analysis in each subject group was performed separately. Six hundred and thirty-five pairs of data from all 514 subjects (121 subjects tested both venous blood and fingertip capillary whole blood) were also combined for linear regression analysis for each reference HPLC device. Finally, to check overall agreement independent of chosen reference HPLC device, the mean HbA1c values of three HPLC devices (referred as “mean SRM” below) were used to perform the linear regression against results given by A1C EZ 2.0."
This is also ideal study design. To compare the method against not only one, but THREE reference methods.
Where this analysis gets more complicated is when we apply the different standards available from CAP/NGSP, IFCC standardization committee, and the Dr. Erna (Lenters-)Westra rules.
- The goal we typically apply is the CAP/NGSP goal of 6.0% TEa (allowable total error) at a level of 6.5% HbA1c, the level at which diagnosis of diabetes can be made
- The IFCC committee recommends setting a TEa of 5 mmol/mol in IFCC units ( 0.46% DCCT units), with a 2 Sigma criterion for routine laboratories passing and 4 sigma criterion for laboratories working in clinical trials Evaluating new HbA1c methods for adoption by the IFCC and NGSP reference networks using international quality targets, Erna Lenters-Westra, Emma English, Clin Chem Lab Med. 2017 Aug 28;55(9):1426-1434. doi: 10.1515/cclm-2017-0109. Dr. Lenters clarifies that there is a difference in the units:
"Total Allowable Error (TAE) for HbA1c has been set by the IFCC Task Force on Implementation of HbA1c standardization as a default of 5 mmol/mol (0.46% DCCT) at an HbA1c level of 50 mmol/mol (6.7% DCCT) which corresponds with a relative TAE of 10% ((5/50)*100%) in SI units (6.9% DCCT units ((0.46/6.7)*100%)) with risk levels of 2σ for routine laboratories and 4σ for laboratories performing clinical trials." - The (Lenters-)Westra rules: CV in CLSI EP-5 should be at 48 mmol/mol and 75 mmol/mol < or equal to 3% in SI units or < or equal to 2% in DCCT units; Bias in CLSI EP-9 at 48 mmol/mol and 75 mmol/mol compared with the mean of at least 3 certified secondary reference measurement procedures should < or equal to 2 mmol/mol or < or equal to 0.2% DCCT units.
So the criteria are all laid out, and this is one study where the data appears to have been gathered to at least attempt to meet all the benchmarks:
| TEa source | Level | TEa% | mean SRM slope | mean SRM y-int | bias units | bias% | CV% |
| CAP/NGSP | 5.2 | 6.00 | 1.0 | 0.1 | 0.10 | 1.9 | 2.3 |
| CAP/NGSP | 11.6 | 6.00 | 1.0 | 0.1 | 0.10 | 0.86 | 1.9 |
| IFCC | 5.2 | 8.8 | 1.0 | 0.1 | 0.10 | 1.9 | 2.3 |
| IFCC | 11.6 | 4.0 | 1.0 | 0.1 | 0.10 | 0.86 | 1.9 |
In contrast, to our usual multitest instrument evaluations, there is a smaller, much more compact set of numbers to deal with here.
Unfortunately, not many of these numbers look that good. By Lenters-Westra rules, this method is exceeding the allowable imprecision at 5.2% , but otherwise the method meets the permissible bias and imprecision recommendations.
Sigma-metric calculations for the A1C EZ 2.0
Remember the equation for Sigma metric is (TEa - bias) / CV:
For the A1C EZ 2.0, using the NGSP/DCCT goal, at the level of 5.2%, the equation is (6 - 1.9) / 2.3 = 1.78
The Sigma-metrics are displayed along the right columns.
| TEa source | Level | TEa% | mean SRM slope | mean SRM y-int | bias units | bias% | CV% | Sigma-metric | CV-X | bias-Y |
| CAP/NGSP | 5.2 | 6.00 | 1.0 | 0.1 | 0.10 | 1.9 | 2.3 | 1.78 | 38.33 | 32.05 |
| CAP/NGSP | 11.6 | 6.00 | 1.0 | 0.1 | 0.10 | 0.86 | 1.9 | 2.70 | 31.67 | 14.33 |
| IFCC | 5.2 | 8.8 | 1.0 | 0.1 | 0.10 | 1.9 | 2.3 | 3.0 | 26.0 | 21.74 |
| IFCC | 11.6 | 3.9 | 1.0 | 0.1 | 0.10 | 0.86 | 1.9 | 3.55 | 47.91 | 21.74 |
The last two columns detail where we will graph these coordinates on Normalized Method Decision and Normalized OPSpecs chart.
According to the Lenters-Westra/IFCC standard, the cobas b 101 is achieving the minimum Sigma for acceptance for both levels: >2 Sigma. For CAP/NGSP, the performance for both levels is below 3 Sigma. Given that the normal performance that other methods strive for is in the 4 to 6 Sigma range, this is not an inspiring result for a new method entering the market.
Summary of Performance by Sigma-metrics Method Decision Chart using CAP/DCCT Goals
We can make a visual assessment of this performance using a Normalized Sigma-metric Method Decision Chart:
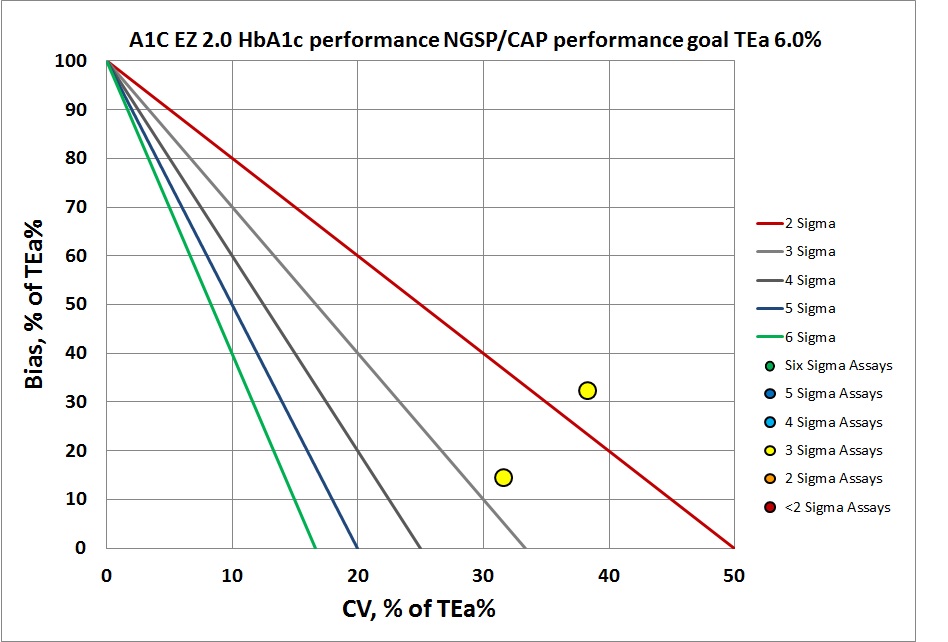
By CAP/NGSP, this method misses the target.
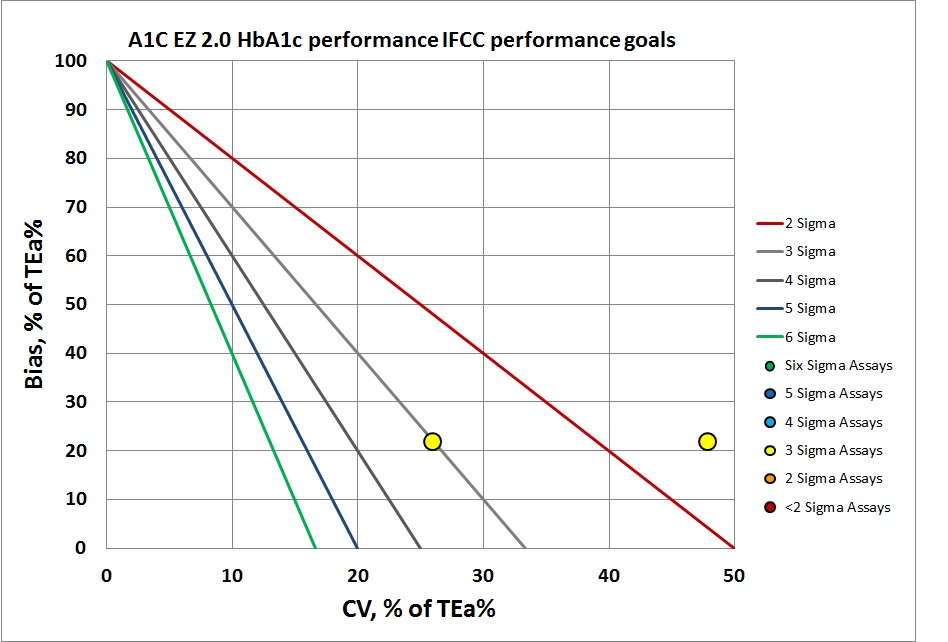
By IFCC/Lenters-Westra standards, it's not much better. But of course at the normal level the control has passed the 2-Sigma line. So this method is half acceptable. The abnormal level, however, is actually below 2 Sigma, so we've got mixed performance.
Summary of QC Design by Normalized OPSpecs chart - using CAP and IFCC Goals
The benefit of the Sigma-metric approach is that labs can do more than assess their quality, they can act on it and design what QC rules and controls are needed. Using Normalized OPSpecs charts, we can actually see what QC procedures would be necessary to operate this instrument.
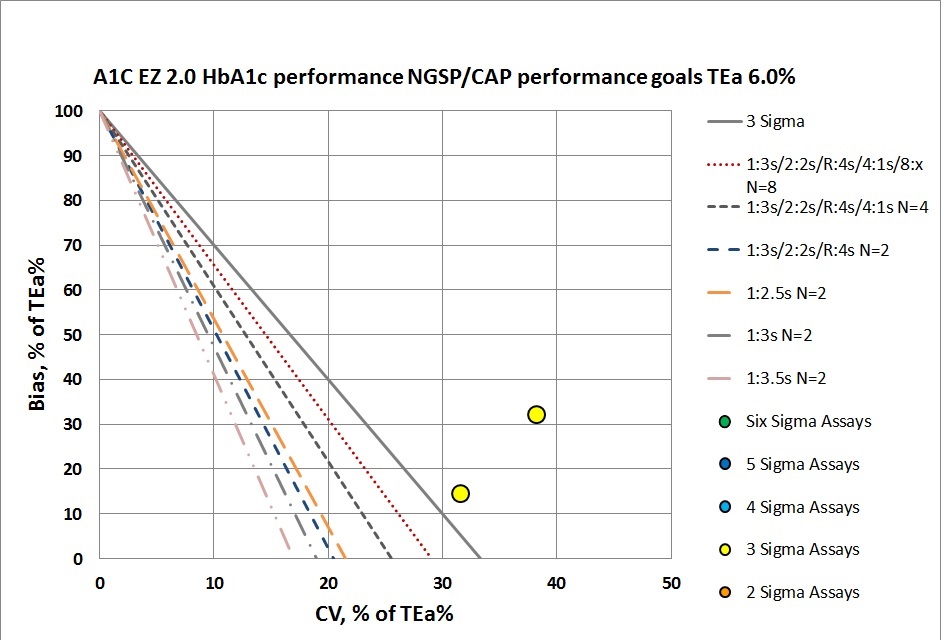
According to CAP/NGSP standards, this method is going to need all the "Westgard Rules" and more. If we were to apply a QC Frequency Nomogram, we would probably find the frequency of needing to run controls was extremely often. If we weren't running QC every 10 patients, we would be putting more than 1 patient result at risk with every interval.
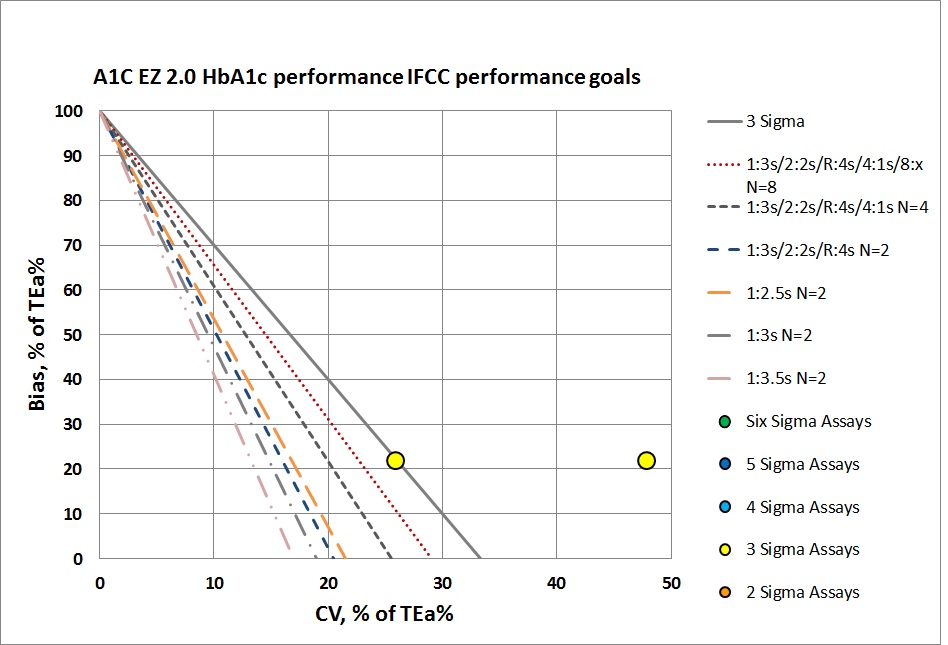
Neither of these levels can be controlled with even a maximum set of "Westgard Rules" and 4 to 8 controls per run. That will be necessary, but truly they need to do something more than just statistical QC to monitor this method. Perhaps running patients in replicates will help reduce the imprecision. he abnormal level is just missing the target. No amount of "Westgard Rules" and controls will bring this method back into acceptability.
It's also probably too optimistic to assume that this POC device has even the capability of running sophisticated control rules and multiple controls. Usually the devices are built to provide minimal QC features. run.
Conclusion
The authors stated "Overall performance of A1C EZ 2.0 was fairly good in our study, and was similar to the previously reported performance by another study ."
We would characterize this conclusion as faint praise. "Fairly good" sounds like a relative judgment. This neither meets the IFCC nor the CAP goals for performance, and it would require an unsustainable amount of effort and expense in QC if it was implemented with the necessary rules and controls. Using this device in a lab would be anything but easy.