Sigma Metric Analysis
A Sysmex XN-L XN-350 in the Netherlands
Can Six Sigma come in small packages? Compact devices typically compromise analytical quality for size. A recent study from Eramus Medical Center looks at the question of perfection at the point of care for Sysmex hematology.
Sigma metric analysis of a Sysmex XN-L (XN-350) in the Netherlands
May 2021
Sten Westgard, MS
 |
The key reference works the provide the foundation for this analysis are Basic Method Validation, 4th Edition and Six Sigma QC Design and Control, 2nd Edition. |  |
The point of care is rarely perfect. That's what decades of data and experience have taught us. But what if we're finally reaching a stage of excellence, even in the smallest devices?
The Sysmex XN-L (XN-350) hematology analyzer offers a compact solution for laboratories in niche diagnostics. TA Khartabil, MM de Frankrijker, YB de Rijke, H Russcher. Int J Lab Hemataol 2021:43:29-39.
This study focuses on the performance of the smaller Sysmex XN devices, compared to the performance of the XN-1000 at the Erasmus Medical Center, Rotterdam, the Netherlands.
The imprecision and bias data of the Sysmex XN-L (XN-350)
The data collection was about ideal as it gets for hematology."[R]eproducibility was performed by using XN CHECK levels 1, 2 and 3 for the whole blood mode...All levels were processed twice a day in triplicate across a five-day period in order to provide additional reproducibility data....Studies were performed in accordance with the recommendations in CLSI_EP05-A3." It's not the longest study one can do for precision, and it's not the ideal control (this was not 3rd party, it was the manufacturer control), but in hematology, this is often as good as it gets.
"For whole blood, a total of 300 whole blood samples were included." The comparison study was performed on the XN-350 and XN-1000 and Passing-Bablok regression was calculated. This is a good number and technique, the regression results should be pristine.
Sysmex XN-L (XN-350) performance data
The CLIA goals for hematology are incomplete, they don't cover all the analytes and parameters. So other sources had to be consulted to set performance specifications. Our Consolidated Table of Hematology Goals is the guideline we used for this analysis.
| TEST | TEa | Lab Mean | Slope | y-int | Bias Units | % Bias | CV |
|
Hemoglobin CLIA 7% |
7 | 6.00 | 1.00 | 0.10 | 0.10 | 1.7 | 1.21 |
| 12.73 | 0.10 | 0.8 | 0.62 | ||||
| 16.60 | 0.10 | 0.6 | 0.69 | ||||
|
Hematocrit CLIA 6% |
6 | 17.80 | 0.96 | 0.26 | -0.45 | 2.5 | 1.03 |
| 36.80 | -1.21 | 3.3 | 0.91 | ||||
| 46.60 | -1.60 | 3.4 | 0.91 | ||||
|
MCV ESFEQA 10% |
10 | 76.40 | 1.02 | -3.05 | -1.52 | 2.0 | 0.59 |
| 83.50 | -1.38 | 1.7 | 0.41 | ||||
| 87.00 | -1.31 | 1.5 | 0.44 | ||||
|
MCH ESFEQA 9% |
9 | 25.80 | 1.02 | 0.35 | 0.87 | 3.4 | 1.25 |
| 28.90 | 0.93 | 3.2 | 0.84 | ||||
| 31.00 | 0.97 | 3.1 | 0.70 | ||||
|
MCHC ESFEQA 7% |
7 | 33.80 | 1.02 | 0.53 | 1.21 | 3.6 | 1.46 |
| 34.70 | 1.22 | 3.5 | 1.00 | ||||
| 35.60 | 1.24 | 3.5 | 0.94 | ||||
|
Platelets CLIA 25% |
25 | 61.10 | 0.97 | 4.46 | 2.63 | 4.3 | 6.38 |
| 234.40 | -2.57 | 1.1 | 3.76 | ||||
| 555.70 | -12.21 | 2.2 | 1.58 | ||||
|
RBC CLIA 6% |
6 | 2.33 | 0.98 | 0.01 | -0.04 | 1.6 | 1.01 |
| 5.35 | -0.10 | 1.8 | 0.75 | ||||
| 4.40 | -0.08 | 1.8 | 0.64 | ||||
|
WBC CLIA 15% |
15 | 2.43 | 0.98 | 0.01 | -0.04 | 1.6 | 2.95 |
| 6.86 | -0.13 | 1.9 | 1.92 | ||||
| 15.70 | -0.30 | 1.9 | 1.67 | ||||
|
Lymphocytes Ricos 17.6% |
17.6 | 0.62 | 0.98 | 0.03 | 0.02 | 2.8 | 8.65 |
| 1.52 | 0.00 | 0.0 | 5.12 | ||||
| 2.77 | -0.03 | 0.9 | 3.95 | ||||
|
Monocytes Ricos 27.9% |
27.9 | 0.09 | 1.00 | -0.01 | -0.01 | 11.1 | 45.55 |
| 0.13 | -0.01 | 7.7 | 42.06 | ||||
| 0.30 | -0.01 | 3.3 | 23.63 | ||||
|
Neutrophils Ricos 23.35% |
23.35 | 1.72 | 0.97 | -0.01 | -0.06 | 3.6 | 3.14 |
| 5.21 | -0.17 | 3.2 | 2.13 | ||||
| 12.67 | -0.39 | 3.1 | 1.95 |
Sigma-metrics of Sysmex XN-L (XN-350)
When we're using a comparison study to calculate bias, there's an extra step with the regression equation we take to calculate the bias.
NewMean = ( OldMean * Slope ) + Y-intercept
For our level 1 Hemoglobin at 6.0 g/dL, this works out
NewMean = (6.0 * 1.0 ) + 0.1
NewMean = 6.1
Bias in units = 6.2 - 6.0 = 0.1
Bias% = 0.1/6.0 = 1.7%
Now we can plug the bias, CV, and TEa into the equation for Sigma metric is (TEa - bias) / CV
For hemoglobin at level 1, the Sigma-metric is (7 - 0.1 ) / 1.21 = 4.4
Here are the rest of the metrics:
| TEST | TEa | Lab Mean | Slope | y-int | Bias Units | % Bias | CV | Sigma |
|
Hemoglobin CLIA 7% |
7 | 6.00 | 1.00 | 0.10 | 0.10 | 1.7 | 1.21 | 4.4 |
| 12.73 | 0.10 | 0.8 | 0.62 | 10.0 | ||||
| 16.60 | 0.10 | 0.6 | 0.69 | 9.3 | ||||
|
Hematocrit CLIA 6% |
6 | 17.80 | 0.96 | 0.26 | -0.45 | 2.5 | 1.03 | 3.4 |
| 36.80 | -1.21 | 3.3 | 0.91 | 3.0 | ||||
| 46.60 | -1.60 | 3.4 | 0.91 | 2.8 | ||||
|
MCV ESFEQA 10% |
10 | 76.40 | 1.02 | -3.05 | -1.52 | 2.0 | 0.59 | 13.6 |
| 83.50 | -1.38 | 1.7 | 0.41 | 20.4 | ||||
| 87.00 | -1.31 | 1.5 | 0.44 | 19.3 | ||||
|
MCH ESFEQA 9% |
9 | 25.80 | 1.02 | 0.35 | 0.87 | 3.4 | 1.25 | 4.5 |
| 28.90 | 0.93 | 3.2 | 0.84 | 6.9 | ||||
| 31.00 | 0.97 | 3.1 | 0.70 | 8.4 | ||||
|
MCHC ESFEQA 7% |
7 | 33.80 | 1.02 | 0.53 | 1.21 | 3.6 | 1.46 | 2.4 |
| 34.70 | 1.22 | 3.5 | 1.00 | 3.5 | ||||
| 35.60 | 1.24 | 3.5 | 0.94 | 3.7 | ||||
|
Platelets CLIA 25% |
25 | 61.10 | 0.97 | 4.46 | 2.63 | 4.3 | 6.38 | 3.2 |
| 234.40 | -2.57 | 1.1 | 3.76 | 6.4 | ||||
| 555.70 | -12.21 | 2.2 | 1.58 | 14.4 | ||||
|
RBC CLIA 6% |
6 | 2.33 | 0.98 | 0.01 | -0.04 | 1.6 | 1.01 | 4.4 |
| 5.35 | -0.10 | 1.8 | 0.75 | 5.6 | ||||
| 4.40 | -0.08 | 1.8 | 0.64 | 6.6 | ||||
|
WBC CLIA 15% |
15 | 2.43 | 0.98 | 0.01 | -0.04 | 1.6 | 2.95 | 4.5 |
| 6.86 | -0.13 | 1.9 | 1.92 | 6.8 | ||||
| 15.70 | -0.30 | 1.9 | 1.67 | 7.8 | ||||
|
Lymphocytes Ricos 17.6% |
17.6 | 0.62 | 0.98 | 0.03 | 0.02 | 2.8 | 8.65 | 1.7 |
| 1.52 | 0.00 | 0.0 | 5.12 | 3.4 | ||||
| 2.77 | -0.03 | 0.9 | 3.95 | 4.2 | ||||
|
Monocytes Ricos 27.9% |
27.9 | 0.09 | 1.00 | -0.01 | -0.01 | 11.1 | 45.55 | 0.4 |
| 0.13 | -0.01 | 7.7 | 42.06 | 0.5 | ||||
| 0.30 | -0.01 | 3.3 | 23.63 | 1.0 | ||||
|
Neutrophils Ricos 23.35% |
23.35 | 1.72 | 0.97 | -0.01 | -0.06 | 3.6 | 3.14 | 6.3 |
| 5.21 | -0.17 | 3.2 | 2.13 | 9.5 | ||||
| 12.67 | -0.39 | 3.1 | 1.95 | 10.4 |
A majority of the performance here is above 4 Sigma, and a good number of assays are at 6 Sigma for at least one level of their performance.
The monocytes are an outlier, but any assay where there are CVs of 20% or 40%, it's to be expected that the Sigma will be low. I have yet to see a hematology platform that doesn't have some big problems with one or two of the differential counts.
Since there are a lot of numbers in this table, it's often easier to see the graph.
Visual display of Sigma-metric Performance of the Sysmex XN-L XN-350
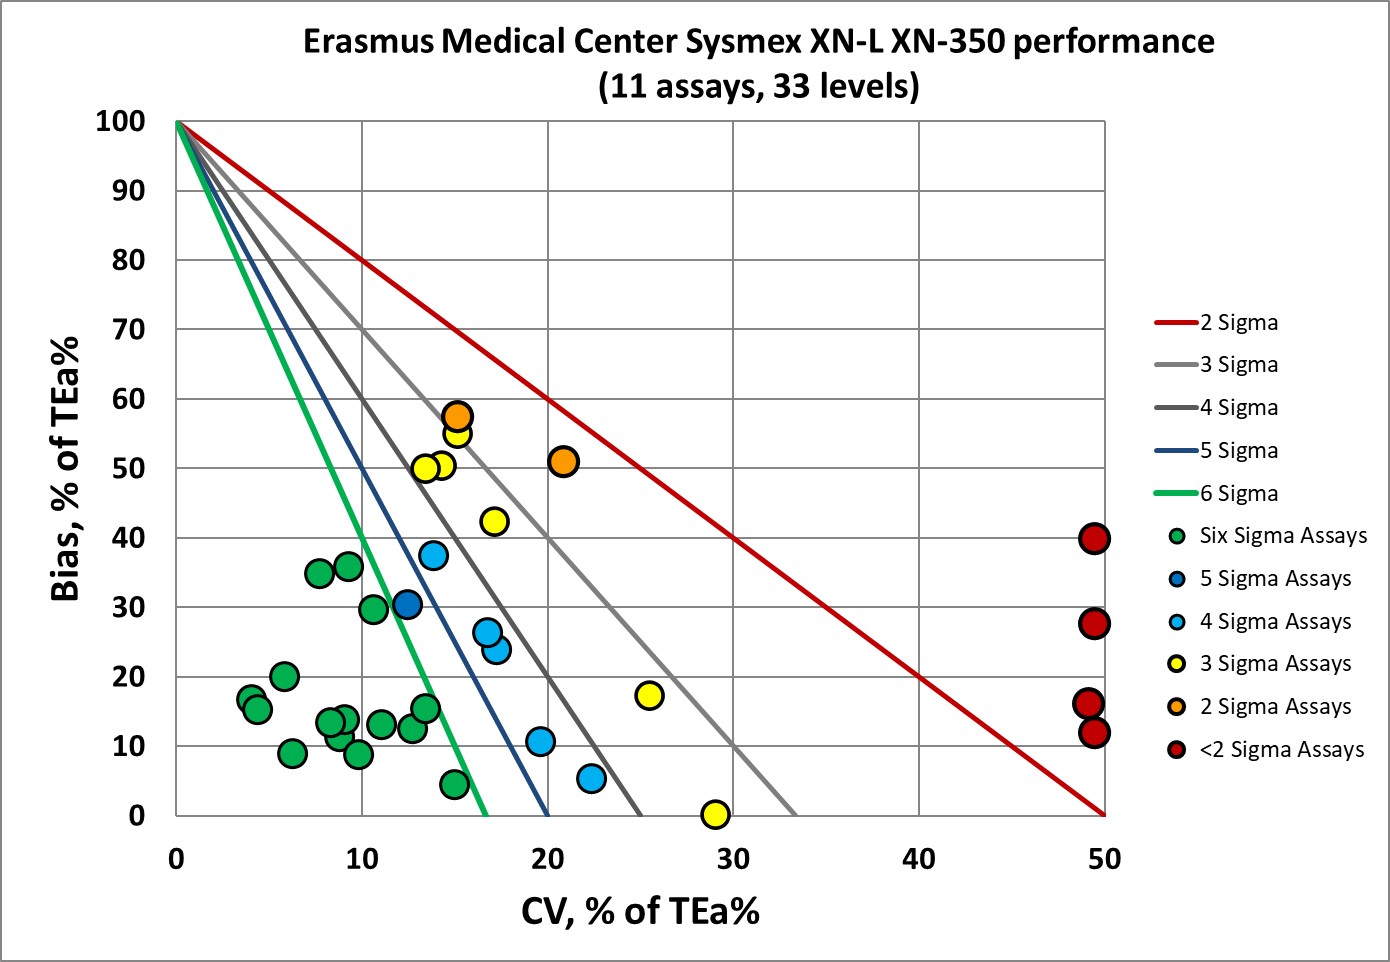
There are a nice cluster of points in the "bull's eye" and only about a third of the performance of this instrument is at 3 Sigma or below 3 Sigma.
QC Implications of Sysmex XN-L XN-350 performance
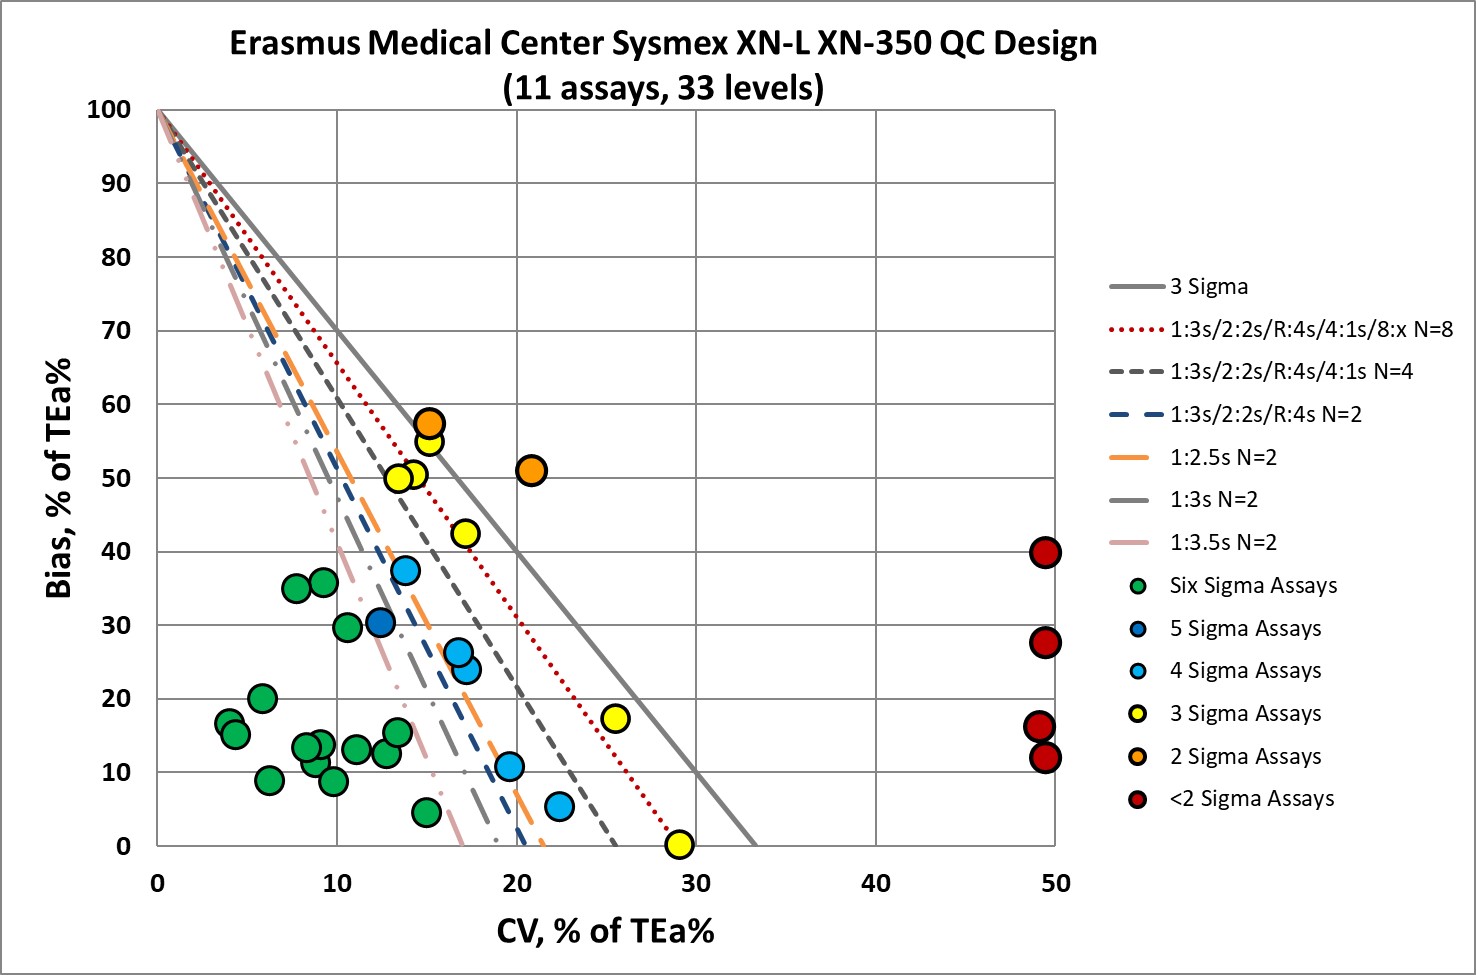
So the good news: a majority of the performance here indicates that no "Westgard Rules" are necessary.
About a third of the performance here needs all the "Westgard Rules" (and more) and probably should run QC every 50 or so patient samples.
Conclusion
For a small hematology device, XN-350 offers good performance, world class for several analytes. Depending on which levels of a test are important to the clinician and patient, there may be a case to minimize the use of Westgard Rules for a majority of tests. Given that small instruments typically have limited QC capabilities, the need to simplify those rules is paramount.
Many small devices on the hematology market, for so many decades, have been poor in performance. XN-350 is a step ahead.