Sigma Metric Analysis
A Roche Cobas 6000 in Ethiopia
Do major instruments perform the same all over the world? Or does reliability vary from region to region? We put this to the test, with data from a major laboratory in Ethiopia.
Sigma metric analysis of a Roche Cobas 6000 in Ethiopia
June 2021
Sten Westgard, MS
 |
The key reference works that provide the foundation for this analysis are Basic Method Validation, 4th Edition and Six Sigma QC Design and Control, 2nd Edition. |  |
We know about the gap between the developed and developing world healthcare, in many dimensions. But what's the difference on a Sigma metric level? If we take the same high performance, top of the line instrument that achieve great performance in an ideal laboratory, and we bring that to a more challenging environment, what happens?
Recently a major hospital in Ethiopia shared their performance data with us. They run 400-600 samples a day, running an average of 5 tests per sample. They have a water purification system. They have an automated generator, with air conditioning in the lab, monitored by temperature check twice a day. The lab was accredited with ISO 15189 in 2017.
The imprecision and bias data
The imprecision data is from Roche-provided controls. This is not ideal, and probably will generate optimistic results. The bias is calculated by comparison to the peer group in their EQA.
| Analyte | TEa% from (mostly) CLIA |
CV% | Bias% |
| Albumin | 10 | 3.04 | 0.82 |
| Albumin | 10 | 3.6 | 0.82 |
| ALP | 30 | 5.21 | 0.50 |
| ALP | 30 | 5.21 | 0.50 |
| ALT | 20 | 2.87 | 0.99 |
| ALT | 20 | 3.26 | 0.99 |
| Amylase- Total | 30 | 1.68 | 1.26 |
| Amylase- Total | 30 | 1.76 | 1.26 |
| AST | 20 | 1.98 | 0.38 |
| AST | 20 | 1.6 | 0.38 |
| Chloride | 5 | 2.75 | 0.48 |
| Chloride | 5 | 2.18 | 0.48 |
| Cholesterol Total | 10 | 2.2 | 1.89 |
| Cholesterol Total | 10 | 6.3 | 1.89 |
| Creatinine | 10 | 1.95 | 7.07 |
| Creatinine | 10 | 1.56 | 7.07 |
| Direct Bilirubin | 44.5 | 3.654 | 0.31 |
| Direct Bilirubin | 44.5 | 3.943 | 0.31 |
| Glucose | 10 | 2.13 | 0.18 |
| Glucose | 10 | 2.21 | 0.18 |
| HDL | 30 | 1.5 | 6.23 |
| HDL | 30 | 1.7 | 6.23 |
| Magnesium | 25 | 1.65 | 0.45 |
| Magnesium | 25 | 1.84 | 0.45 |
| Phosphate | 10.7 | 1.71 | 0.92 |
| Phosphate | 10.7 | 1.69 | 0.92 |
| Potassium | 25 | 1.99 | 1.92 |
| Potassium | 25 | 1.86 | 1.92 |
| Sodium | 3.5 | 1.52 | 0.76 |
| Sodium | 3.5 | 1.35 | 0.76 |
| Total Bilirubin | 20 | 2.941 | 1.99 |
| Total Bilirubin | 20 | 2.342 | 1.99 |
| Total Protein | 10 | 2.93 | 3.19 |
| Total Protein | 10 | 2.7 | 3.19 |
| Triglyceride | 25 | 3.1 | 1.54 |
| Triglyceride | 25 | 2.2 | 1.54 |
| Urea | 9 | 5.9 | 3.19 |
| Urea | 9 | 5.6 | 3.19 |
For the most part, the Total Allowable errors being used are from the CLIA regulations. Although for some analytes, like Phosphorous (CAP 10.7%) and Direct Bilirubin (Ricos 2014 44.5%), alternate sources for TEa are used. Note that the EQA analysis provides one bias, which is used for both control levels.
The specific control levels were not provided in this data set, so some TE:a goals were extrapolated (Potassium at 25%, Sodium at 3.5%). Other analytes that have a unit/percentage based goal, depending on the control level, were fixed at the percentage-based goal (Glucose, Urea, Total Bilirubin).
Sigma-metrics of Roche Cobas 6000
When we're using a comparison study to calculate bias, there's an extra step with the regression equation we take to calculate the bias.
Sigma-metric = ( TE:a - |Bias| ) / CV
For the first level of Albumin, this works out to
Sigma-metric = (10.0 - 0.82 ) / 3.04
= 9.18 / 3.04
= 3.02
Here are the rest of the metrics:
| Analyte | TEa% from (mostly) CLIA |
CV% | Bias% | Sigma (σ) |
| Albumin | 10 | 3.04 | 0.82 | 3.02 |
| Albumin | 10 | 3.6 | 0.82 | 2.55 |
| ALP | 30 | 5.21 | 0.50 | 5.66 |
| ALP | 30 | 5.21 | 0.50 | 5.66 |
| ALT | 20 | 2.87 | 0.99 | 6.62 |
| ALT | 20 | 3.26 | 0.99 | 5.83 |
| Amylase- Total | 30 | 1.68 | 1.26 | >6 |
| Amylase- Total | 30 | 1.76 | 1.26 | >6 |
| AST | 20 | 1.98 | 0.38 | >6 |
| AST | 20 | 1.6 | 0.38 | >6 |
| Chloride | 5 | 2.75 | 0.48 | 1.64 |
| Chloride | 5 | 2.18 | 0.48 | 2.07 |
| Cholesterol Total | 10 | 2.2 | 1.89 | 3.69 |
| Cholesterol Total | 10 | 6.3 | 1.89 | 1.29 |
| Creatinine | 10 | 1.95 | 7.07 | 1.50 |
| Creatinine | 10 | 1.56 | 7.07 | 1.88 |
| Direct Bilirubin | 44.5 | 3.654 | 0.31 | >6 |
| Direct Bilirubin | 44.5 | 3.943 | 0.31 | >6 |
| Glucose | 10 | 2.13 | 0.18 | 4.61 |
| Glucose | 10 | 2.21 | 0.18 | 4.44 |
| HDL | 30 | 1.5 | 6.23 | >6 |
| HDL | 30 | 1.7 | 6.23 | >6 |
| Magnesium | 25 | 1.65 | 0.45 | >6 |
| Magnesium | 25 | 1.84 | 0.45 | >6 |
| Phosphate | 10.7 | 1.71 | 0.92 | 5.72 |
| Phosphate | 10.7 | 1.69 | 0.92 | 5.79 |
| Potassium | 25 | 1.99 | 1.92 | >6 |
| Potassium | 25 | 1.86 | 1.92 | >6 |
| Sodium | 3.5 | 1.52 | 0.76 | 1.80 |
| Sodium | 3.5 | 1.35 | 0.76 | 2.03 |
| Total Bilirubin | 20 | 2.941 | 1.99 | 6.12 |
| Total Bilirubin | 20 | 2.342 | 1.99 | >6 |
| Total Protein | 10 | 2.93 | 3.19 | 2.33 |
| Total Protein | 10 | 2.7 | 3.19 | 2.52 |
| Triglyceride | 25 | 3.1 | 1.54 | >6 |
| Triglyceride | 25 | 2.2 | 1.54 | >6 |
| Urea | 9 | 5.9 | 3.19 | 0.98 |
| Urea | 9 | 5.6 | 3.19 | 1.04 |
The good news is that 40% of the performance is at Six Sigma, or higher. And a majority of the performance on the instrument is over 5 Sigma.
The bad news is a third of the performance is 3 Sigma and lower. Over 30% of the performance is below 3 Sigma.
Only a few analytes have any issues with bias (Creatinine has the largest problem with bias, which is eating up 70% of the TE:a budget). The major challenge, or the reason why more analytes have low Sigma-metrics, is due to high imprecision. A few analytes are actually "off the chart" because of very high imprecision.
Since there are a lot of numbers in this table, it's easier to see the graph.
Visual display of Sigma-metric Performance of Roche Cobas 6000 in Ethiopia
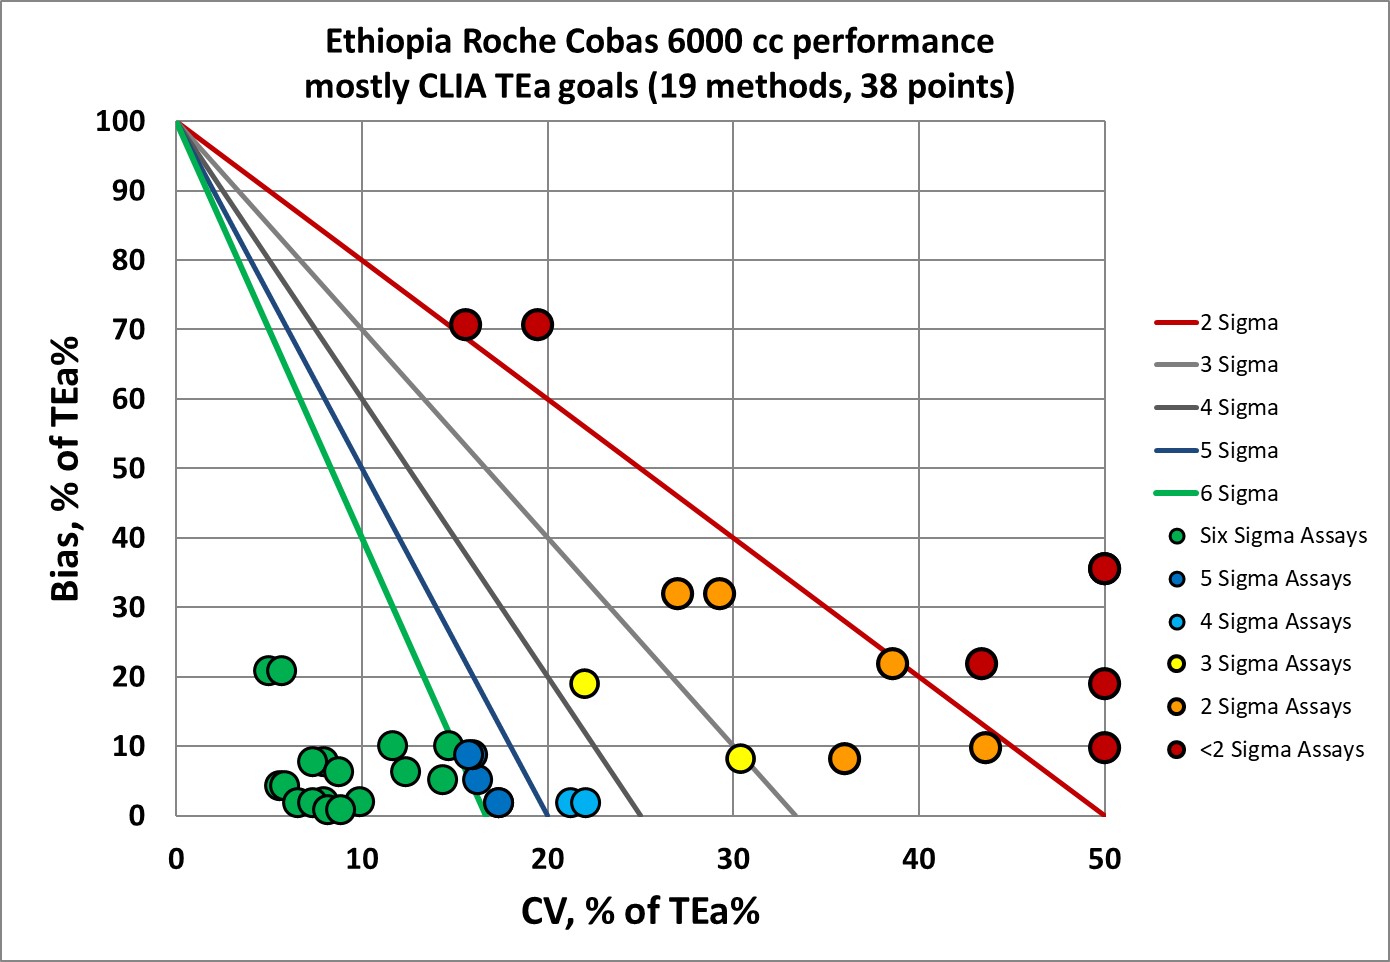
There are a nice cluster of points in the "bull's eye", but a concerning number of analytes are missing the target.
QC Implications of Roche Cobas 6000 performance
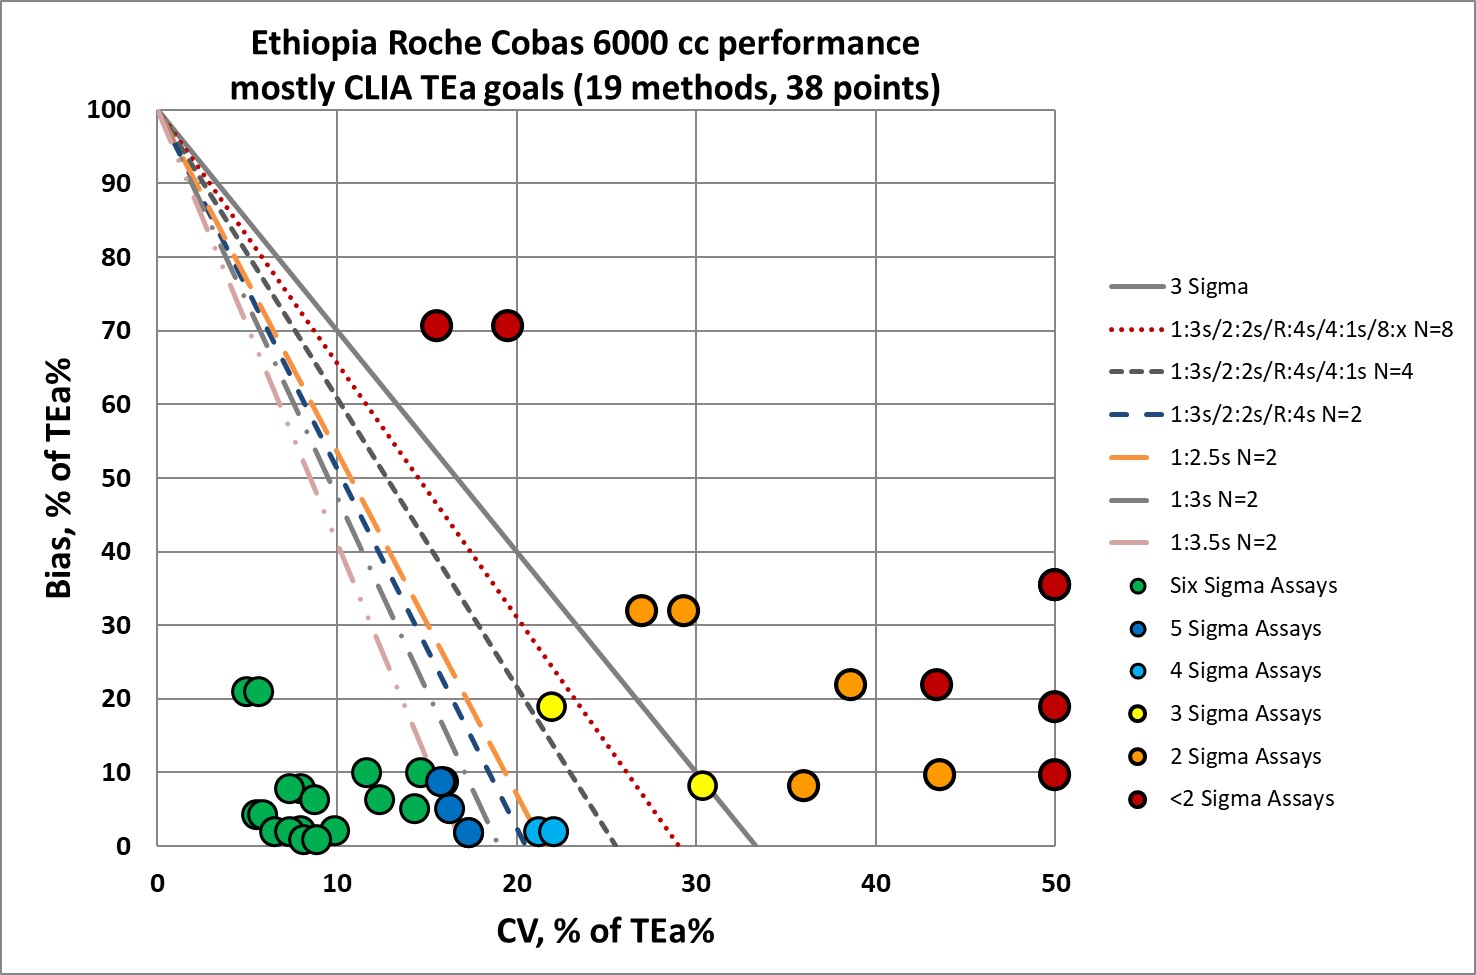
So the good news: a good number of the analytes don't need the "Westgard Rules." A simple 1:3s rule with 2 controls will be sufficient.
The bad news: for a significant number of analytes, the full "Westgard Rules" are not enough. More controls, more frequent running of controls, is warranted. Exactly the kind of additional QC burden you don't want to place on the shoulders of a developing laboratory.
And remember, this is the optimistic assessment. If independent, 3rd party controls were used to assess performance, we might see that the tests are performing worse.
It is not unusual to see challenging performance in the electrolytes for Roche cobas, nor is it uncommon to see challenging performance in albumin, creatinine and urea analytes even in the best laboratories. But the operating performance in this laboratory is lower that what we would typically see in a laboratory in Europe, the US, Australia, or select parts of SE Asia.
Conclusion
The laboratory quality divide is real. Simply installing advanced instruments in a laboratory doesn't make a laboratory high quality. The right infrastructure, training, support and staff education must be there, too. This laboratory in Ethiopia is exemplary in so many dimensions. It's difficult to see that despite their best efforts, they face significant challenges in keeping all their tests under control.