Sigma Metric Analysis
Beckman Coulter HMX
A frequent visitor to Westgard Web, Mary McDermott MT(ASCP), shared with us her performance data on the Beckman Coulter HMX hematology instrument. Data was collected for three controls, one lot each. No bias data was available, so the resulting metrics are provisional and incomplete. However, it is possible to calculate the allowable bias for specific levels of Sigma performance.
March 2007
 |
[Note: This QC application is an extension of the lesson From Method Validation to Six Sigma: Translating Method Performance Claims into Sigma Metrics. This article assumes that you have read that lesson first, and that you are also familiar with the concepts of QC Design, Method Validation, and Six Sigma. If you aren't, follow the links provided.] |  |
Another frequent visitor to Westgard Web, Mary McDermott MT(ASCP), recently shared her instrument performance data with us. This time the data is for a Beckman Coulter HMX instrument. Data was collected for three controls, one lot each. No bias data was available, so the resulting metrics are provisional and incomplete. However, it is possible to calculate the allowable bias for specific levels of Sigma performance.
The CVs and Sigma metrics
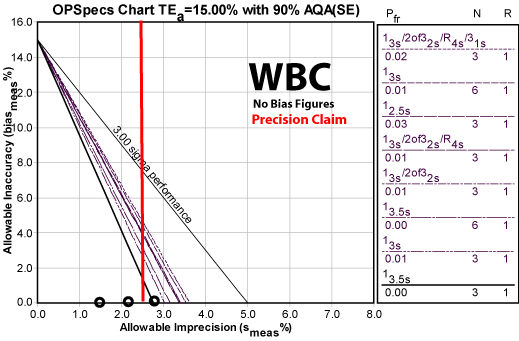
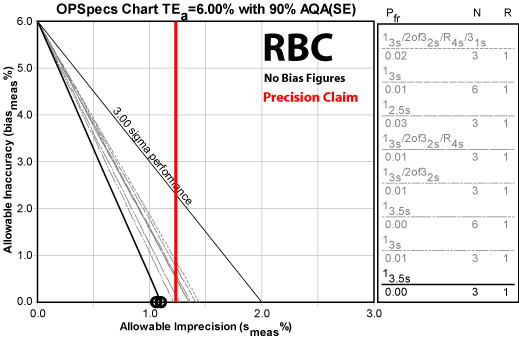
The TEa column lists the Total Allowable Error, as specified by the CLIA proficiency testing criteria. For Reticulocyte, which has no CLIA mandated quality requirement, data from the biological variation database was used to calculate an Biologic Total Error (TEba). The EZ Rules(r) 3 software was used to perform QC Design, generate OPSpecs charts, and recommend the proper control rules.
Leukocytes (WBC )
| WBC TEa=15% | Imprecision | Sigma metric | QC Rule Recommendation | Allowable bias at Six Sigma |
Allowable bias at Five Sigma |
| Low |
2.8%
|
5.4
|
13.5s N=3
|
none
|
1%
|
| Normal |
2.2%
|
6.8
|
13.5s N=3
|
1.8%
|
4%
|
| High |
1.5%
|
10.0
|
13.5s N=3
|
6%
|
7.5%
|
| Average of All Results |
2.2%
|
7.4
|
13.5s N=3
|
2.6%
|
4.2%
|
Not much needs to be said here. The method is world class.
Note the red vertical line displays the instrument claim by Beckman Coulter of 2.5% CV or lower. Even when this method does not meet that claim, as long as bias is zero, the 13.5s control rule can still be used. For the other levels, higher bias can be accepted.
Erythrocytes (RBC)
| RBC TEa=6% | Imprecision | Sigma metric | QC Rule Recommendation | Allowable bias at Six Sigma |
Allowable bias at Five Sigma |
| Low |
1.2%
|
5.0
|
13s N=3
|
none
|
none
|
| Normal |
1.1%
|
5.45
|
13.5s N=3
|
none
|
none
|
| High |
1.2%
|
5.0
|
13s N=3
|
none
|
none
|
| Average of All Results |
1.17%
|
5.15
|
13s N=3
|
none
|
none
|
Note that the CLIA quality requirement is quite tight. Given the performance of the method CV, there is no room for bias. Even though this method doesn't achieve Six Sigma, But even given that, only the low control of one of the studies falls significantly below Six Sigma.
Note that the data shows the instrument beating the precision claim on all levels.
Hemoglobin
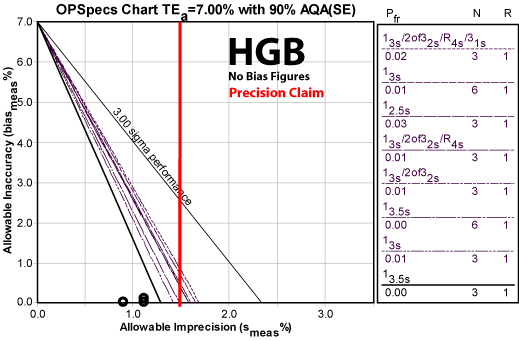
| HGB TEa=7% | Imprecision | Sigma metric | QC Rule Recommendation | Allowable bias at Six Sigma |
Allowable bias at Five Sigma |
| Low |
1.2%
|
5.83
|
13.5s N=3
|
none
|
1%
|
| Normal |
0.9%
|
7.61
|
13.5s N=3
|
1.5%
|
2.4%
|
| High |
1.2%
|
5.83
|
13.5s N=3
|
none
|
1%
|
| Average of All Results |
1.1%
|
6.4
|
13.5s N=3
|
0.5%
|
1.5%
|
This method is world class. Even with extremely wide limits, the method can tolerate significant bias.
Platelets
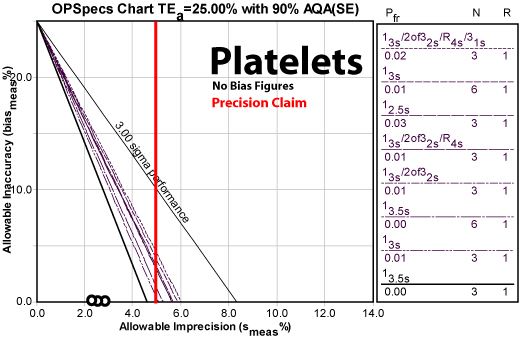
| PLT TEa=25% | Imprecision | Sigma metric | QC Rule Recommendation | Allowable bias at Six Sigma |
Allowable bias at Five Sigma |
| Low |
2.9%
|
8.62
|
13.5s N=3
|
7.6%
|
10.5%
|
| Normal |
2.5%
|
10.0
|
13.5s N=3
|
10.0%
|
12.5%
|
| High |
2.4%
|
10.4
|
13.5s N=3
|
10.6%
|
13.0%
|
| Average of All Results |
2.6%
|
9.7
|
13.5s N=3
|
9.4%
|
12.0%
|
Even though the CV values of this method are much higher than any of the previous analytes, the method performs the best of all. Clearly, success is relative: the previous methods had very tight quality requirements, while platelest have one of the largest allowable errors. Nevertheless, this is a world class method, capable of performing at Six Sigma even if large analytical biases are present.
Again, the method performs far better than the precision claim.
Conclusions
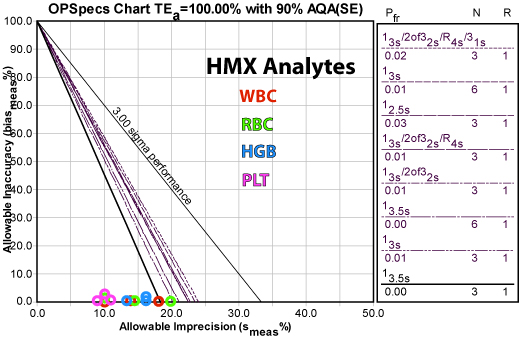
This is another instance where there is a lot of good news. The Beckman Coulter HMX achieves world class performance for nearly all the analytes at nearly all levels - in this laboratory. Using Normalized OPSpecs charts, we can merge and plot all the data of the methods on one chart, giving a graphic sense of how well this system performs.
Ultimately this laboratory chose to implement the following control practices:
| Analyte | QC Rule Implemented | False Rejection (Pfr) | Reduction from 12s rule N=3 Pfr (0.14) |
Reduction from full "Westgard Rules" N=3 (Pfr =0.02) |
| WBC |
13s with N=3
|
0.01
|
93% reduction in false rejections
|
50% reduction in false rejections
|
| RBC |
13s with N=3
|
0.01
|
93% reduction in false rejections
|
50% reduction in false rejections
|
| HGB |
13.5s with N=3
|
essentially zero
|
nearly 100% reduction
|
nearly 100% reduction
|
| PLT |
13.5s with N=3
|
essentially zero
|
nearly 100% reduction
|
nearly 100% reduction
|

