Sigma Metric Analysis
Two HbA1c POC methods
In a 2009 issue of Annals of Clinical Biochemistry, a study takes on two Point-of-Care HbA1c devices using two different reference methods. Both POC methods are standardized to the IFCC reference system and aligned to DCCT standards via the National Glycohemoglobin Standardization Program (NGSP). Both reference methods are also standardized against the IFCC reference method and traceable to DCCT and NGSP. If everything is standardized and traceable, there can't be any problems, right?
- The Precision and Comparison data
- Determine quality requirements at the critical decision level
- Calculate Sigma metrics
- Summary of Performance by Sigma-metrics chart and OPSpecs Chart
- Conclusion
October 2009
Sten Westgard, MS
 |
[Note: This QC application is an extension of the lesson From Method Validation to Six Sigma: Translating Method Performance Claims into Sigma Metrics. This article assumes that you have read that lesson first, and that you are also familiar with the concepts of QC Design, Method Validation, and Six Sigma. If you aren't, follow the link provided.] |  |
This application looks at a paper from a 2009 issue Annals of Clinical Biochemistry which examined two Point-of-Care (POC) HbA1c devices in comparison with two central laboratory analysers.
For reasons that will become clear, we're not going to use the names of the POC devices of the central laboratory methods.
We'll refer to these methods as:
- POC A
- POC B
- Central X
- Central Y
The Precision and Comparison Data
Analytical imprecision was assessed by analysis of two levels of quality control. Within-run (n=21)) and between-run (n=21) imprecision was calculated for POC A. For POC B, Central X, and Central Y was already assessed via in-house data.
| Instrument | Level | Total CV% |
| POC A | 6.0% | 3.8% |
| 10.4% | 3.7% | |
| POC B | 5.5% | 3.4% |
| 11.9% | 7.3% | |
| Central X | 5.2% | 2.5% |
| 9.6% | 2.1% | |
| Central Y | 5.6% | 3.0% |
| 10.0% | 1.7% |
Note that CLSI and current guidelines for Diabetes guidelines set the minimum precision performance at 5%, with 3% as the desired performance. Already POC B has a problem at the higher level with this guideline.
Analytical inaccuracy was assessed using 80 diabetic patient specimens. Deming regression analysis was performed. We don't know any more than that.
| Instrument | Comparison method | Slope | Y-intercept |
| POC A | Central X | 1.18 | -0.46 |
| Central Y | 1.14 | -0.37 | |
| POC B | Central X | 1.21 | -1.18 |
| Central Y | 1.21 | -1.36 |
We aren't given any correlation numbers here, so we must make an assumption that correlation is fine. In any case, the correlation number only tells us if linear regression is sufficient to calculate the bias. If the correlation was below 97% or so, Deming or Passing-Bablock regression would be a better method to assess inaccuracy. Since we're already using Deming regression, we're fine.
Based on the slope and y-intercept alone, it's hard to know which method is more accurate. POC B has a higher slope (proportional error), but also a larger (constant error) in the other direction. It may be that the two errors cancel each other out.
Now we need to align our inaccuracy data with our imprecision data. The easiest thing to do is to calculate the bias at the levels where the imprecision was calculated, using the regression equation.
Just to review this calculation, here's a layman's explanation of the equation:
NewLevelNewMethod = ( )slope * OldLevelOldMethod ) +Y-intercept
Then we take the difference between the New and Old level, and convert that into a percentage value of the Old level.
Example Calculation: Given POC A at level 6.0%, comparing to Central X method:
NewLevelPOC A = (1.18 * 6.0) - 0.46
NewLevelPOC A = 7.08 - 0.46
NewLevelPOC A = 6.62
Difference = 6.62 - 6.0 = 0.62
Bias% = 0.62 / 6.0 = 10.3%
Now here's the wrinkle with this study. Since we have two comparison methods, we have a chance to determine bias twice. We'll assess the data once with Central X and again with Central Y. Since the central laboratory methods are the comparison methods, we don't calculate bias figures for them.
| Comparison of POC devices to Central X | |||
|---|---|---|---|
| Instrument | Level | Total CV% | Bias% |
| POC A | 6.0% | 3.8% | 10.33% |
| 10.4% | 3.7% | 13.58% | |
| POC B | 5.5% | 3.4% | 0.45% |
| 11.9% | 7.3% | 11.08% | |
| Comparison of POC devices to Central Y | |||
|---|---|---|---|
| Instrument | Level | Total CV% | Bias% |
| POC A | 6.0% | 3.8% | 7.83% |
| 10.4% | 3.7% | 10.44% | |
| POC B | 5.5% | 3.4% | 3.73% |
| 11.9% | 7.3% | 9.57% | |
The details of these sources and quality requirements are discussed in Dr. Westgard's essay. The important thing to note here is that there is a pretty big difference between the requirements. Note also that the NACB guidelines do not specifically state any analytical quality requirement - at best, you can infer the the quality requirement based on their specifications for instrument performance. Finally, remember that while the Clinical Decision Interval quality requirement is almost the biggest number, using that number requires that the process take into account the known within-subject biological variation, which eats up a large amount of the error budget.
Given that we already know that the POC devices are less precise than the central laboratory methods, let's use the largest quality requirement: 15%.
Determine Quality Requirements at the decision level
Now that we have our imprecision and inaccuracy data, we're almost ready to calculate our Sigma-metrics. But we're missing one key thing: the analytical quality requirement.
For HbA1c, the quality required by the test is a bit of a mystery. Despite the importance of this test, and the sheer volume of these tests being run, CLIA doesn't set a quality requirement.
| Source |
Quality Requirement
|
| CLIA PT |
No quality requirement given
|
| CAP PT 2007 |
Target value ± 15%
|
| CAP PT 2008 |
Target value ± 12%
|
| NACB 2007 Draft |
"interassay CV<5%
(ideally <3%)" |
| Clinical Decision Interval |
Target value ± 14%
(biologically based) |
Calculate Sigma metrics
Now the pieces are in place. Remember, this time we have two comparison methods, so we're going to calculate two sets of Sigma metrics - one using Central X for bias and one using Central Y.
Remember the equation for Sigma metric is (TEa - bias) / CV.
Example calculation: for a 15% quality requirement, with POC A and Central X, at the level of 6.0% HbA1c, 3.8% imprecision, 10.33% bias:
(15 - 10.33) / 3.8 = 4.67 / 3.8 = 1.23
| Sigma metrics (comparison to Central X) | ||||
|---|---|---|---|---|
| Instrument | Level | Total CV% | Bias% | Sigma metric |
| POC A | 6.0% | 3.8% | 10.33% | 1.23 |
| 10.4% | 3.7% | 13.58% | 0.38 | |
| POC B | 5.5% | 3.4% | 0.45% | 4.28 |
| 11.9% | 7.3% | 11.08% | 0.54 | |
| Comparison of POC devices to Central Y | ||||
|---|---|---|---|---|
| Instrument | Level | Total CV% | Bias% | Sigma metric |
| POC A | 6.0% | 3.8% | 7.83% | 1.89 |
| 10.4% | 3.7% | 10.44% | 1.23 | |
| POC B | 5.5% | 3.4% | 3.73% | 3.32 |
| 11.9% | 7.3% | 9.57% | 0.74 | |
Recall that in industries outside healthcare, 3.0 Sigma is the minimum performance for routine use. Clearly, in healthcare, we've been holding POC devices to a lower standard of performance.
Also note that with the Central laboratory methods, if you calculated the Sigma metrics (assuming no bias), you'd get Sigma metrics of 5 and higher. The central laboratory methods meet the needs of patients, but the POC devices are not doing so well.
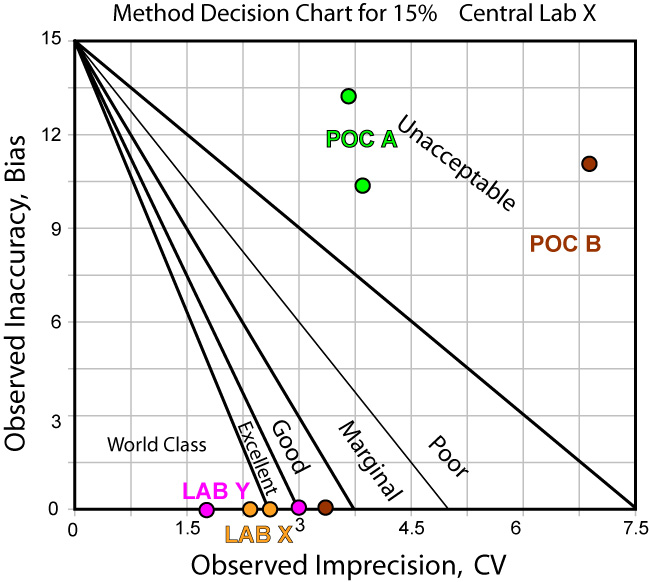
Summary of Performance by Sigma-metrics Method Decision Chart and OPSpecs chart
Not only can we use tools to graphically depict the performance of the method - we can use those tools to help determine the best QC procedure to use with that method.
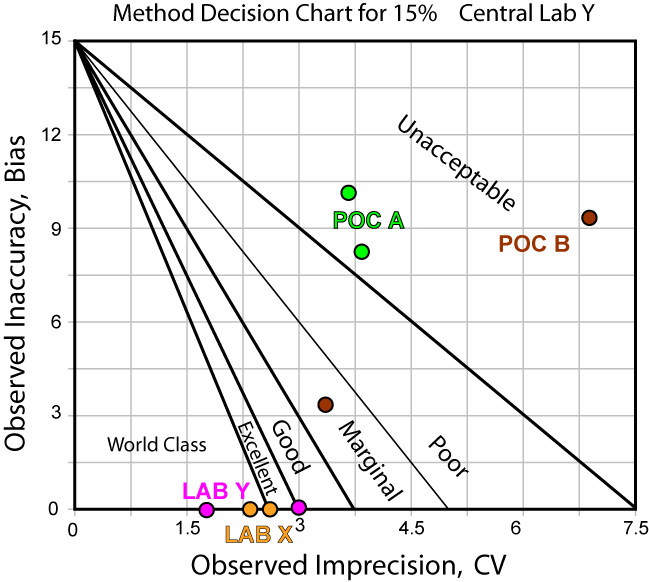
The news is not that much better when we use Central Laboratory Y as the comparison method:
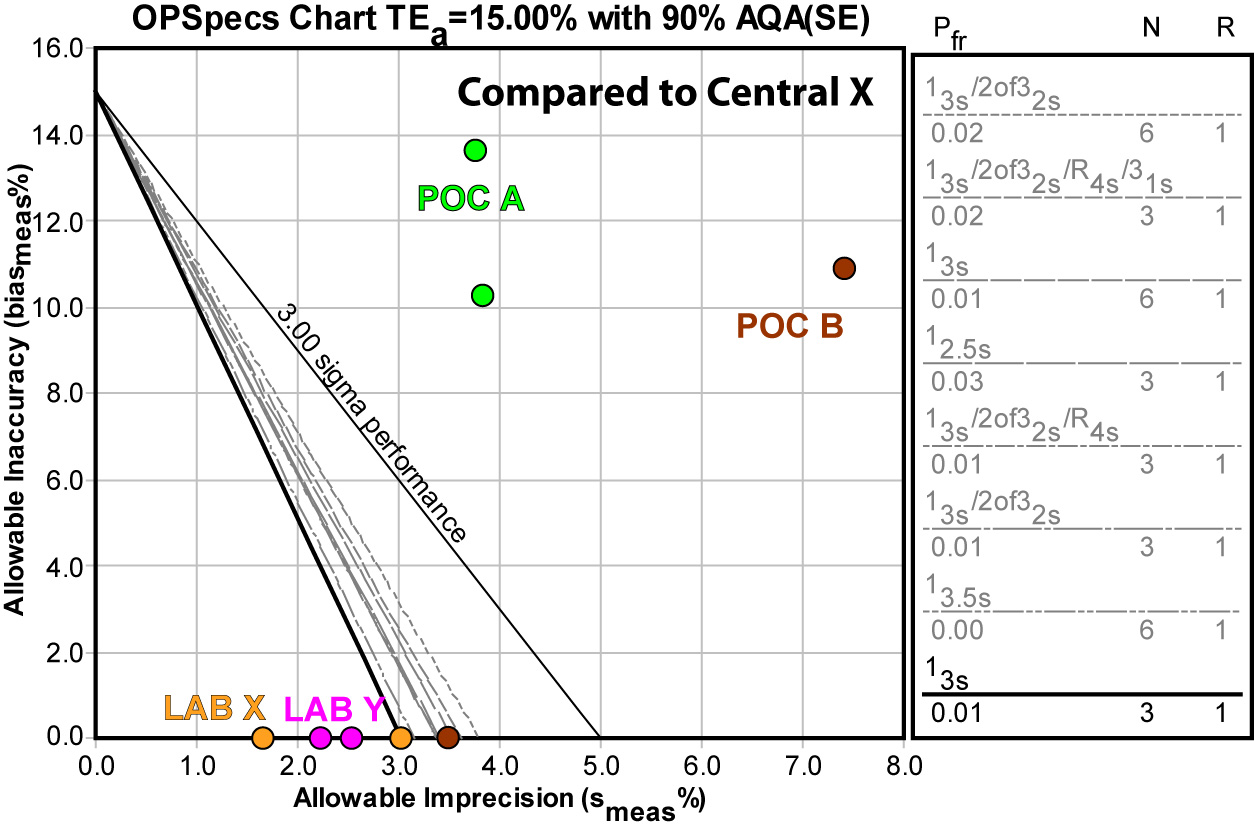
Using EZ Rules 3, we can express the method performance on an OPSpecs (Operating Specifications) chart:
Again, using the Central Laboratory method Y doesn't give us any better news:
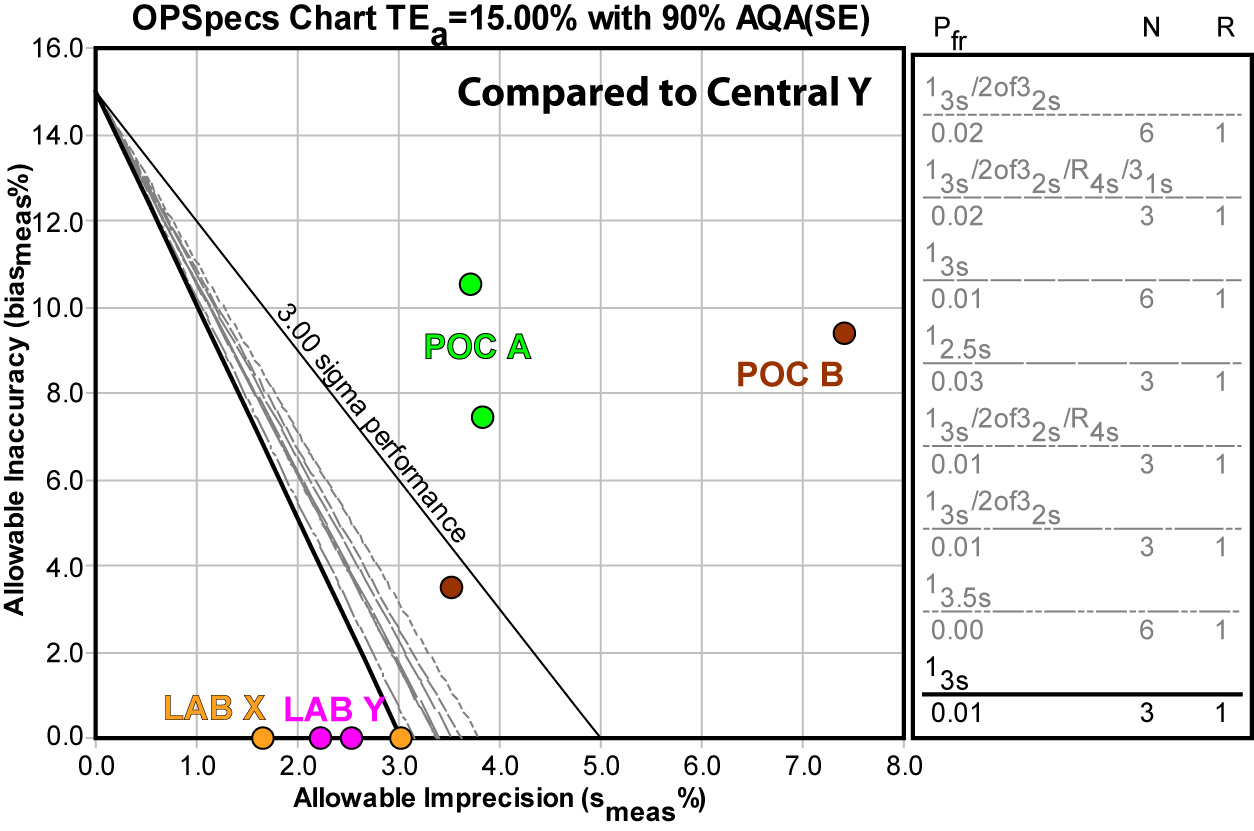
The upshot of using either comparison method is that neither POC method can be controlled by any QC procedure.
Conclusion
Interestingly, the use of two comparison methods provides more conclusive reinforcement of the problem with these POC devices. But as the graphs show, not only is bias a problem, imprecision is also a challenge.
It's also worth considering that we were using the largest quality requirement (15%) available. Given that CAP is planning to reduce the their PT quality requirement for HbA1c from 15% to 12% soon, as part of a national effort to tighten the goal and spur improved performance, these methods are not only not fit for purpose now, they are going to be even less fit for purpose in the future.
