Six Sigma
Standardizing the Sigma-metric
As the Sigma-metric grows in popularity and usefulness, scrutiny on the calculation has grown. The time for standardizing the Sigma-metric, as much as can be done, is upon us.
Standardizing (or Standardising?) the Sigma-metric
A review of challenges and possible remedies to Sigma-metric variability
January 2024
Sten Westgard, MS
In recent years, the pace of Sigma-metric publication and implementation has accelerated. With the proliferation of metrics has come additional scrutiny of the equation and calculations. Some of these have been published:
- Sigma metrics in laboratory medicine: A call for harmonization, Clin Chim Acta. 2022 Jul 1:532:13-20. doi: 10.1016/j.cca.2022.05.012, Loris Wauthier, Laura Di Chiaro , Julien Favresse
- A comparative analysis of Sigma metrics using conventional and alternative formulas Clin Chim Acta. 2023 Sep 1:549:117536. doi: 10.1016/j.cca.2023.117536, Kamil Taha Uçar, Abdulkadir Çat
- Comparison of Sigma metrics computed by three bias estimation approaches for 33 chemistry and 26 immunoassay analytes Adv Lab Med. 2023 Jul 4;4(3):236-245. doi: 10.1515/almed-2022-0095. Serif Ercan
- Determination of Sigma metric based on various TEa sources for CBC parameters: the need for Sigma metrics harmonization. Seyda Ozdemir and Fatma Ucar. J Lab Med 2022; 46(2): 133–141 https://doi.org/10.1515/labmed-2021-0116
Not to belabor these papers, they can be boiled down to a simple truth: if you put in different inputs, you will get out different outputs. Remember, the Sigma-metric equation is composed of three variables:
[ Sigma-metric = (TEa - |bias|) / SD for units, or Sigma-metric = (TEa% - |bias%|) / CV ]
In this article, we will discuss how to standardize, if possible, each of those variables.
Can we standardize the allowable total error, TEa?
It would seem naively apparent that we should all be aiming at the same target, using the same performance specification, trying to achieve the same goal, but that is most definitely not where laboratory medicine is right now. As a series of international conferences has shown, from Stockholm to Milan to Prague, not only is there no agreement on assay performance specifications, there is not even one approach, there is not even one guiding philosophy. As Prague demonstrated, there are strong preferences among metrologists to abandon the concept of TEa and Total Error entirely, so that the measurement uncertainty (mu) approach can dominate all discussion.
Accepting for a moment that bias and imprecision and a combination of the two (total error) exist, the Milan Hierarchy still reigns as the paradigm for performance specifications. And that provides three distinct types of performance specifications:
- Clinical. Goals that are based on the clinical use of the test
- Biological. Goals that are based on the known biological variability of the parameter.
- State of the Art. A catch-all category for everything else. These could be goals set by external quality assurance (EQA) or proficiency testing (PT) programs, regulatory bodies, expert groups, etc.
If you think this hierarchy means that there are three possible goals for every parameter, you're underestimating the complexity. Because every country or EQA/PT program can potentially have a different goal. As one glance at our consolidation performance specification page reveals, the German Rilibaek and the Chinese WS/T 403-2012 standards and the CLIA 2024 goals do not agree, most of the time.
Getting all the countries in the world and all the EQA/PT programs in the world to agree on a single performance specification for every analyte would be ideal, but it's one of the least likely things to occur in our future.
The best we can do here is make sure that every Sigma-metric analysis, study, or publication is clear about which goals have been chosen. For our part at Westgard, our consolidated pages also indicate a recommendation for which goal to use, a performance specification that is enforced by all laboratories in our global Sigma VP program.
Can we standardize the bias?
There is far more agreement on how bias should be calculated. This is where the Traceability movement meets with practical laboratory operation. The ideal way to determine bias is to compare your method against a reference method or a reference material.
One slight detail about this: it almost never happens. Most laboratories cannot afford to participate in an EQA/PT program that actually provides a true value for comparison. It's too expensive. In many cases, also, it is not possible. Either there is no program offering, or the method itself has no reference method. In rare cases, there may even be more than one reference method for the same assay, thus, you can have a true bias but it will differ than another true bias.
So most laboratories determine bias in a different way, all of them imperfect. A laboratory can compare its values against a group or peer mean from EQA/PT. A laboratory can compare its values against the peer group mean of a peer comparison program. All of these different peer groups can have different peer group means due to the variability of the lab population.
Or the control materials the laboratory is using will come with an assigned or target value. The downside of these assigned means is that sometimes those are generated with only a handful of laboratories or instruments, or a small group of participating peer labs, which also will have the same challenges of population variability.
If the perfect solution is out of reach, the least bad choice is the peer group mean. Under the right circumstances, a lab peer group can be made up of hundreds of laboratories, with thousands, even tens of thousands, of data points, and can be accessed more frequently than any other approach. The difference between a laboratory and all of its peers may not be perfect, or "true", but it is undoubtedly relevant.
Some other bias articles from our media:
- A complete discussion of all the biases: https://www.westgard.com/what-about-bias.htm
- The unbearable persistence of bias: https://www.westgard.com/persistence-bias.htm
- Q & A: what's the basis of bias? https://james.westgard.com/the_westgard_rules/2016/10/q-a-the-basis-of-bias.html
- Is bias a shift or an uncertainty: https://www.westgard.com/bayat-bias-shift-or-uncertainty.htm
- Biased about Bias (refuting the magical measurement uncertainty thinking): https://www.linkedin.com/posts/sten-westgard-683770_im-biased-about-bias-when-it-comes-to-magical-activity-7136034855066226688-D500/
Can we standardize our imprecision?
Imprecision is even easier to agree about, you even have both the mu metrologists and any total error proponents in agreement: imprecision can be measured by controls. There are a limited number of ways to determine imprecision, and mostly they are driven by time.
Within-day, repeatability is a very short-term estimate of imprecision, and is not to be trusted, should not be used in a Sigma-metric calculation.
Total imprecision, or within-lab reproducibility, takes into account the performance over multiple days, multiple staff, etc., and is considered a more reliable estimate of imprecision.
Cumulative imprecision, which can mean anything from 3-6 months of accumulated data, is considered the best estimate of imprecision, it will take into account variable performance found in different reagent lots, calibration, etc.
In short, the more data you have on imprecision, the better.
The type of controls, however, has a big impact on the imprecision results.
Manufacturer controls, which are very common throughout the world, and in some areas like hematology, the dominant practice, have the convenience of being “free” (they’re not), and coming bundled with the instrument. The downside is that the manufacturer has every incentive to cut corners on the controls, to “tweak” the controls so that they always provide in-control results, and they are predominantly accompanied by massive ranges that make it even less probable for QC to be out. If the manufacturer provides you the controls, it’s not surprising that they are biased toward keeping you docile and content, regardless of the true status of the method. No wonder that the last two editions of ISO 15189 has strongly recommended laboratories use an independent, 3rd party control.
Independent controls are to be favored because the control is not tied to the manufacturer. The 3rd party control has more incentive and more probability to give an honest look at the performance of the method.
Both manufacturer and 3rd party controls have a weakness, however, in the form of their matrix. In the face of customer demands for ever cheaper, more consolidated, more convenient, longer lasting controls, more preservatives and stabilizers are added to the control material. Thus, the resulting product, while economical, is less like a true human specimen. This gives the instrument and method manufacturer to claim “matrix effect” whenever a 3rd party control says the method is “out.” The laboratory is often caught between the instrument manufacturer and the control vendor fighting over who is wrong and who is right.
The ideal control is an actual patient sample, or a control that is commutable – behaves exactly as a real patient sample. Commutability is a bit hard to define – perfection may be impossible, even within pooled patient samples. Pooled patient sample controls is the old school way of running QC, performed in the days before the control manufacturers even existed. As control material prices continue to climb, however, the idea is making a comeback. In some parts of the world, the expense of 3rd party controls is out of reach, and labs are reverting back to the old ways.
On the one hand, pooled patient samples are “free” – the laboratory makes use of patient samples already collected. And these samples are completely commutable, they are patient samples. The other hand, however, is pretty strong. It takes staff time to pool and aliquot and preserve the samples. Some parameters don’t have a long shelf life as patient pools. And since the HIV virus entered the bloodstream of humanity in the 1980’s, there are serious additional risks to handling patient samples. For many laboratories, the additional risk outweighs any benefits.
The practical standard is to insist on 3rd-party controls, measured over a longer period of time, where the controls are as commutable as possible.
One final Standardization/Standardisation: The calculation itself
There are two ways to calculate a Sigma-metric: in percentages, and in units. In most cases, these will yield equivalent metrics. But in unusual situations, the two calculations can diverge. When biases grow to 30% or more of the allowable total error, the Sigma-metrics of the two approaches begin to have significant differences.
Since the units-based calculation is in the “raw” measurements, while the % based calculation is a convenient derivation from the raw measurements, the “true” calculation is in the units.
More importantly than the equation itself, however, is how you decide to determine bias. Bias is compared against something. So if you choose to compare bias against a higher number, you will have a lower percentage. If you choose to compare bias against a lower number, you will have a higher percentage. The bias is the same, but its size relative to the comparator changes, thus creating a different metric. Keeping the bias in units almost avoids this problem.
Let’s give a quick example: Given a reference value of 100 and a measured value of 150, what is the bias? In units, it’s 50. But the bias against the reference value is [150-100 = 50/100 = 50%] 50%, while the bias against the measured value is [150-150 = 50/150 = 33%] 33%

As the difference between the target and the observed mean, the difference in bias% grows as well.
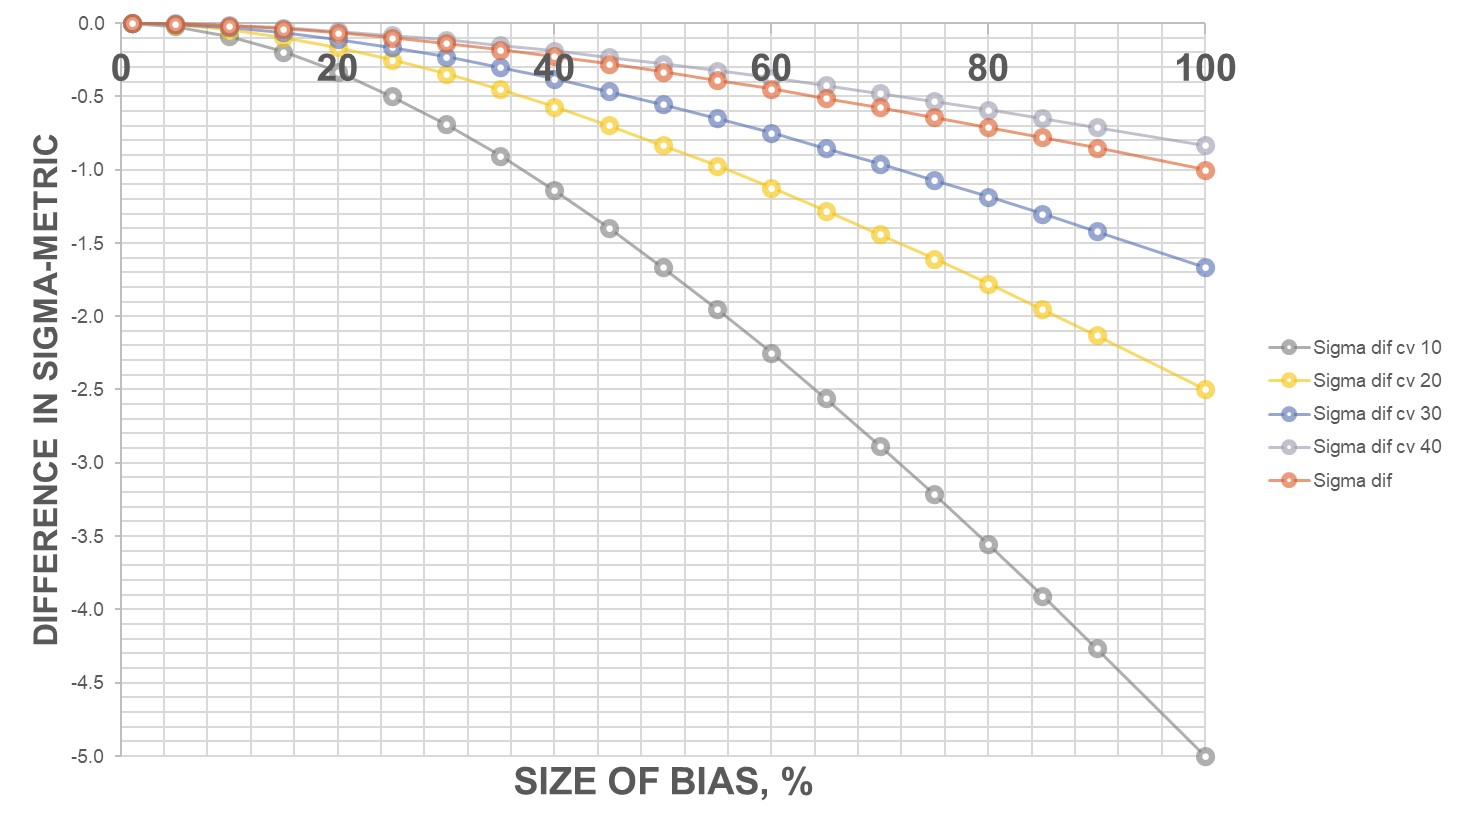
As the CV grows larger, the bias% is smaller and smaller, because the bias is overwhelmed by the imprecision.
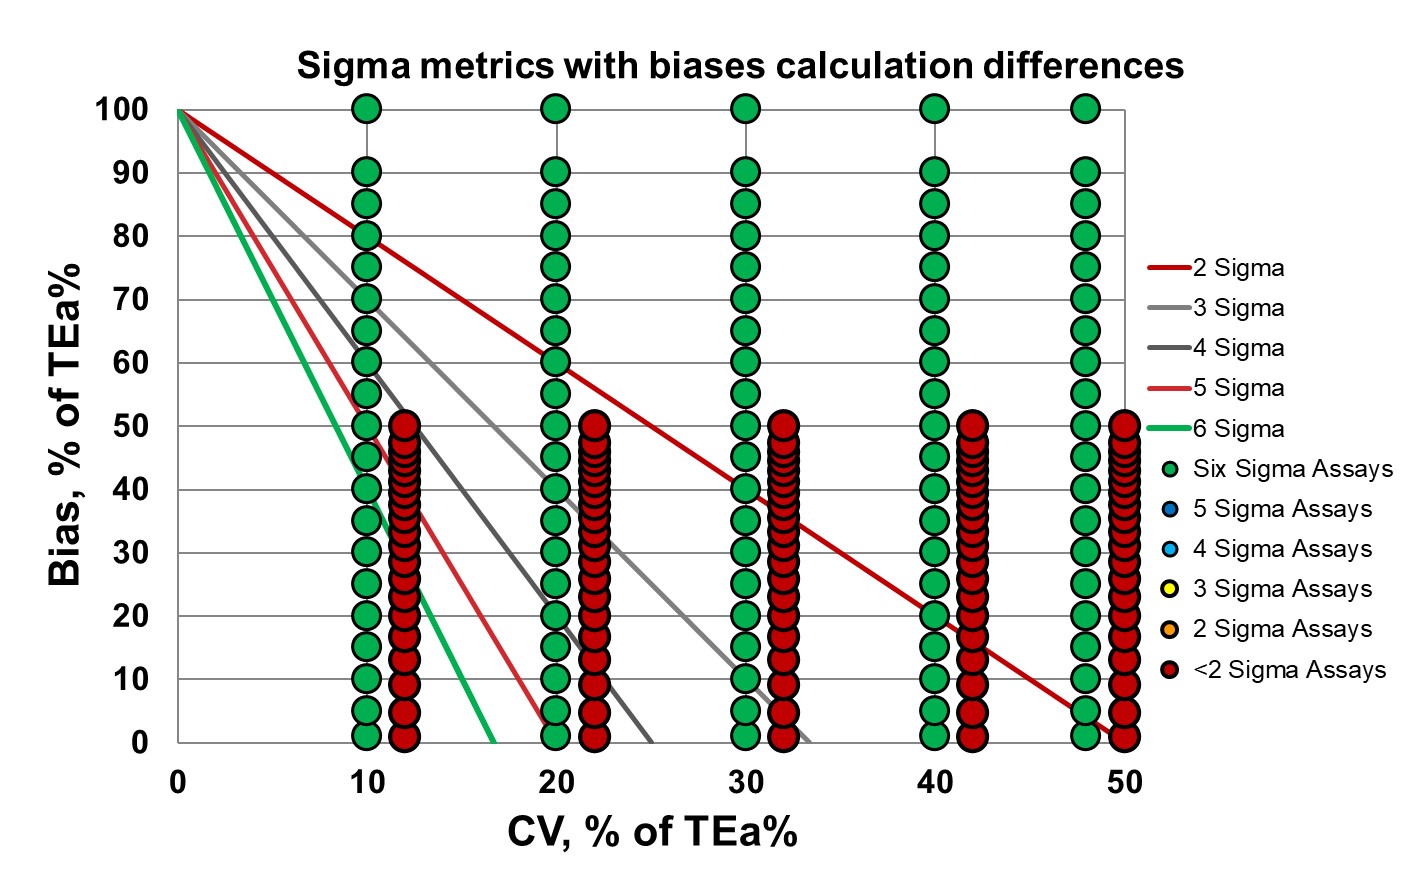
This Normalized Method Decision chart shows that as the imprecision grows, the Sigma lowers, and the difference in Sigma from differing biases wanes. As your method gets worse, it matters less how bad the bias difference is.
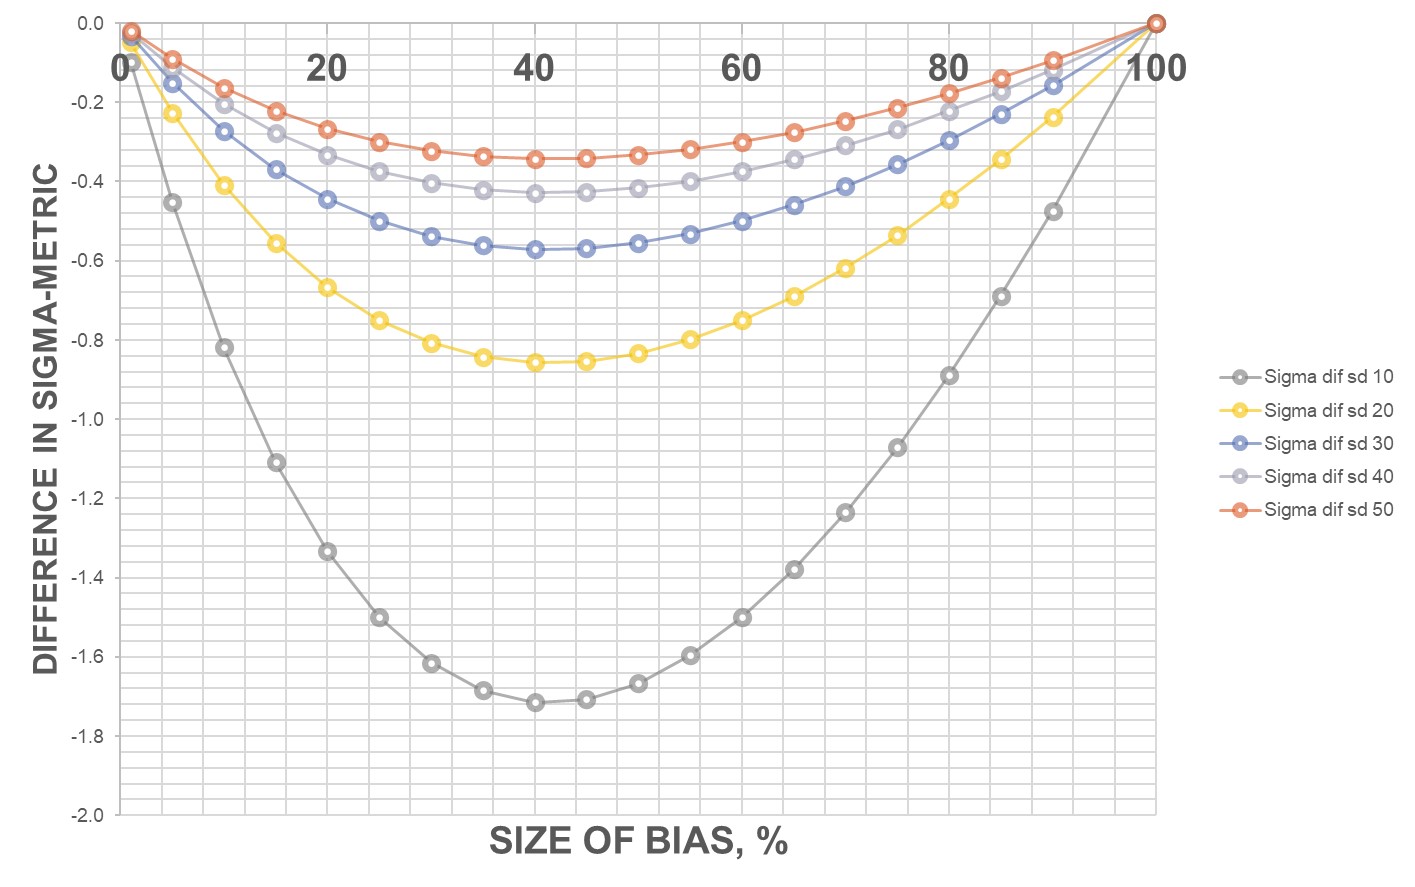
If you go to the whole range, once the bias reaches 100% of the allowable total error, all the Sigma metrics converge. Once the bias nears the size of the allowable total error, it no longer matters the size of the imprecision.
It almost becomes a matter of perspective. Are you viewing the bias from the vantage point of the reference value (the truth), or from the vantage point of where you actually are (relative bias). And if there is no reference value, and its just one value compared to another value (maybe instrument X is being compared to instrument Y, with neither one considered the “true value”).
This perspective issue doesn’t really get erased by calculating the Sigma-metric in units, either. Unit-based calculations will make only the challenge visible. If the goals are first expressed as percentages, the problem still occurs. If CLIA says 8% allowable total error for albumin, and you have an albumin measurement of 4.8, with an expected value of 5.0, what is the allowable total error in units? Is it 0.08 * 4.8 or 0.08 * 5.0? Our own answer is to take the expected value, comparative value, peer group mean value, etc., as the relative “truth.” Sometimes a relative bias is still relevant.
Conclusion
There are some ideals we'd like to achieve in our goal of standardizing the Sigma metric. Most of them are out of reach, unfortunately, but we can make improvements. Here at Westgard, we'll be implementing a new protocol to rank the quality of each Sigma metric, to make the quality of each study more transparent to readers, and to encourage better practices across the field.