Basic Method Validation
True or False? You can validate a qualitative method
Yes, you can validate the performance of a qualitative method. No, you won't run the same statistical studies you would with a quantitative method. The positive: you run fewer studies for qualitative tests. The negative: they are a bit harder to set up and interpret.
Validation of Performance of Qualitative Tests
James O. Westgard and Sten A. Westgard
June 2021
Most laboratory analysts are experienced in validating the performance of quantitative tests and have developed standard operating procedures (SOP) for doing so. It is not as likely they have SOPs for validating qualitative tests that provide only binary results, yes/no, positive/negative answers. To begin, we compare the validation process and experiments for quantitative tests with those for qualitative tests to understand the meaning of precision and accuracy in binary test results, analytical sensitivity in terms of the limit of detection and the cutoff interval, and analytical specificity in terms of cross reactivity and interference.
With the recent COVID-19 pandemic, many new qualitative tests were introduced, including PCR and antigen tests for diagnosis of disease and antibody tests for following the progress of disease and assessing immunity. We will use these tests to illustrate applications of the concepts and principles here.
Validation of Qualitative Tests
Qualitative tests provide binary results in the form of yes/no answers, or positive/negative results. A pregnancy test is a good example of a binary output. The result is the patient is pregnant, or not, with no possibility of being just a little bit pregnant. Blood bank screening tests also provide positive/negative results, but often use a cutoff to convert an internal continuous response to a binary result. The existence of an internal continuous response means there are possibilities to apply some of the experiments used for quantitative test methods. For those with only a binary response, different experiments and data analysis are necessary. One of the key guidance documents for “good laboratory practice” is CLSI EP12 [1]. The latest version of this guideline is being revised by CLSI, when the 3rd edition comes out, get hold of it.
Performance characteristics of quantitative vs qualitative tests
First, we need to distinguish different types tests based on the measurement scale being used:
- Quantitative tests that have a continuous response provide numerical results over a reportable range;
- Qualitative tests that have an internal continuous response (ICR) that is converted to a binary result by use of a cutoff (CO) to provide binary results;
- Qualitative tests that produce binary results directly without any internal continuous response;
- Qualitative PCR tests producing binary results from a discontinuous internal response (discrete Ct values, threshold cycle numbers for molecular tests).
The following table shows how the performance characteristics of these different types of tests can be determined from experimental studies. The approach for quantitative methods is shown on the left side. Typically, analytical sensitivity is assessed from experiments for limit of detection (LoD) and precision from a replication experiment. A linearity experiment characterizes the range of concentration for which performance is valid and results can be reported. A reference range is established for “normals” to aid the interpretation of test results. Accuracy in terms of trueness or bias is assessed from a comparison of methods experiment and in terms of total error is estimated by including the effects of the replication experiment. Recovery and interference experiments are used to evaluate the analytical specificity of the method.
|
Performance Characteristic |
Quantitative Test |
QuaL ICR |
QuaL +/- Binary |
QuaL +/-PCR |
|
Analytical Sensitivity |
Detection Limit Exp (LoD) |
LoD |
LoD or Cutoff Interval C5 to C95 |
C95 as LoD |
|
Precision |
Replication Exp |
Replication |
||
|
Reportable Range |
Linearity Exp |
Cutoff Interval C5 to C95 |
||
|
Reference Range |
Normal Values Study |
|||
|
Trueness Bias |
Comparison of Methods Exp |
Clinical Agreement Study |
Clinical Agreement Study |
Clinical Agreement Study |
|
Accuracy, Total Error |
Comparison + Replication |
|||
|
Analytical Specificity |
Recovery Exp |
Cross Reactivity |
Cross Reactivity |
Cross Reactivity |
|
Interference Exp |
Interference |
The experiments here are not shown in the typical order they are performed for quantitative tests because the intent here is to show how these experiments relate to what studies are needed for qualitative methods. Analytical sensitivity and precision can be estimated in the traditional manner for qualitative tests that have an internal continuous response (ICR). Because these experiments focus on low concentrations, an experiment for LoD could also characterize precision. Note that multiple characteristics of a quantitative test are reduced to just a few characteristics for a qualitative test. For example, reportable range and reference range have little relevance when there is a binary result that depends only on a cutoff. However, the cutoff interval is critical for describing the uncertainty in a binary test. CLSI EP12 describes this interval as the “imprecision interval”, where C50 is the concentration that leads to 50% positive results. C5 represents the concentration at which 5% of results are positive and C95 is the concentration at which 95% of the results are positive. Characteristics of accuracy reduce to a clinical agreement study plus experiments for analytical specificity that may involve study of specific interference, but more generally focus on cross-reactivity. Therefore, there are three characteristics that describe the performance of a qualitative test.
- Precision (analytical sensitivity) that is characterized by the width of uncertainty of the cutoff interval, i.e., the imprecision interval, or characterized by the limit of detection when LoD is used as the cutoff.
- Accuracy is characterized by the clinical agreement of the new test with a comparative test or by comparison with the diagnostic classification of the patient.
- Analytical specificity focuses on interference and cross-reactivity studies.
If you review the performance claims for any of the new COVID-19 tests released under the original FDA Emergency Use Authorization (EUA), usually there is only minimal information provided. On May 4, 2020, the FDA updated its guidance for EUA serology tests [2]. There was still little emphasis on analytic sensitivity in terms of detection limit or cutoff interval, but there were increased demands for higher numbers of real patient specimens for the Clinical Agreement Study, more guidance for cross-reactivity studies, and a specific requirement to demonstrate class specificity if a test provides separate estimates of IgM and IgG. More extensive studies would have been required by the traditional 510k process. For laboratories seeking to ensure patient safety, these validation studies still have to be performed.
This FDA guidance fits into the general framework of experimental studies described here, but during the pandemic the primary emphasis was on the Clinical Agreement Study. A claim for LoD was required, but there was less attention to the experimental design and statistical analysis of that data. Cross reactivity was initially often handled via computer assessment of similar and related structures, then later guidelines provided more specific requirements for experimental studies. All in all, it was a learning experience for many laboratories. As the "emergency use" era draws to a close, we should expect more rigorous and well-defined validation guidelines to be imposed by inspection and accreditation.
Binary data – what calculations are useful?
The binary nature of qualitative test results imposes limitations on experimental studies. We have distinguished different types of qualitative methods based on whether there was an internal continuous response (likely the case in immunoassays such as ELISA), only a binary output (lateral flow assays), or a discrete numerical response such as the threshold cycle value (Ct) for RT-PCR tests.
Coin flipping provides insight for dealing with binary responses. A coin flip will give either a head or tail result. If you perform a replication experiment, flipping a coin say 20 times, you expect the results will show 10 heads and 10 tails. You might describe the results as 10 out of 20 heads, or a detection rate of 0.50 or 50%. For 20 flips, you may also possibly end up with 8 heads and 12 tails for a “hit rate” of 0.40 or 40%, or 13 and 7 (0.65 or 65%), etc. The proportion is expected to be from 0.30 to 0.70 (with 95% confidence) for a small experiment of 20 replicates. For a large experiment, such as 10,000 flips, the proportion of results will be much closer to the theoretical expectation of 0.50 (ranging from 0.49 to 0.51).
For assessing accuracy of a qualitative test, the Clinical Agreement Study utilizes Percent Positive Agreement (PPA) to characterize clinical sensitivity and Percent Negative Agreement (PNA) to characterize clinical specificity. CLSI EP12 recommends they be presented as percentages along with their 95% confidence limits [1].
For precision, consider that the coin flip exercise is a replication experiment. The variability in the results depends on the random error of the test, which can also be described as the uncertainty of the measurement. Given that the test provides only positive or negative results, it is not possible to calculate a mean and SD. The effects of random error still exist, but they are demonstrated by the uncertainty in classifying a patient result as positive or negative in the range of the cutoff interval. C50 of the cutoff interval is the medical decision level for the binary classification of the patient test result.
How can proportions describe precision?
We commonly think about precision or variation in terms of a normal curve that is described by its mean and standard deviation. But we can’t calculate the mean and SD of binary results. Instead the proportion of positive results can be used to describe the cumulative probability distribution for a normal curve, as shown below. Remember, we commonly talk about the area under the normal curve where half the observations are on one side of the mean, 68% are between the mean +/- 1 SD, and 95% are between the mean +/- 2 SD. Another way of describing this same information is to express the total or cumulative observations in relation to the number of SDs. For example, we expect there will be 2.5% of the observations up to mean -2.0 SD, 16% up to the mean – 1.0 SD, 50% up to the mean, 84% up to the mean + 1 SD, and 97.5% up to the mean + 2 SD.
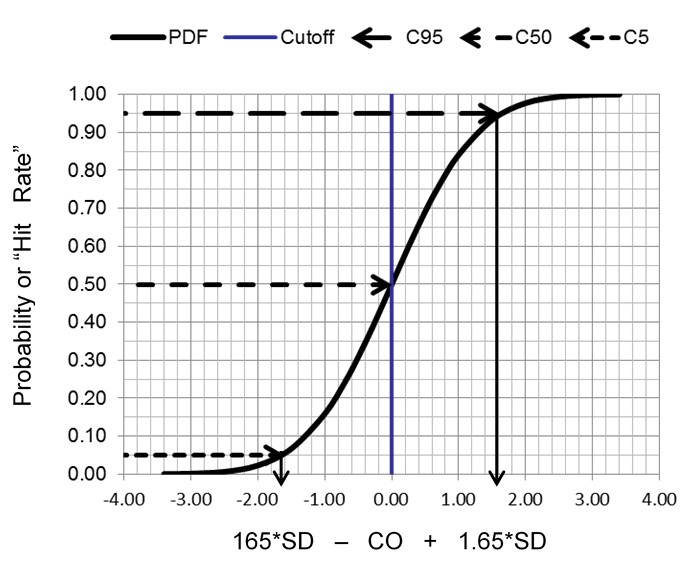
The key idea here is that random variation, or imprecision, can be characterized by the cumulative distribution function for a normal or Gaussian curve. Instead of the usual picture of a symmetrical normal distribution (calculated from the mean and SD), the cumulative distribution is an S-shaped curve that shows the proportion of positive results, or rate of positive results, that accumulate from the low through the high end of a normal distribution. By calculating proportions at certain locations along the normal curve, we can characterize the random variation of a binary measurement process. The most important application is to characterize the limit of detection and/or the cutoff for classifying positive and negative results.
Example Precision Interval when Cutoff = LoD
The limit of detection (LoD) can be determined as described below for a quantitative method. A blank sample is analyzed with 20 replicates and the Limit of the Blank (LoB) calculated from the mean and SD, as follows:
LoB = Meanblk + 1.65 SDblk
Next 20 replicates are determined for a low positive sample, the meanpos and SDpos calculated, and the Limit of Detection (LoD) calculated, as follows:
LoD = LoB + 1.65 SDpos
The figure here illustrates a test with a continuous internal response (top half) compared to a test with only a binary output (bottom half) for the condition where the LoD is equal to the CO.
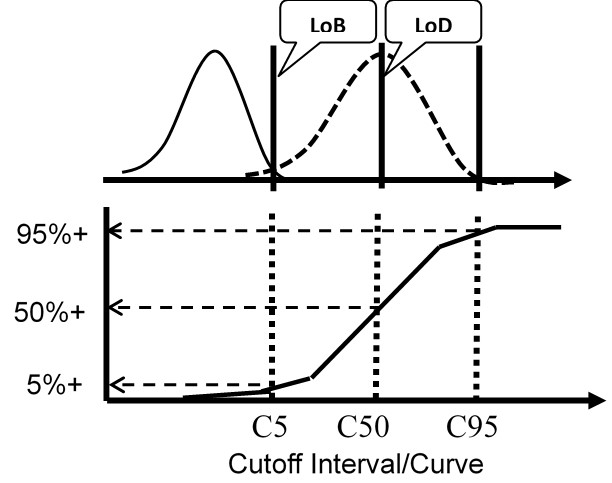
For the test with ICR, the means and SDs are determined for a blank sample and a low positive sample and the LoD calculated from the equations above. For the test with binary results only, the positive proportions of replicate measurements at concentrations of C5, C50, and C95 are determined to characterize the probability distribution.
Again, the important idea here is that the cumulative probability distribution provides an alternate way for evaluating the uncertainty of the test at the cutoff. Instead of analyzing replicates to determine a mean and SD, replicates are analyzed to determine the positive proportion, positivity rate, detection rate, or “hit rate.” Those results then characterize the cumulative distribution that describes the variation or uncertainty in the classification of patients at the cutoff limit.
Precision, Limit of Detection, Cutoff Interval
These three characteristics – precision, limit of detection (LoD), and cutoff (CO) interval – are very interconnected. The intended clinical use of the test may drive the optimization by choice of cutoff. The LoD may be the cutoff for classifying patient results as positive or negative in order to maximize the Sensitivity (Se) of the test. Sometimes the cutoff is set higher than the LoD to improve the specificity (Sp) of the test. This might also be thought of as using a limit of quantification (LoQ) to limit false positive results. LoQ represents the minimal detectable concentration at a stated performance level, e.g., at a 10% CV or a Total Error of 20%. That concept is useful for understanding the verification of the cutoff interval by analysis of specimens with concentrations of C50 ± 20%, which should approximate a method CV of 10%.
It is interesting to contrast a diagnostic RT-PCR test for COVID-19 with an antibody test that may be used for surveillance of the population. The analytic capabilities of molecular PCR tests can provide both high analytical sensitivity and high analytical specificity, but clinical performance is likely limited by the many pre-analytic and sampling variables, particularly the difficulties in obtaining reliable specimens. The net result is the test may have low clinical sensitivity, which means there will be patients with false negative results who will continue to spread the virus.
For antibody tests, a positive test result is a good outcome because it implies immunity to COVID-19 disease (this is assumed but not yet proven). Subjects with positive test results are considered safe, whereas subjects with negative test results may need to be restricted. In this situation, a false positive result leads to a dangerous situation where a subject is assumed to be safe, but may still become infected or infect others with the disease.
Optimization of cutoffs is critical in both situations, but the objectives are different and opposite. Setting the cutoff as close to the LoD is useful for RT-PCR, but setting the cutoff above the LoD would be a better strategy for antibody testing. The point is – it is critical to have information about detection limit and the cutoff interval to optimize the performance of binary tests. Even though the FDA seems to have less interest in LoDs and cutoffs than clinical agreement, a laboratory needs that information to understand the performance of the tests being implemented.
Verification of Cutoff Interval
Control materials are desirable for this testing, though appropriate patient samples or pools may also be used. Manufacturers often provide positive and negative controls with their tests, but it is important to include independent controls when possible. One concern is that positive controls sometimes are very, very, very positive, whereas there is a need for at least one control to be close to the detection limit or cutoff interval. For determination of LoD, a blank sample needs to be analyzed at least 20 times to determine the mean and SD. Next a weak positive sample is analyzed 20 times to determine its mean and SD. For characterizing the interval about the cutoff, the CLSI EP12 guideline recommends preparation of 3 solutions at C50, C50 – 20%, and C50 + 20%. These solutions should be analyzed over a 5 day period to obtain 20 to 40 replicate results at each of these concentrations. The first objective is to confirm that the C50 solution is close to the middle of the imprecision interval. The second objective is to confirm that the width of the interval is within C50 ± 20%, implying a CV of approximately 10% that would be generally considered good performance.
Interpretation of detection rates. The proportion of positive results should be determined for 10 to 40 replicate analyses at a minimum of 3 concentrations near the cutoff. Data can be summarized by detection rates or “hit rates.” Results can be interpreted by comparison to confidence limits in terms of numbers of positives or negatives expected. See the table below for the upper and lower number of replicates that may be expected for different proportions in the cutoff interval. For example, if 20 replicates were analyzed at the mid-interval concentration of C50, it is expected that as few as 6 and as many as 14 would be positive. If 40 samples were analyzed at the end of the cutoff interval (C95), the numbers that are positive should be between 35 and 40.
|
Cutoff (CO) Interval |
Proportion |
Number of Replicates |
Low Number of Positive Results |
High Number of Positive Results |
|
C5 |
0.05 |
20 |
0 |
3 |
|
40 |
0 |
5 |
||
|
C25 |
0.25 |
20 |
1 |
9 |
|
40 |
5 |
15 |
||
|
C50 |
0.50 |
20 |
6 |
14 |
|
40 |
14 |
26 |
||
|
C75 |
0.75 |
20 |
11 |
19 |
|
40 |
25 |
35 |
||
|
C95 |
0.95 |
20 |
17 |
20 |
|
40 |
35 |
40 |
For Lab Developed Tests, the complete cutoff interval should be documented. This is commonly described as the C5-C95 interval. C5 is the concentration at which only 5% of results are positive, C25 indicates 25% positive, C50 50% positive, C75 75% positive, and C95 95% positive. Several concentrations should be analyzed by 20 to 40 replicates to document the s-shaped curve for the cutoff interval. See CLSI EP12 for more detailed discussion and examples [1].
For Nucleic acid amplification tests (NAAT), the experiment and data analysis are more complicated. CLSI EP17-A2 [3] recommends the use of probit calculations to determine the upper limit of the cutoff for detection (C95). We have examined that recommendation in other discussions on this website.
We interrupt this discussion….
In the logical order for discussion, the next topics are already covered in essays on this website, so we will refer to them here, rather than repeat them. Further discussion or LoD and probit analysis is provided in two other postings that trace the use of “probit analysis” to agricultural scientists who studied the effectiveness of insecticides, i.e., the “kill rate” as a function of dosage. That is a connection to the term “hit rates” which is used in medical testing applications. Another major topic is the Clinical Agreement Study, where we have previously posted discussion of Clinical Sensitivity (Se) and Specificity (Sp), or percent positive agreement (PPA) and percent negative agreement (PNA). This is followed by a discussion of the Predictive Value of positive results (PVpos, PPV) and Predictive Value of negative results (PVneg, NPV). We recognize Se and Sp are the primary performance characteristics of qualitative tests, but emphasize that the prevalence of disease in the population of interest is critical for determining the medical usefulness of a test, which is described by its predictive value. The interrelationships between Se, Sp, Prev, PVpos, and PVneg are illustrated using simple Excel calculators, which provide valuable learning tools for understanding the performance of qualitative tests. We also provide 2 online calculators for your use. Finally, there is the topic of “analytical specificity and cross reactivity for which a brief discussion is provided here, along with some concluding thoughts that emphasize important points.
Limit of Detection and Probit Analysis
Westgard JO, Westgard SA. Probit Analysis 1: Practical application to determine limit of detection. www.westgard.com/probit-part-one.htm
Westgard JO, Carey RN. Probit Analysis 2: Issues with verification limit of detection. www.westgard.com/probit-part-two.htm
Clinical Agreement Study
Westgard JO, Garrett PA, Schilling P. Estimating clinical agreement for a qualitative test: A web calculator for 2x2 contingency test. www.westgard.com/qualitative-test-clinical-agreement.htm
Clinical agreement calculator: http://tools.westgard.com/two-by-two-contingency.shtml
Westgard JO, Westgard SA. A review of predictive value of laboratory tests. www.westgard.com/predictive-value.htm
Predictive value calculator: http://tools.westgard.com/predictive.shtml
Analytical Specificity and Cross Reactivity
Given there now is a family of 7 corona-viruses, the ability to distinguish the SARS-CoV-2 virus from others will be critical, especially during flu season when the other viruses are expected to be prevalent. For NAAT, FDA will accept an insilico (computer) assessment of cross-reactivity. For antibody tests, most adults over 50 are expected to have been exposed to the other coronaviruses and therefore may already have antibodies to those viruses. For these reason, analytical specificity needs to be examined, particularly in the form of cross reactivity to other viruses.
The antibody tests, FDA recommends testing 75 patient specimens obtained prior to December 2019 [3]. If clinical specificity is ≥ 98%, then no further testing of specific viruses is required. If not, then FDA recommends testing 5 patient specimens having each of the following viruses:
- anti-influenza A (IgG and IgM)
- anti-influenza B (IgG and IgM)
- anti-HCV (IgG and IgM)
- anti-HBV (IgG and IgM)
- anti-Haemophilus influenza (IgG and IgM)
- anti-229E (alpha coronavirus)
- anti-NL63 (alpha coronavirus)
- anti-OC43 (beta coronavirus)
- anti-HKU1 (beta coronavirus)
- ANA
- anti-respiratory syncytial virus (IgG and IgM)
- anti-HIV
In addition, FDA recommends that tests that differentiate between IgG and IgM should establish class specificity. “One recommended approach includes treating the specimens with dithiothreitol (DTT) where the final IgG result will remain unaffected and the final IgM signal will decrease or be negative.” Five samples that are positive for both antibodies should be tested in duplicate and 100% agreement with the expected results should establish antibody class specificity.
What’s the point?
Qualitative tests produce binary results, yes/no, positive/negative answers. Some actually provide an internal continuous response signal that is converted to a binary result as a function of a signal to cutoff ratio. For tests with an internal continuous response, some characteristics such as the limit of detection may be validated in the same manner as for quantitative tests. Furthermore, the cutoff may be optimized to maximize the sensitivity or specificity of the test.
Analytical sensitivity is related to the limit of detection (LoD). Precision is related to the uncertainty of classification due to the imprecision of the cutoff interval (CO). The LoD and CO could be the same, so these characteristics and their validation are intertwined. For binary outputs, they are evaluated by a replication type of experiment with the resulting data presented as counts, “hit rates”, ratios, proportions, and percentages. Performance may also be described in relation to the probability distribution of a normal curve, i.e., C5, C50, C95, where the concentrations represent probabilities or positivity rates of 5%, 50%, and 95%. Validation studies may not pay much attention to LoD or CO, but they are important, especially for ELISA type assays where clinical sensitivity and clinical specificity often depend on the CutOff.
Accuracy relates to the correctness of clinical classification and analytical specificity to cross reactivity and interference. Validation studies emphasize the Clinical Agreement Study. The number of specimens required has been increasing as COVID-19 patients have become more prevalent. As of May 2020, the FDA recommended 30 positive and 75 negative, whereas the CLSI EP12 guidance is 50 positive and 50 negative. The negative specimens are commonly taken from salvaged specimens stored before December 2019, prior to COVID-19.
The primary clinical characteristics are the clinical sensitivity (Se) and clinical specificity (Sp) of the test, also commonly referred to as Percent Positive Agreement (PPA) and Percent Negative Agreement (PNA). For molecular tests used for diagnosis, FDA recommends a minimum Se of 80% and Sp of 95%. For antibody tests for surveillance, FDA recommends a minimum Se of 90% and Sp of 95%.
The medical usefulness of a test depends on its predictive value, i.e., the expected probability or chance of being correct. Predictive value is a function of Se, Sp, and the prevalence of disease (Prev) in the population being tested. It is essential to estimate the predictive value to understand the practical usefulness of a test. For example, a test with a positive predictive value (PPV, PVpos) of 80% means that 8 of 10 patients with a positive result will have the disease. A PPV of 20% would mean that only 2 of 10 subjects with a positive result will have the disease.
For molecular tests for diagnosis, a positive test means confinement and treatment, whereas a False Negative result would endanger others. Negative Predictive Value (NPV, PVneg) should be high, which depends on a high sensitivity of the test to limit False Negatives.
When it is required that patients be symptomatic in order to be tested, this creates a high prevalence application for diagnostic testing. That increases the chance for positive test results and reduces the number of false negative results, maximizing NPV. There are some suggestions that the diagnostic sensitivity one week after onset of symptoms might be increased by parallel use of a molecular test and an IgM antibody test, where if either TestA OR TestB is positive, the patient is classified as positive. This parallel testing (A OR B) increases Se.
For antibody tests for surveillance, a positive test might mean returning to the workplace (assuming antibody protection against re-infection), in which case a False Positive result may endanger the individual and others. PPV should be high, which depends on the specificity of the test in order to limit False Positives.
In low prevalence populations, a good strategy for antibody testing is to retest positive results with a second independent method. This strategy, where both TestA AND TestB must be positive, maximizes specificity, reduces False Positives, and improves PPV.
References
- Garrett PE, Lasky FD, Meier KL. CLSI EP12-A2. User Protocol of Evaluation of Qualitative Test Performance. Clinical and Laboratory Standards Institute, 940 West Valley Road, Suite 1400, Wayne, PA, 2008.
- US Dept Health and Human Services. FDA Policy for Diagnostic Tests for Coronavirus Disease-2019 during Public Health Emergency: Immediately in Effect Guidance for Clinical Laboratories, Commercial Manufacturers, and Food and Drug Administration Staff. May 4, 2020. https://www.fda.gov/media/135010/download
- CLSI EP17-A2. Evaluation of Detection Capability for Clinical Laboratory Measurement Procedures. Clinical and Laboratory Standards Institute, 940 West Valley Road, Suite 1400, Wayne, PA, 2012.